Square
Following
Hot
News
Notifications
Profile
Share your thoughts
placeholder
Article
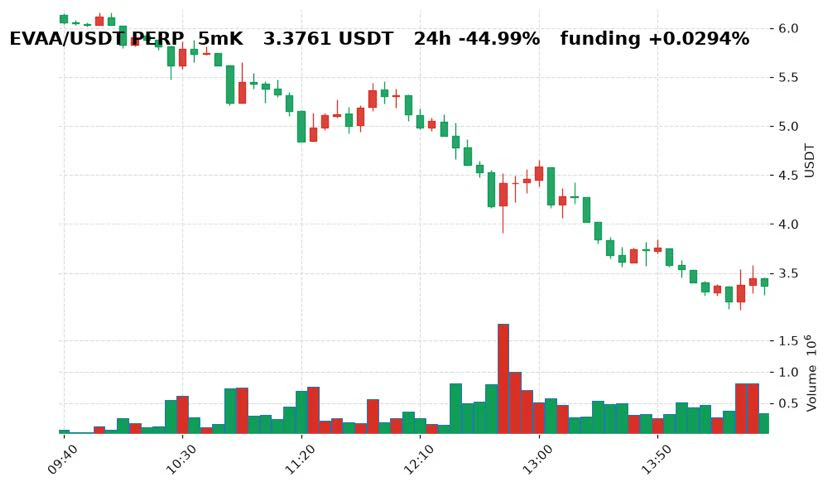
While killing time, I came across $EVAA ‌, which had jumped 5.3% in 5 minutes and is now priced at 3.3761. It still hasn’t cleared the previous high of 6.75. With my small position, I’ll just watch for now; I’ve taken too many losses from getting carried away chasing highs. 😭 The futures funding rate is +0.0294%, and I don’t touch leverage. If you were here, would you A: watch the charts or B: close the app? I choose B. #摸鱼看盘 #行情速递
post-image
EVAA-0.42%
  • 1
This time, U.S. stocks, gold, and BTC all fell in tandem, making it easy to think of historical turning points
The first scenario: 2020. After the drop, the Fed turned on the liquidity taps, and the market quickly climbed back up
The second scenario: 2022. Keep holding out, wait for inflation to come down and policy to pivot, then recover gradually
The third, and worst, scenario: 2000. The bubble really burst, and even Fed rate cuts did no good; it could take many years to get through
What’s most worrying now isn’t the drop, but which kind of cycle turning point this is
post-image
GLDX-0.40%
PAXG+0.37%
BTC-0.67%
  • 1
Trenches
IDOL
I
bade
b
IDOL
0x3b...ab07
Market Cap
$.
Change
.
24h Vol
$.
Holders
.
JAGENT
J
bade
b
JAGENT
0x8e...ae15
Market Cap
$.
Change
.
24h Vol
$.
Holders
.
PIEVERSE
P
bade
b
PIEVERSE
0x0e...25a9
Market Cap
$.
Change
.
24h Vol
$.
Holders
.
FIONA
F
bade
b
FIONA
B34n...pump
Market Cap
$.
Change
.
24h Vol
$.
Holders
.
mihao
m
bade
b
mihao
4Cxj...pump
Market Cap
$.
Change
.
24h Vol
$.
Holders
.
All Eyes on US Data This Week!

Next week, the markets will be focused on US data, set to be released on Wednesday. These figures—covering economic growth and inflation—will provide fresh insights into the Federal Reserve’s interest rate policy.

What do the numbers suggest?
Expectations point to an economic growth rate of 3.6% (up from the previous 3.4%). Regarding inflation, the headline PCE (Personal Consumption Expenditures) is projected at 3.8%, while the core PCE is expected to come in at 3.2%.

Which way is the wind blowing in the markets?
According to current CME rate projections, the
BTC-0.67%
ETH-1.26%
SOL-0.77%
NVDA-13.84%
XAUT+0.30%
  • 2
  • 1
In the early hours, when liquidity was at its thinnest, a single wick sliced through 60000, burying longs before they even had time to place stop-loss orders. So here’s the question: was this a panic-driven selloff that created a golden buying opportunity, or the first sign that the AI bubble is starting to deflate? The former is suggested by social media buzz holding firm and discussion volume staying up; the latter by stock valuations shrinking across the board and risk assets plunging in unison. I’m leaning toward the latter—the answer is hidden in the details.
post-image
  • 1
Ethereum 9ETH0 surpasses 1,7000 USDT with Narrowed 1.69 Decrease in 24 hours
live-cover
LIVE1,635
BTC-0.67%
ETH-1.26%
USDC+0.01%
XRP-1.15%
Copy this and pin it: "I will not sell my Pi to pay for data. I will not sell my Pi to impress anyone. I will sell my Pi to buy an asset that makes more money." If you agree, paste it in comments. Let's make a pact
#PiNetwork
#ShareWeekly
#GateSquare
#WCTCS9
post-image
PI-0.60%
Seven wild predictions about the future: 1: $BTC Bottom at 50,000–55,000 2: The market starts to noticeably improve in Q1 2027 3: Bitcoin will enter a trending market in Q1 2027 4: There will be a structural altcoin rally in 2027 and 2028 5: No recession or financial crisis 6: The wealth-creation effect of altcoins in this bull market cycle in 2027–2028 will exceed that of the 2024–2025 bull market cycle 7: From now until before Q1 2027 is a time to accumulate and reduce positions. I can get at least six of these seven predictions right.
post-image
BTC-0.67%
Why I Trade CRCL at the Extremes
$CRCL ‌
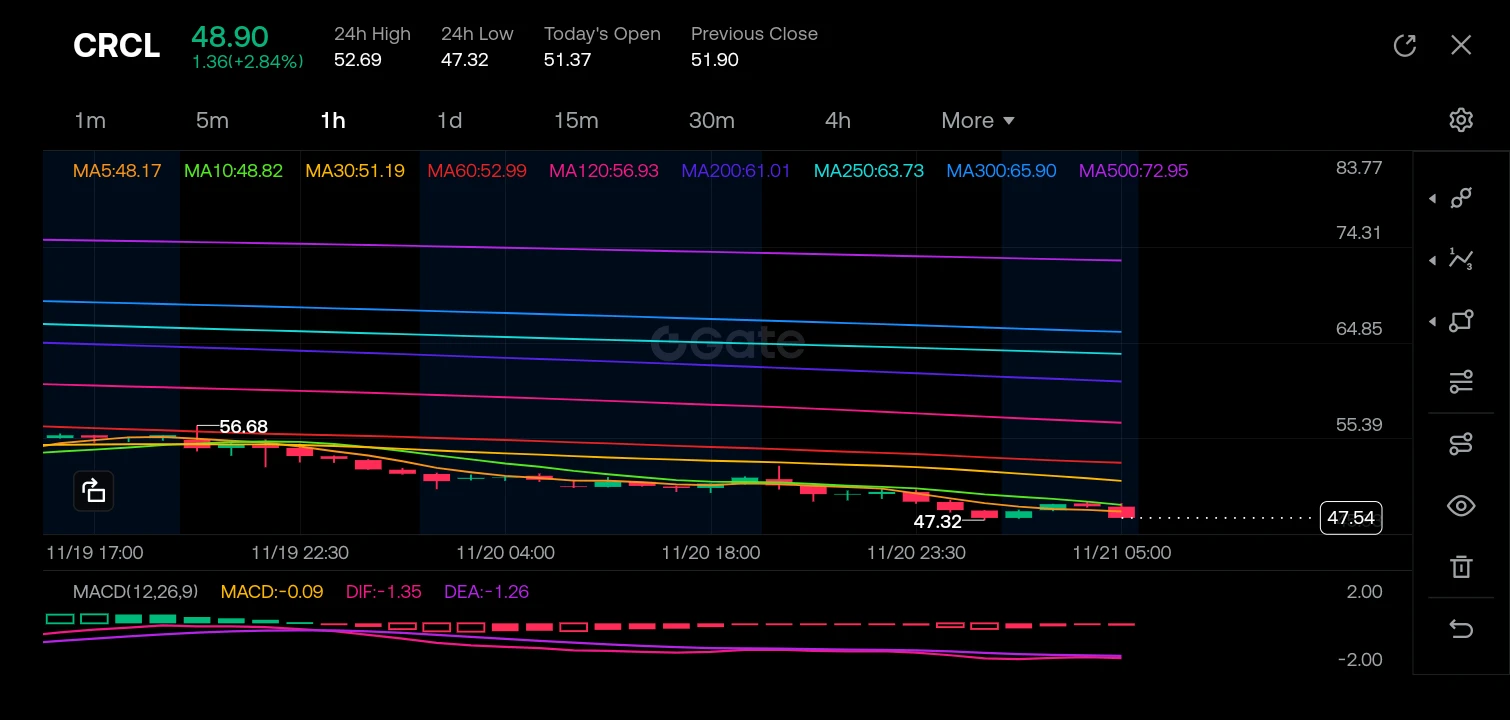
I trade when the market is overextended because that is where the mathematical probability of a mean-reversion snapback becomes statistically significant, and I trade when whale wallets diverge from retail sentiment because liquidity is being strategically accumulated against the herd. Looking at the CRCL 1-hour chart provided, the asset is currently suspended in a violent bearish vacuum, having printed a low of 47.32 before a marginal relief bounce to 48.90. The RSI is deeply oversold, price is quantifiably detached from the moving average cluster, an
post-image
CRCL-8.39%
  • 3
  • 2
Live trading - Analysis new crypto coin
live-cover
LIVE2,461
ETH-1.26%
BTC-0.67%
GT-2.41%
Happy Blessed Sunday, CT👌
post-image
With silver prices plunging, everyone on Twitter is yelling manipulation. My rule is to check the source of the evidence before taking sides—Ed Steer’s claim about eight years of short positions: I only half trust the data, but people who treat COT as conclusive proof usually haven’t looked at how delayed it is. The answer is in the details. Let’s save this take and come back tomorrow to check it. One thing I do wonder: during those few minutes of the plunge, were there still buyers on the quote screens?
post-image
  • 1
  • 1
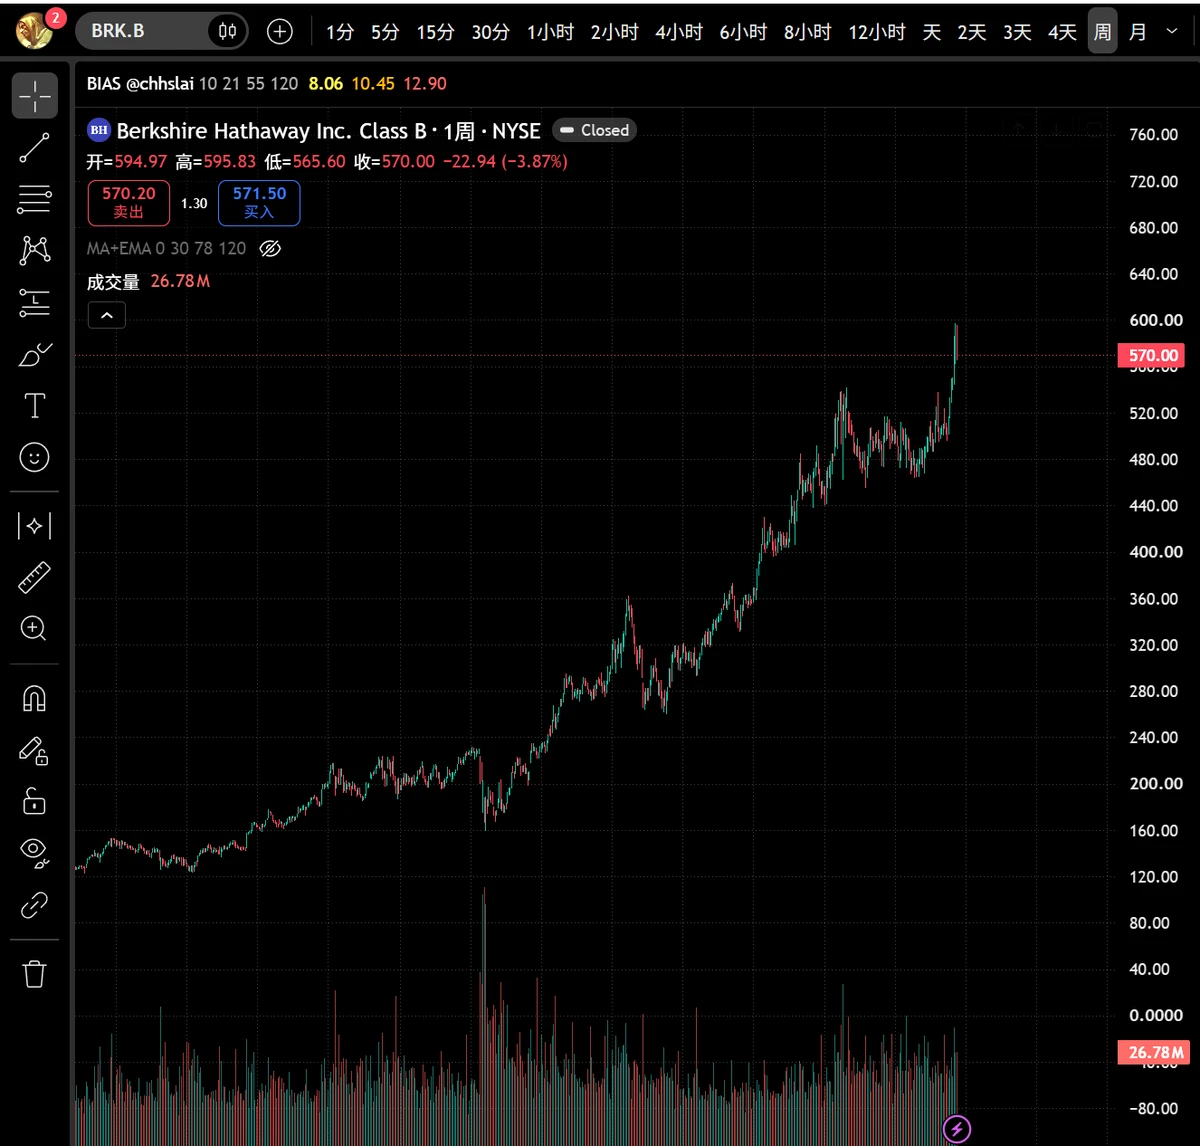
Markets around the world are falling, but people buying Berkshire stock are gaining every day, steadily...
post-image
#晒出我的持仓收益 I just want to change my life
post-image
ETH-1.23%
The 10% cap on first-day sales is bringing the “windfall of a lifetime” that many media outlets calculated back down to the realities of the balance sheet.

On November 19, Anthropic officially rang the Nasdaq opening bell under the ticker symbol ANT, pricing its shares at $83 and raising $81.3 billion. Combined with a concurrent $26 billion private placement, the offering set a record as the largest IPO in U.S. history.

Domestic tech media then identified at least 25 Chinese technical and management employees still working at the company who had benefited from this leap in wealth. The headli
post-image
ANT-8.68%
$SI One more push and it'll double
post-image
SI-0.73%
$FIL is currently attempting to reclaim the dense moving-average zone, but overhead pressure remains evident, with bears waiting near the resistance band for another entry opportunity.
Execute a short strategy on $FIL : Entry order zone: 0.5122 - 0.5165 First take-profit target: 0.4902, with 0.4709 as the next target Stop-loss: 0.5320
Note that if the price breaks decisively above 0.5160, the bearish thesis above will no longer hold, and the market may shift into a rebound structure.
Remember not to go all in with a large position; size your position appropriately based on your account size.
post-image
FIL-2.00%
Stopped by my grandpa’s on Sunday to visit him.

I really like the courtyard vibe—it takes me back to childhood. Not sure if you guys like it too. If you do, come by sometime and have some tea with me 😊
post-image
#CookBacksFurtherRateHikes 📈 Cook Backs Further Rate Hikes

Federal Reserve Governor Lisa Cook is backing the possibility of further interest-rate hikes, highlighting the ongoing focus on inflation and monetary policy.

⚠️ A more hawkish Fed stance could put pressure on risk assets, including stocks and cryptocurrencies, as traders reassess expectations for future rate cuts.

₿ For Bitcoin traders, the key question is whether tighter monetary policy could trigger another wave of volatility.

👀 Will a hawkish Fed push BTC lower, or has the market already priced in the risk?

#Bitcoin #BTC #Fe
post-image
BTC-0.67%
$PI ‌

#weeklyshare
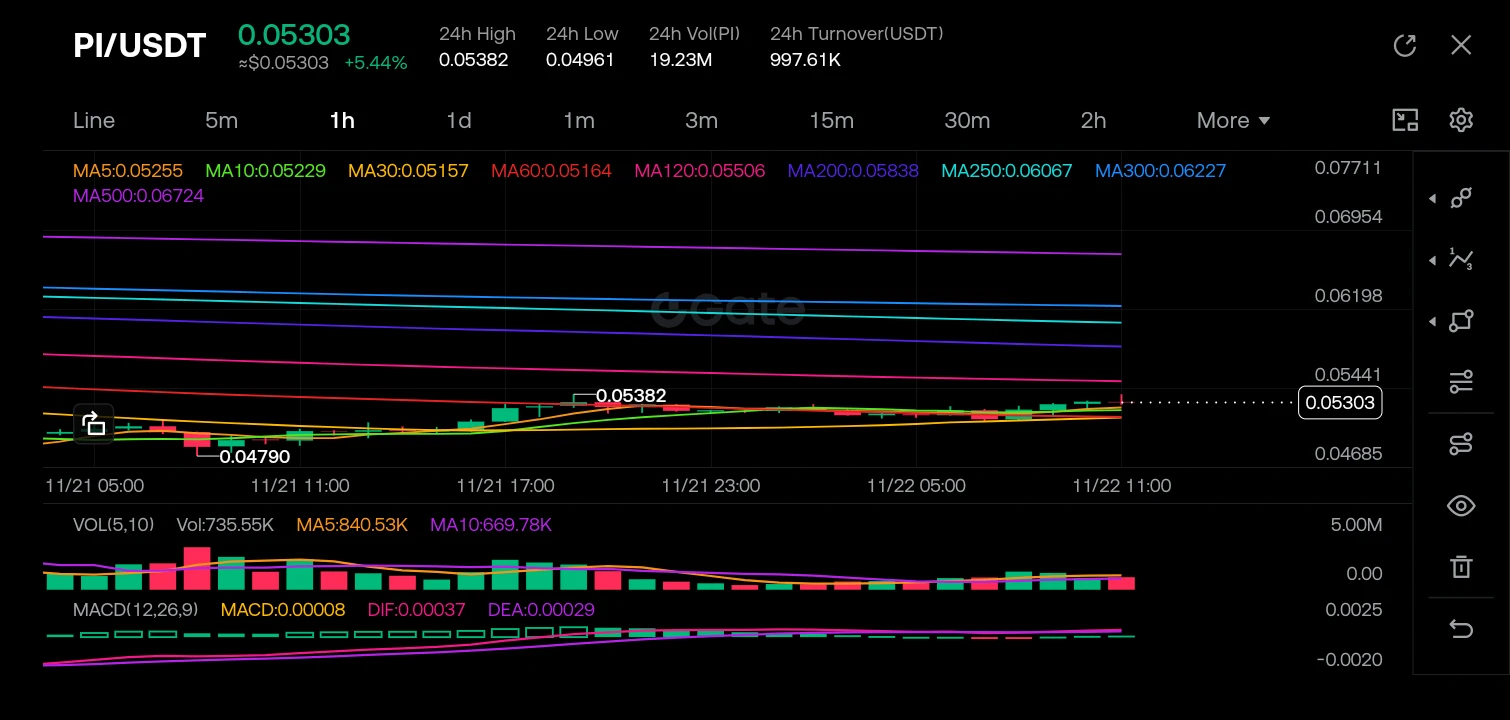
The Squeeze Before the Surge: Navigating the PI/USDT Liquidity Matrix

The PI/USDT market is currently exhibiting a classic consolidation pattern, coiling tightly after a period of volatility. While the price sits at 0.05303, reflecting a modest +5.44% gain over the last 24 hours, the true story lies in the compression of the moving averages and the shrinking volume. This is a market waiting for a catalyst—a state where whale accumulation and retail exhaustion meet at a critical mathematical pivot point. In this analysis, we will decode the structural mapping of this char
post-image
PI-0.60%
  • 1
  • 2
Load More

Join 40 M users in our growing community

⚡️ Join 40 M users in the crypto craze discussion

💬 Engage with your favorite top creators

👍 See what interests you

Trending Topics

BTCReboundFaces60KTest

2.1M Views30.1K Discussing

BTC rebounded from around $55,300 on November 21, briefly reclaiming $60,000 before pulling back to around $59,300. The $60K level is back in focus as traders assess whether the recovery can last. Is this rebound a sign of stabilization or a short-lived recovery? Would reclaiming and holding $60K be enough, or do you need confirmation from trading volume and fund flows?

PCEAndGDPDataNextWeek

258.5K Views2.6K Discussing

GateDirectIPOPhase3ANTAllocates92100Shares

820.4K Views5K Discussing

View More