Square
Following
Hot
News
Profile
Share your thoughts
placeholder
Article
Everyone’s shouting about meme coins going 100x, but I looked around and couldn’t find a single one clearly explaining what actually keeps it alive. $moin That line—“community takeover, green frog, holders vote on what happens next”—at least puts it all out in the open. It’s not selling a dream; it’s letting you roll up your sleeves and build it yourself. After all these years in market making, I believe one thing: when people are sitting on big unrealized gains, they’re most likely to lose their nerve and watch an opportunity slip away.
post-image
MEME+0.70%
Featured10.14 Wednesday Morning Market Overview: BTC Long T1 Took 1,000 Points in Profit, Break-Even Stop-Loss Watching T2
BTC formed a bullish candle with upper and lower shadows this morning, as bulls and bears battled back and forth
Yesterday I mentioned that after BTC broke through and stabilized above 8.27 again, we could go long with the trend. T1 took 1,000 points in profit and exited, while T2 remains open with a break-even stop-loss and no pressure; the previous long at 8.27 was stopped out for a 1,000-point loss, and yesterday we earned back 1,000 points, just breaking even after losing
BTC+0.61%
  • 8
  • 2
Jianing Gold Live Trading Record | Tuesday, 10.13
The market will not move in one direction forever. Volatility tests patience and execution—identify the highs and lows accurately, and small gains will add up. #外汇黄金 #黄金
GLDX-0.07%
PAXG-0.24%
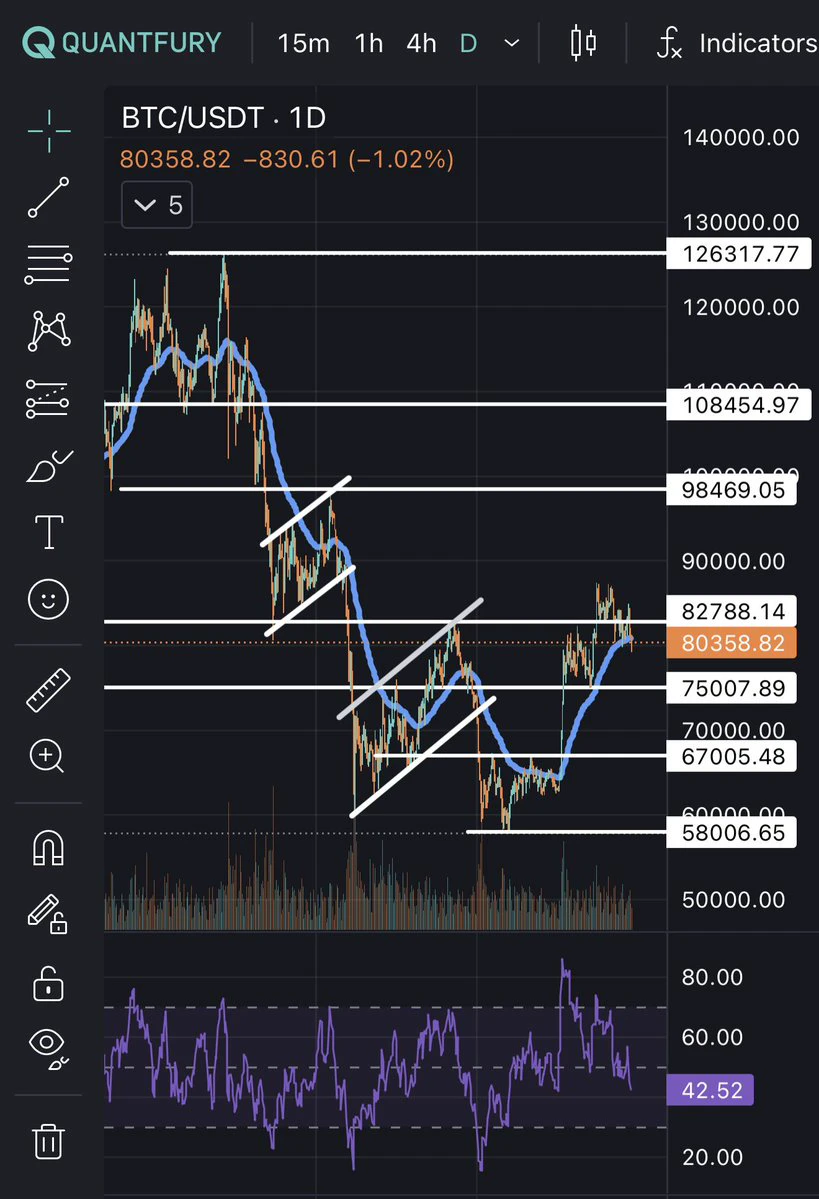
10.14 Bitcoin Price Action Analysis
After bottoming at 82912.8, the market began a round of gains, with the price continually pushing higher along the upper Bollinger Band. Long positions gradually lost momentum, and a large bearish candle broke the upward rhythm, sending the price rapidly back to the lower Bollinger Band. After the short positions were fully released, buying entered the market, the price stabilized and rebounded, and the Bollinger Bands gradually narrowed. The short-term rebound is a recovery move after the pullback, with strong resistance at the upper Bollinger Band.
$BTC
L
post-image
BTC+0.61%
10.14 Bitcoin Analysis
Analysis: Short near 83800-84200 on a rebound, stop-loss at 84500, first target 82800, second target 81500
The oversold rebound began from the period low of 80985.0, surged to a high of 84134.2, and then entered high-level consolidation. The current price is moving sideways near the medium-term moving average. Overall, this is a technical recovery following a sharp decline; the broader bearish trend structure has not been reversed, rebound momentum is gradually weakening, and selling pressure above continues to emerge. At 20:30 tonight, the U.S. Bureau of Labor Statistic
post-image
BTC+0.54%
Wednesday Morning Market Updates
live-cover
LIVE2,020
🔥 $AVA
shows a potential bullish breakout opportunity! After a prolonged downtrend from the $0.28 area, the price is attempting a strong rebound, surging significantly higher alongside a notable increase in trading volume. Buyers are entering, and if the bullish momentum continues, AVA may advance toward higher resistance levels. As volatility increases, watch whether the breakout can be confirmed and hold! 🚀Take profit: 0.3645 Stop loss: 0.2223 Long $AVA 👇
post-image
AVA+7.66%
According to foreign media reports, Iran has intensified attacks on vessels transiting the Strait of Hormuz, deploying new tactics that use small boats carrying reconnaissance personnel to identify targets in order to maintain oil prices and influence the US midterm elections. Two Iranian officials said the new strategy was launched about 10 days ago; details were not disclosed, and it had been approved by the Supreme Leader. The US said that, after destroying a substantial amount of radar capability, Iran had switched to using small boats for reconnaissance to locate targets, including US war
post-image
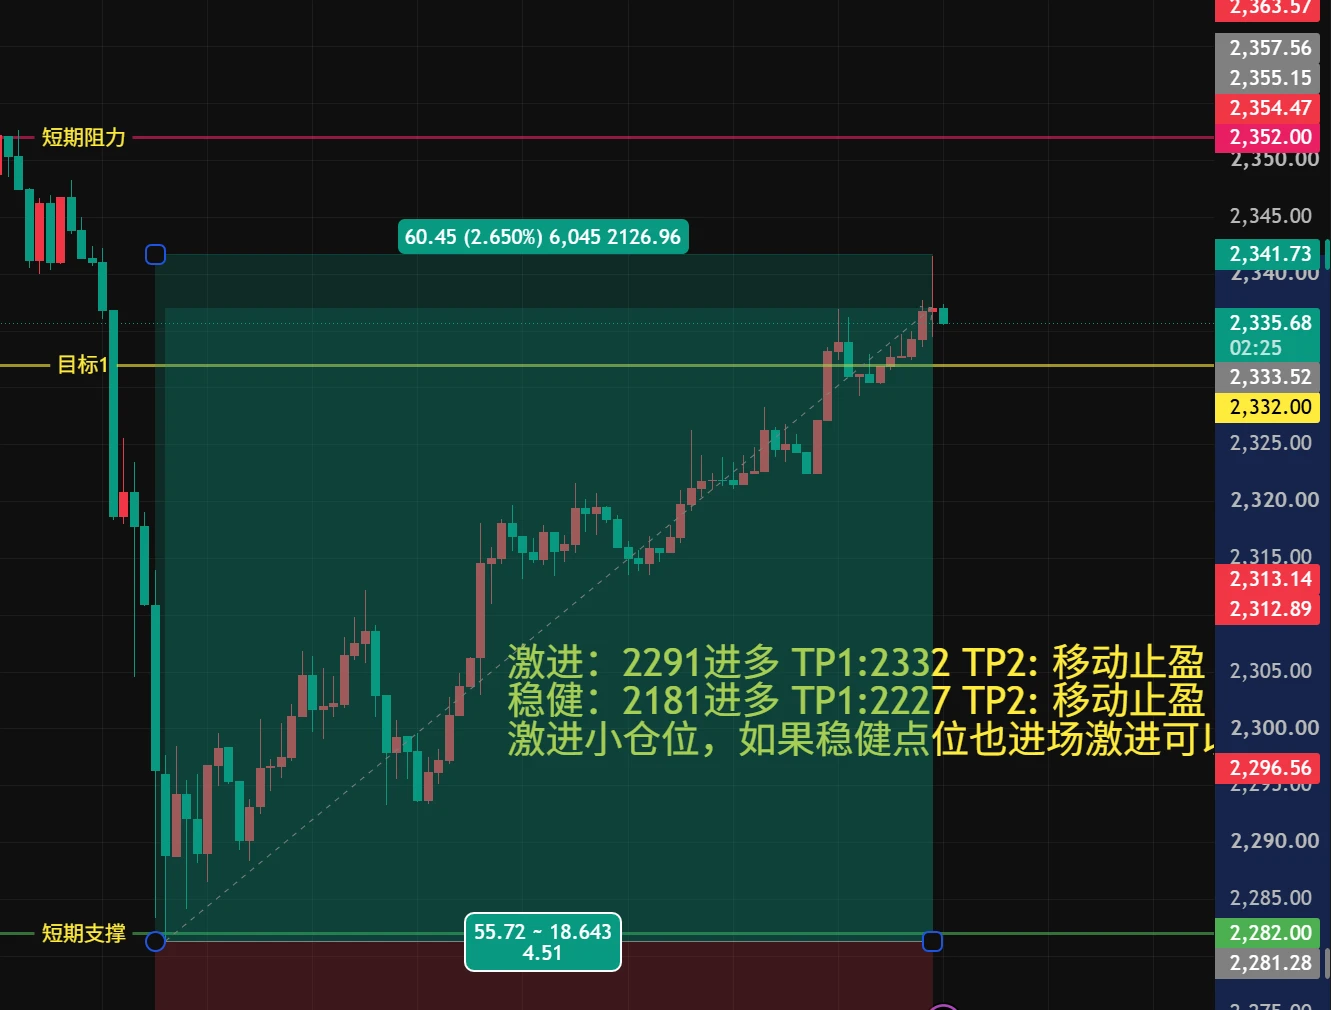
Gold posts three consecutive intraday wins
4146 long, exited at 4155, 9 o’clock, 1243🔪$XAUT
post-image
XAUT-0.19%
A small Stablecoin survey launched by PCT has appeared on the Pi app screen
The “Pi Ecosystem Participation Survey” released by PCT comes against the backdrop of Pi Network’s formal announcement in early October 2026 that it was exploring Stablecoin integration. The survey itself aims to understand users’ acceptance of the reward mechanism and funding scale before official implementation.
PI+1.48%
  • 1
solana:6zGdZJ6FdQz9TjLTaFwRrEvLjtENQYYkY7AyFhd3pump
HKJa4Y8actmpGvHpgL6DBWjsUjVt8r6bmvPaV33fpump
#crypto
post-image
SOL+0.74%
Most people: See a choppy uptrend, target 86,000;
Bearish capital: Bet on a pullback to 80,000, a defensive wager;
Extreme bulls: Bet on a breakout to 88,000, with high odds but very low market acceptance.
post-image
#StrategyRepurchases369MSTRC $950.8M in STRC Buybacks vs. $369.7M in Bitcoin Purchases: Strategy’s Capital Allocation Shift
Strategy’s Bitcoin treasury strategy is entering a phase where capital allocation matters as much as accumulation. The company is not only managing its Bitcoin holdings; it is also actively managing the preferred securities that form part of its broader financing structure.
A key comparison emerged in September 2026: Strategy spent approximately $950.8 million repurchasing STRC preferred shares between July 20 and September 13, compared with $369.7 million spent acquiring
STRC+0.02%
BTC+0.54%
MSTR-0.38%
A four-year-dormant old whale suddenly came alive today, moving all 4,582 BTC at once. What does four years mean? Sleeping through the last bear market, then riding this cycle from $20,000 to $83,000—when he opened his eyes, the first thing he did was make a transfer.
What for? I honestly have no idea. If he wanted to sell, he wouldn’t make such a big show of it; if he wanted to hold, he wouldn’t move it after four years. The only thing I’m sure of is this: if he shakes things up by 1%, the right way to approach this market is to pull up a stool and watch the show—don’t get yourself dragged in
post-image
BTC+0.54%
#美国9月CPI即将公布 #CPI Bitcoin’s Next Volatility Test: Can September Inflation Change the Fed Outlook?
The next major macroeconomic catalyst for Bitcoin is approaching. On October 14, 2026, the United States is scheduled to release its September Consumer Price Index (CPI) report at 8:30 AM Eastern Time, equivalent to 20:30 UTC+8. With inflation expectations, interest-rate policy, and risk appetite all in focus, this report could set the tone for the next phase of crypto-market volatility.
But the key question is not simply whether inflation rises or falls. It is whether the actual numbers surprise
Falcon_Official
#USCPISoon September Inflation Could Reset the Fed’s Next Move: Energy Shock, Core CPI and the Market Reaction Test
The next major US inflation report arrives on October 14, and markets are approaching it with a difficult combination of elevated energy costs, persistent underlying inflation and uncertainty over Federal Reserve policy. The September Consumer Price Index (CPI) will be released by the US Bureau of Labor Statistics at 8:30 a.m. Eastern Time, equivalent to 5:30 p.m. Pakistan time. As of October 13, the figures have not yet been released, so the numbers investors are discussing are forecasts, not confirmed results.
The numbers markets are watching
Economists surveyed in recent market reports expect headline CPI inflation to rise to approximately 3.7% year over year in September, compared with 3.4% in August. Core CPI, which excludes food and energy, is forecast at around 2.5%, up from 2.4%. The difference between these two measures is central to interpreting the report: headline inflation captures the direct effect of volatile energy and food prices, while core inflation provides a clearer view of underlying price pressures.
August already showed renewed pressure. The headline CPI increased 0.4% month over month, while gasoline prices rose 3.9% and the broader energy index increased 2.1%. Shelter costs also rose 0.3%. These figures suggest that the September report must be examined beyond its annual headline number: the monthly change, energy contribution and persistence of service-sector inflation all matter.
Why energy could distort the headline
Oil prices have become a major variable in the inflation outlook. Brent crude was reported around $106.65 per barrel on October 12 amid concerns about Middle East supply disruptions. Higher crude prices can feed into gasoline, diesel, transport and distribution costs, placing renewed pressure on household budgets and business margins.
This creates an important analytical distinction. If headline CPI accelerates while core inflation remains relatively moderate, the increase may be driven largely by energy rather than a broad resurgence in consumer demand. That would still matter for households and inflation expectations, but the policy implications could differ from a report showing simultaneous acceleration across housing, services and other core categories.
The key question is whether higher energy costs remain a temporary shock or begin spreading into broader prices and wages.
Three scenarios for markets
A softer-than-expected report could ease pressure on Treasury yields and support rate-sensitive assets. If core inflation rises only modestly and monthly price increases remain contained, investors may become more comfortable with the possibility that the Fed can avoid additional tightening. Growth stocks, technology shares and other long-duration assets could benefit, although the reaction would also depend on earnings expectations and market positioning.
A hotter report would create a different test. If both headline and core inflation exceed forecasts, markets could reassess the risk of further rate increases or a longer period of restrictive policy. Treasury yields and the US dollar could strengthen, while expensive growth stocks and other interest-rate-sensitive assets face valuation pressure.
A mixed result may be the hardest to interpret. Headline inflation could rise because of energy while core CPI remains close to expectations. In that case, traders will need to assess the composition of inflation rather than treating the headline figure as a complete signal. These are conditional scenarios, not predictions of the actual release.
The Federal Reserve’s dilemma
The Fed must balance price stability against economic activity. Inflation remaining above its 2% objective complicates any move toward easier monetary policy, but higher interest rates also raise borrowing costs for households and businesses. Market commentary ahead of the release indicates that policymakers are weighing whether incoming inflation data justify further tightening, with the September CPI report an important input.
One report will not determine the entire policy path. The Fed also considers employment, consumer demand, inflation expectations and other price measures, including the Personal Consumption Expenditures index. Investors should therefore avoid treating a single monthly CPI print as a guaranteed signal of the next rate decision.
What traders should monitor after publication
The first comparison is actual headline CPI against the approximately 3.7% annual forecast. Next, compare core CPI against the 2.5% estimate. Then examine monthly changes and the contribution from energy, shelter and services. Finally, watch the response in Treasury yields, the dollar, equity futures and crypto markets.
For digital assets, the transmission mechanism matters more than the inflation headline alone. A softer report that lowers yield expectations may improve risk appetite, while a stronger report that pushes yields higher could pressure leveraged positions and speculative assets. However, crypto prices can also move independently because of liquidity, positioning and asset-specific news.
The most useful approach is to define scenarios before the release, manage position size and avoid entering a trade solely because the first headline appears bullish or bearish.
The bottom line
#USCPISoon is a test of whether rising energy costs are driving a temporary acceleration in headline inflation or accompanying broader price pressure. The market enters the release with September headline CPI forecast near 3.7% and core CPI near 2.5%, but the actual figures will determine whether those expectations need to change.
The strongest signal will come from the relationship between headline inflation, core price momentum and the market’s reaction in yields and the dollar. For Gate Square traders, the priority is not to guess the number it is to prepare for the different outcomes, distinguish forecasts from actual data and let confirmed evidence guide risk decisions.
repost-content-media
BTC+0.61%
Load More

Join 40 M users in our growing community

⚡️ Join 40 M users in the crypto craze discussion

💬 Engage with your favorite top creators

👍 See what interests you

Trending Topics

DrLinHanSpeaksAtOxfordUnion

134.67k Views1.85k Discussing

Gate Founder & CEO Dr. LinHan has been invited to speak at the Oxford Union, a 200-year-old debating society that has hosted Einstein, Hawking, and Churchill. He will discuss crypto, the future of money, and what Gate Money means for global value movement. First trading platform on this stage. Nov 12 at Oxford. [👉 Learn more](https://oxford-union.org/event-6845310)

USCPISoon

24.63k Views1.67k Discussing

GateWCTCS9GlobalTradingCompetition

36.76k Views5.93k Discussing

View More