Share your thoughts
placeholder
Article
The overall yearly curve has remained in a sustained downtrend. The market initially priced in a high probability of approval at the start of the year, but expectations continued to decline thereafter; after entering the second half of the year, they fell further and are now stable in a low range, while bullish confidence continues to weaken.
post-image
These gains have me feeling nervous, afraid the market will catch on tomorrow and blacklist me.
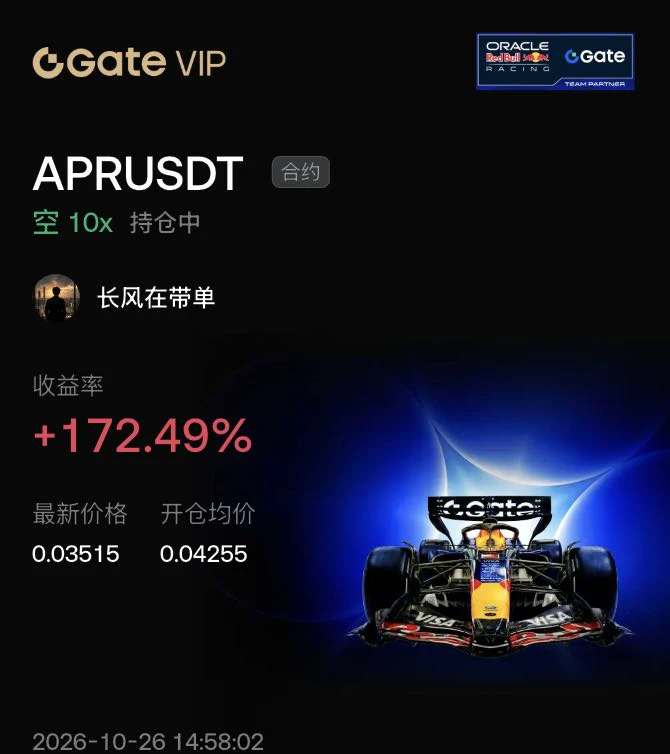
When I opened the chart this morning, it was still grinding. The key was that the bottom hadn't broken, while volume was quietly picking up—the signs of funds entering were far too obvious. With such a signal right in front of me, not taking it would have let down all the late nights I put in. So I entered directly at 200.9, set my stop-loss, closed the software, and went back to work.
When I returned to my computer, the price had already reached 277.1, with a position return of +1832.71%. The more
post-image
BTC-0.33%
LAB-5.13%
JUST IN: Kioxia denies any plan to cooperate with SK Hynix, aiming to curb AI memory-chip price tensions by avoiding capex-led supply boosts. $BTC? (No, avoid adding ticker unless relevant)
post-image
SK Hynix+3.62%
SKHY+4.77%
SKHYV-0.98%
pons market cap rebounds above $1M can it push higher
live-cover
LIVE1,942
9/9/ETH/Prince Strategy/
Current price 2497.15; after bottoming, it is moving upward amid consolidation. The price has stabilized above the Bollinger midline, with a strong short-term bias.
- Upside resistance: 2506‑2508, the previous high resistance. Holding above this level would further open up room for a rebound.
​- Downside support: 2486, the Bollinger midline and today's short-term strength/weakness threshold; holding it would allow the rebound to continue, while breaking below it would weaken the market again.
Without further ado, today's strategy:
Suggested entry: Go long on a pullbac
post-image
ETH+0.19%
I was just about to go to the forum and rant, but then I looked at my balance and thought, forget it—the market is always right. I originally thought this trade might get buried, but the balance turned out much better than I expected.

While everyone else was running, I saw the buying pressure getting stronger instead. The price couldn’t fall any further, and the hidden accumulation orders became increasingly dense. It was obvious that someone was collecting chips at this level. The pit created by panic selling instead became a golden opportunity. I said it plainly at the time: this level was
post-image
LAB-5.13%
SNDK-2.87%
The overall full-year curve has continued to trend downward. At the beginning of the year, the market had relatively high expectations for approval, but those expectations continued to decline; after entering the second half, they fell further and are currently stable in a low range, while bullish confidence continues to weaken.
post-image
🌅 GOOD MORNING & HAPPY WEDNESDAY, CRYPTO FAMILY! 💚📈
A new day, a fresh opportunity, and another important session for the crypto market! 😀😜
🔹 BITCOIN WATCH 👑
Bitcoin is currently trading around the $78K–$BTC zone after pulling back from last week’s highs above $ETH The market is showing caution as traders prepare for important U.S. economic data and the upcoming Federal Reserve decision.
For BTC, the key focus remains on whether bulls can reclaim the $80Kpsychological level and build enough momentum for another move higher. A sustained recovery above resistance could improve market sentim
post-image
BTC-0.36%
ETH+0.19%
  • 2
Xmoney has launched—is this bullish for DOGE?
post-image
DOGE-0.58%
JUST IN: On-chain BNC4 supply hits ~984.5k with a 12.57% premium to its underlying US-listed stock BNC. If the premium persists, on-chain liquidity could attract broader trader attention to tokenized stock plays. $BNC 4
post-image
BNC+2.04%
Trading is like observing an iceberg: the candlestick chart is visible, but what is invisible is the inner demon
The iceberg metaphor: above the water are visible behaviors, while 90% underwater consists of invisible subconscious thoughts, desires, and obsessions. What truly drives trading behavior is the part underwater
Iceberg layers (from a trading perspective)

🌊Above the water (visible: behaviors and words, accounting for 10%)

These are the outward appearances that outsiders, and even traders themselves, can see:

1. Trading behaviors: buying the bottom and selling the top, taking he
post-image
$CYS This is the last time.
post-image
CYS-20.44%
Spot Gold:
Gold has rebounded into the 4370-4380 resistance range. The short-term 5-minute chart shows a stalling signal, with the three KDJ lines forming an overbought death cross.
Go short around the current price of 4375, with a stop loss at 4385 and a downside take-profit target of 4350#黄金 #伦敦金 $XAUUSD
post-image
XAUUSD+0.54%
Insiders are quietly stacking shorts on $PONS /USDT while the rest of the market sleeps.

$PONS /USDT - SHORT

Trade Plan:
Entry: N/A – N/A
SL: N/A
TP1: N/A
TP2: N/A
TP3: N/A

Why this setup?
Why now? The 1d trend is a range, which means $PONS /USDT has been stuck in a tight band and is likely to break out soon. The 15m RSI sits at 36.43, signaling that the asset is nearing oversold territory and could be due for a sharp downward move. The 1h ATR is unavailable, but the range structure itself acts as the volatility guide, suggesting that a break from the current equilibrium is imminent. The
PONS+7.86%
#LITE##流明科技# Lumen Technology continues its doubling journey. It rose 11% today, breaking through 1,000 yuan. Figure 2 shares the wave pattern and upside target. ​​​$LITE
LITE+8.00%
Why is $SKHY /USDT still range bound when every signal says otherwise?

$SKHY /USDT - SHORT

Trade Plan:
Entry: 187.16 – 188.18
SL: 192.61
TP1: 183.97
TP2: 181.50
TP3: 177.80

Why this setup?
Why now? The daily trend is range, but the 1h ATR of 2.057052 shows enough volatility to justify a directional play. The 15m RSI at 63.12 is neutral, so momentum has not yet confirmed exhaustion. The entry zone sits between 187.16 and 188.18, giving a precise risk definition around the 1h price of 187.67. Targets are stacked at 183.97 and 181.50, with the invalidation level at 175.49 acting as the hard
SKHY+0.28%
  • 1
$MarsCoin
#Review and How Far It Could Fall
First, where it could fall
I feel it could reach the 0.6–0.8 range
Structural review:
Three pushes in a five-wave pattern
The third push stagnated
Forming a consolidation range
Breaking below it began a downward trend
---
During the surge and rise
Trading volume continued to contract
Forming a price-volume divergence
After completing a structure, it often forms a major reversal pullback
---
Three-push wedge reversal characteristics:
1️⃣: Completing three pushes
2️⃣: The third push slows down
(The third push shows a bearish structure: an acce
post-image
MARSCOIN-18.85%
$UNITREE $UNITREE I closed the position too early; I should have held on a bit longer. I thought speculative capital would stage a technical rebound, but they all got trapped. Even when the broader market rose, there wasn't a single decent rebound.
UNITREE-3.21%
The overall annual trend has continued downward. At the beginning of the year, the market had relatively high expectations for approval, but those expectations continued to decline thereafter; after entering the second half, they fell further and are now stabilizing in a low range, while bullish confidence continues to weaken.
post-image
Load More

Join 40 M users in our growing community

⚡️ Join 40 M users in the crypto craze discussion

💬 Engage with your favorite top creators

👍 See what interests you

View More