Square
Following
Hot
News
Notifications
Profile
Share your thoughts
placeholder
Article
What is Anthropic?

Anthropic is a company focused on artificial intelligence research and product development. Its Claude series of models serves individuals, businesses, and developers. The company has applied to list on Nasdaq under the proposed ticker ANT; the currently disclosed reference offering price range is $70–78 per share, with the final price subject to the official offering price.

How can you participate in the subscription through Gate?
Gate IPO Access supports submitting subscription applications using USDT:
Subscription amount: Minimum 100 USDT and maximum 3,000,000 USDT.
All
post-image
  • 1
#USOctoberPPIBelowExpectations

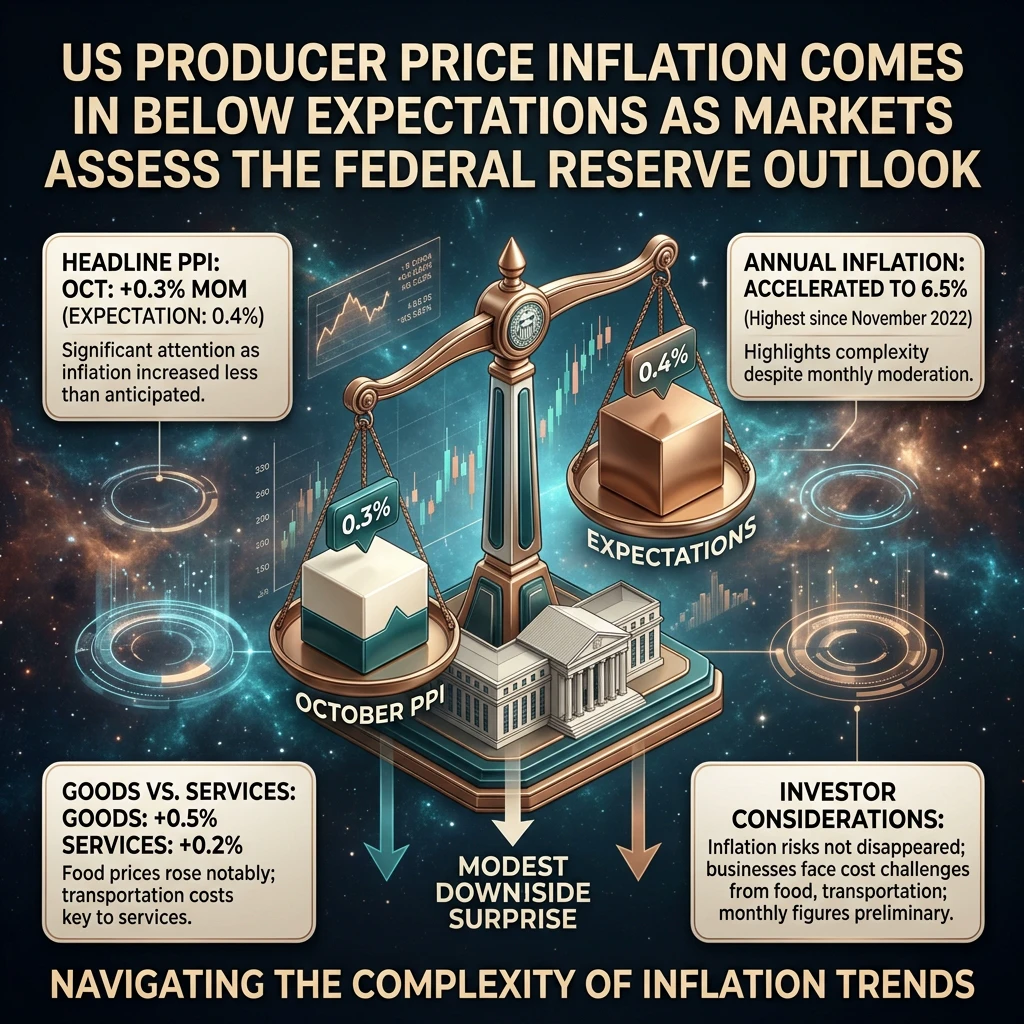
US Producer Price Inflation Comes in Below Expectations as Markets Assess the Federal Reserve Outlook

The latest US Producer Price Index report for October has attracted significant attention across global financial markets after producer inflation increased less than economists had anticipated. The headline PPI rose 0.3 percent month over month, compared with market expectations of 0.4 percent. This modest downside surprise offers an important indication of how inflationary pressures are developing across the American economy. Producer prices matter because t
post-image
BTC-0.67%
Trenches
mihao
m
bade
b
mihao
4Cxj...pump
Market Cap
$.
Change
.
24h Vol
$.
Holders
.
HOGE
H
bade
b
HOGE
FVzq...pump
Market Cap
$.
Change
.
24h Vol
$.
Holders
.
rockstar
r
bade
b
rockstar
9HFU...pump
Market Cap
$.
Change
.
24h Vol
$.
Holders
.
AGT
A
bade
b
AGT
0x5d...e274
Market Cap
$.
Change
.
24h Vol
$.
Holders
.
PIEVERSE
P
bade
b
PIEVERSE
0x0e...25a9
Market Cap
$.
Change
.
24h Vol
$.
Holders
.
What Buffett said sounds like stating the obvious, but it’s actually the toughest warning of all. Whether a 50% drop makes you panic depends on whether you really understood what you were buying in the first place. If it takes just a little weekend volume to move the market, that means hardly anyone truly believes in it—when it drops, everyone runs. Ask yourself whether what you’re holding is a company or just a string of code. Share any additional thoughts in the comments.
post-image
  • 2
  • 1
11.16 BTC Midday Market Analysis

I. Market Structure: Entering a Recovery Phase After a Sharp Drop, With Bulls and Bears Battling in a Key Zone

On the 4-hour timeframe, the price remains in a clear descending channel, with both highs and lows generally moving lower. Although a relatively strong rebound occurred near 61956, the price has yet to recover key ground lost earlier, and the medium-term bearish structure has not truly changed.

However, compared with the one-way decline, the market has shown some changes recently: after rebounding rapidly from the lows, the price did not immediately
post-image
BTC-0.65%
#黄金# Keep growing wealth. A rebound isn't far off. ​​​​$XAU ‌
post-image
XAU+0.38%
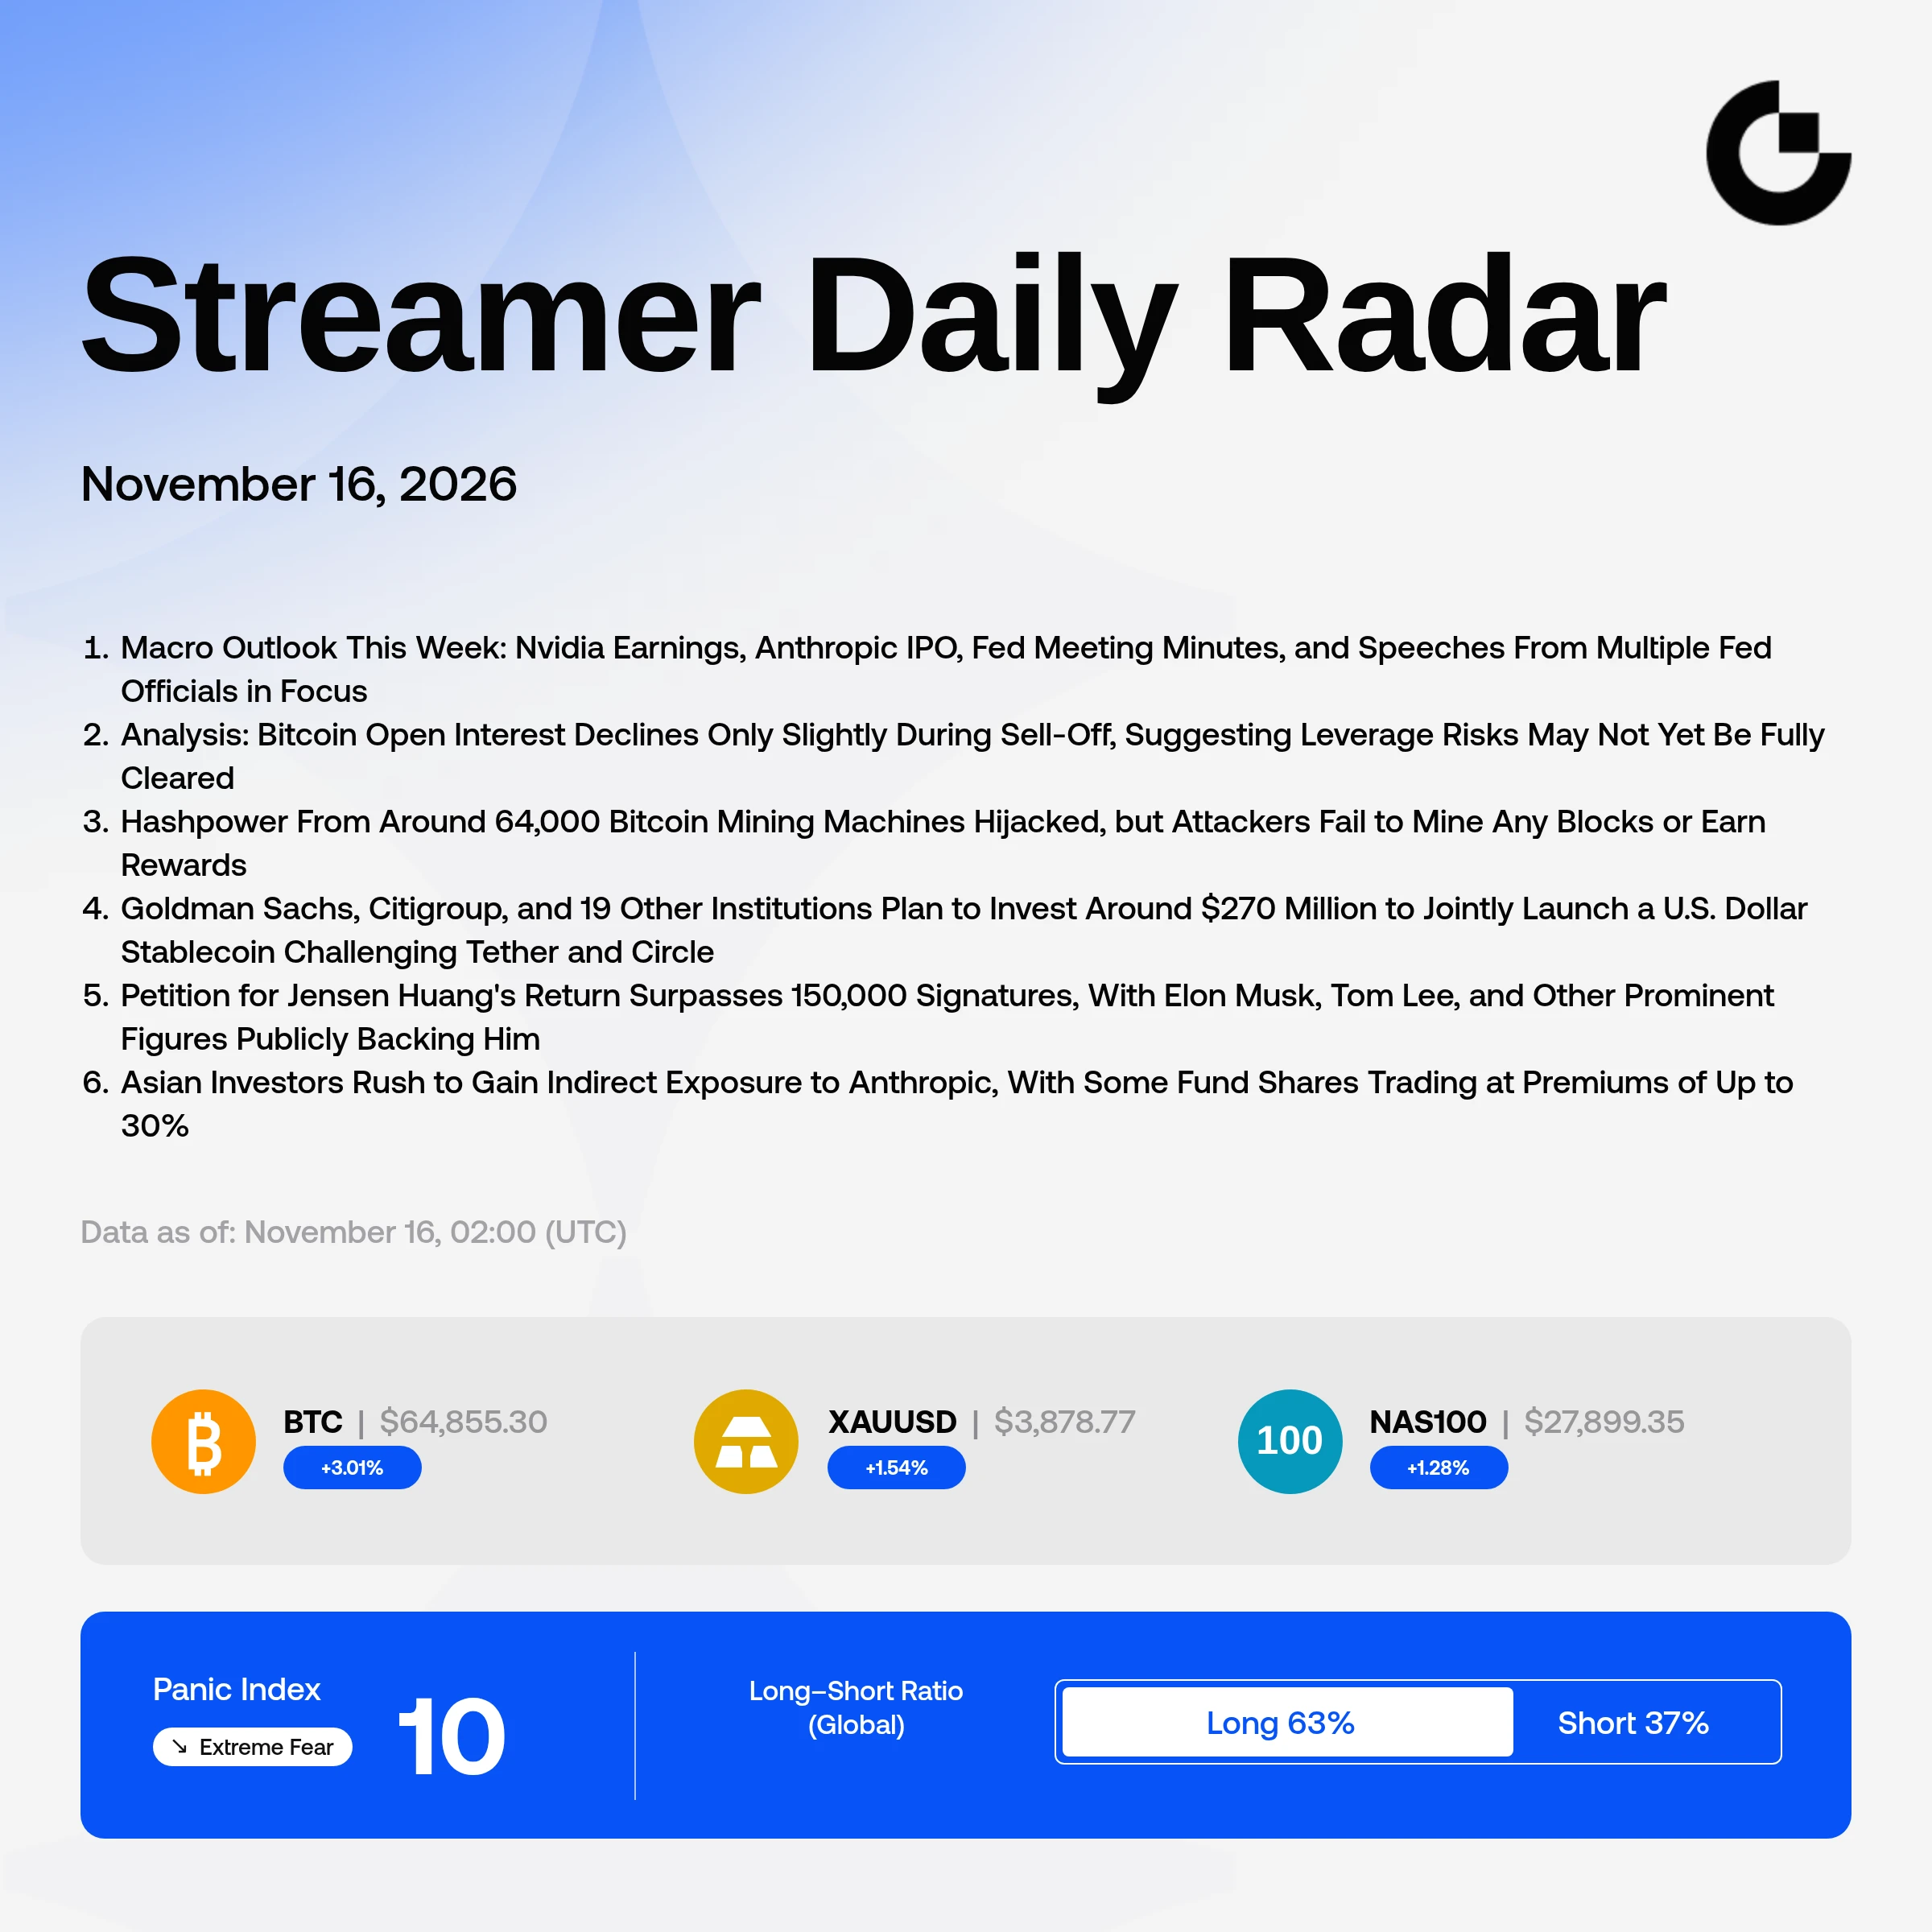
Fear Is Spreading as a Big Week for Markets Begins!
Join Gate Live to talk through the week ahead!

📉 BTC keeps falling. Has excess leverage been flushed out?
🚀 Nvidia earnings are coming. Can AI stocks turn things around?
👀 How will the Fed minutes reshape rate-cut expectations?

Tune in to Gate Live for market insights, live analysis, and trading ideas 👉 https://www.gate.com/live
GateLive
Fear Is Spreading as a Big Week for Markets Begins!
Join Gate Live to talk through the week ahead!
📉 BTC keeps falling. Has excess leverage been flushed out?
🚀 Nvidia earnings are coming. Can AI stocks turn things around?
👀 How will the Fed minutes reshape rate-cut expectations?
Tune in to Gate Live for market insights, live analysis, and trading ideas 👉 https://www.gate.com/live
repost-content-media
BTC-0.65%
NVDA-1.92%
#BTC跌破关键支撑市场陷入极度恐慌 #每周来晒 This drop looks more like a second retest in a bear market, not the start of another leg down. But funds are still flowing out, and price has yet to stabilize around $62k, so it’s too early to say the bottom is in.

Why this still looks like a retest
· The decline is within the cycle’s range: From the $126k high, the drawdown is about 49%, similar to the 2022 cycle.
· Little supply below: From $64k down to $48k, there are only about 640k coins along the way, with little support.
· Most leverage has been cleared: The gradual decline since the September high has already
BTC-0.67%
  • 4
Is U.S. Consumer Spending Suddenly Hitting the Brakes? November 17 Retail Sales Are Coming—Who Will React First: BTC, U.S. Stocks, or the Dollar?

U.S. consumers are finally being put to the test!
On November 17, the U.S. will release October retail sales data, with the market expecting month-over-month growth of 0.2%, far below September’s 0.8%. This suggests U.S. consumer spending may be shifting from a high-speed sprint to a slow cruise.
September retail sales were quite strong, and consumers seemed to have some kind of magical immunity to high interest rates and high prices. But even the d
NVDA-1.92%
How should you reallocate $100k in crypto assets today?

If you had $100k today and an investment horizon of 1–3 years, how would you allocate your crypto assets?

I believe the most important thing during a bear market is not finding the next 100x coin, but building a portfolio that can weather market cycles.

Here is an example allocation plan:

First, BTC: $35,000 (35%)

As a core asset, Bitcoin has strong market consensus and institutional recognition. It serves as the portfolio’s foundational allocation and stable core.

Second, ETH: $20,000 (20%)

Ethereum represents smart contracts and
post-image
BTC-0.67%
ETH-1.26%
SOL-0.77%
BNB-0.76%
#USRetailSales.
US Retail Sales: Strong Consumer Spending Could Become a Problem for Markets as Bitcoin Faces a Macro Test

Strong economic data is not always good news for financial markets. Sometimes, an economy that appears too resilient can create exactly the conditions that investors fear most. That is the dilemma facing markets ahead of the October US Retail Sales report scheduled for November 17 at 13:30 UTC.

The September report showed a 0.8% month-over-month increase in retail sales, highlighting the continued strength of American consumer spending. This resilience suggests that hou
NVDA-1.92%
AMD-8.76%
  • 3
  • 1
Crypto market trend from drak princess
live-cover
LIVE4,172
#AnthropicIPOSetToPriceThisWeek
Anthropic IPO: The AI Giant Preparing for a Historic Nasdaq Debut — Gate Opens USDT Subscription Access

Artificial intelligence is no longer just a technological revolution. It is becoming one of the biggest investment opportunities in global financial markets, and Anthropic is preparing to take another major step in that direction with its proposed Nasdaq IPO under the ticker ANT.

Behind Anthropic is Claude, one of the leading AI model families competing in an industry where technological innovation, computing infrastructure, and commercial adoption are beco
  • 4
Why does a stronger U.S. dollar affect gold, Bitcoin, and U.S. stocks at the same time?
Why do global financial markets often become tense when the dollar continues to strengthen? And why might gold, Bitcoin, and U.S. stocks all come under pressure at the same time?
The key factor behind this is global financial liquidity.
First, a stronger dollar means global capital allocation is shifting.
When U.S. interest rates are relatively high, dollar-denominated assets may become more attractive. Some international capital may flow into dollar deposits and U.S. Treasuries, putting other markets under
post-image
GLDX-0.40%
PAXG+0.37%
BTC-0.65%
Today's Hot Topic | BTC Drops to 64K

Technical Analysis Based on the Charts:

Daily Chart (1D): The daily timeframe shows a significant downward movement. The price declined from the recent high of 87,380 to a local low near 61,913. Currently trading around 65,000, the price is positioned well below the middle Bollinger Band at 74,343. The MACD indicator is in negative territory and the On-Balance Volume (OBV) is trending downward, reflecting sustained selling pressure over the medium term.

4-Hour Chart (4h): The 4-hour chart displays a clear downtrend structure. Following the sharp drop, th
KatyPaty
Today's Hot Topic | BTC Drops to 64K
Technical Analysis Based on the Charts:
Daily Chart (1D): The daily timeframe shows a significant downward movement. The price declined from the recent high of 87,380 to a local low near 61,913. Currently trading around 65,000, the price is positioned well below the middle Bollinger Band at 74,343. The MACD indicator is in negative territory and the On-Balance Volume (OBV) is trending downward, reflecting sustained selling pressure over the medium term.
4-Hour Chart (4h): The 4-hour chart displays a clear downtrend structure. Following the sharp drop, the price is attempting to stabilize. The MACD histogram is showing reduced bearish momentum, which suggests that the downward pressure is temporarily slowing down.
1-Hour and 15-Minute Charts (1h, 15m): On the lower timeframes, Bitcoin is in a consolidation phase around the 65,000 level. The Bollinger Bands are narrowing, and the MACD is moving flat near the zero line. This indicates a period of market indecision and low volatility following the recent price action.
Is this a short-term correction or the start of a new bear market?
Based on the daily chart, the price has broken below several key levels and is trading below its middle Bollinger Band. This price action suggests a medium term bearish trend rather than a minor short term correction. Whether it develops into a full bear market depends on if the price can hold the recent support level near 61,900 on a daily closing basis.
Would you buy the dip, accumulate gradually, or wait?
Buying the dip aggressively carries high risk given the current daily downtrend. A gradual accumulation approach is more logical, focusing on major support zones such as the recent 62,000 area. Alternatively, waiting for confirmation of a trend shift, such as a bullish MACD crossover on the 4-hour chart or the price reclaiming the 1-hour middle Bollinger Band, would be a safer strategy to mitigate downside risk.
#ShareWeekly #BTCBreaksKeySupportAsFearDeepens #WCTCS9
repost-content-media
BTC-0.67%
#英伟达财报周来袭
🤖 NVIDIA Earnings Countdown: Can AI Tech Stocks Turn a Corner?

AI chip stocks have been swinging sharply, and all eyes are back on NVIDIA. The company reports after the U.S. market close on November 17, with prior guidance pointing to roughly $108 billion in revenue. But this print lands in the middle of a leadership crisis that has reshaped the setup entirely.

🚨 The Leadership Shock: Huang Out, Comeback Bid Underway

Jensen Huang resigned as President, CEO, and board member on November 11, effective immediately, following revelations of extramarital affairs—including one with
post-image
NVDA-1.92%
  • 2
  • 1
$ZEC A terrifying 895! If you chased the price at 1000 and got trapped, can you still get out? The whale’s “guillotine” is already at your neck!

The worst thing in crypto isn’t missing out—it’s happily buying the dip, only for the market makers to clean you out!

The price is now 895. You went long at 1000 and are down $100, but think you can still breathe? The largest ZEC long whale has a liquidation price pinned at 894! If the price falls below this lifeline, cascading liquidations will send it crashing like a waterfall, leaving you no chance to get out.

Why is it falling? Just three reaso
ZEC+1.29%
  • 2
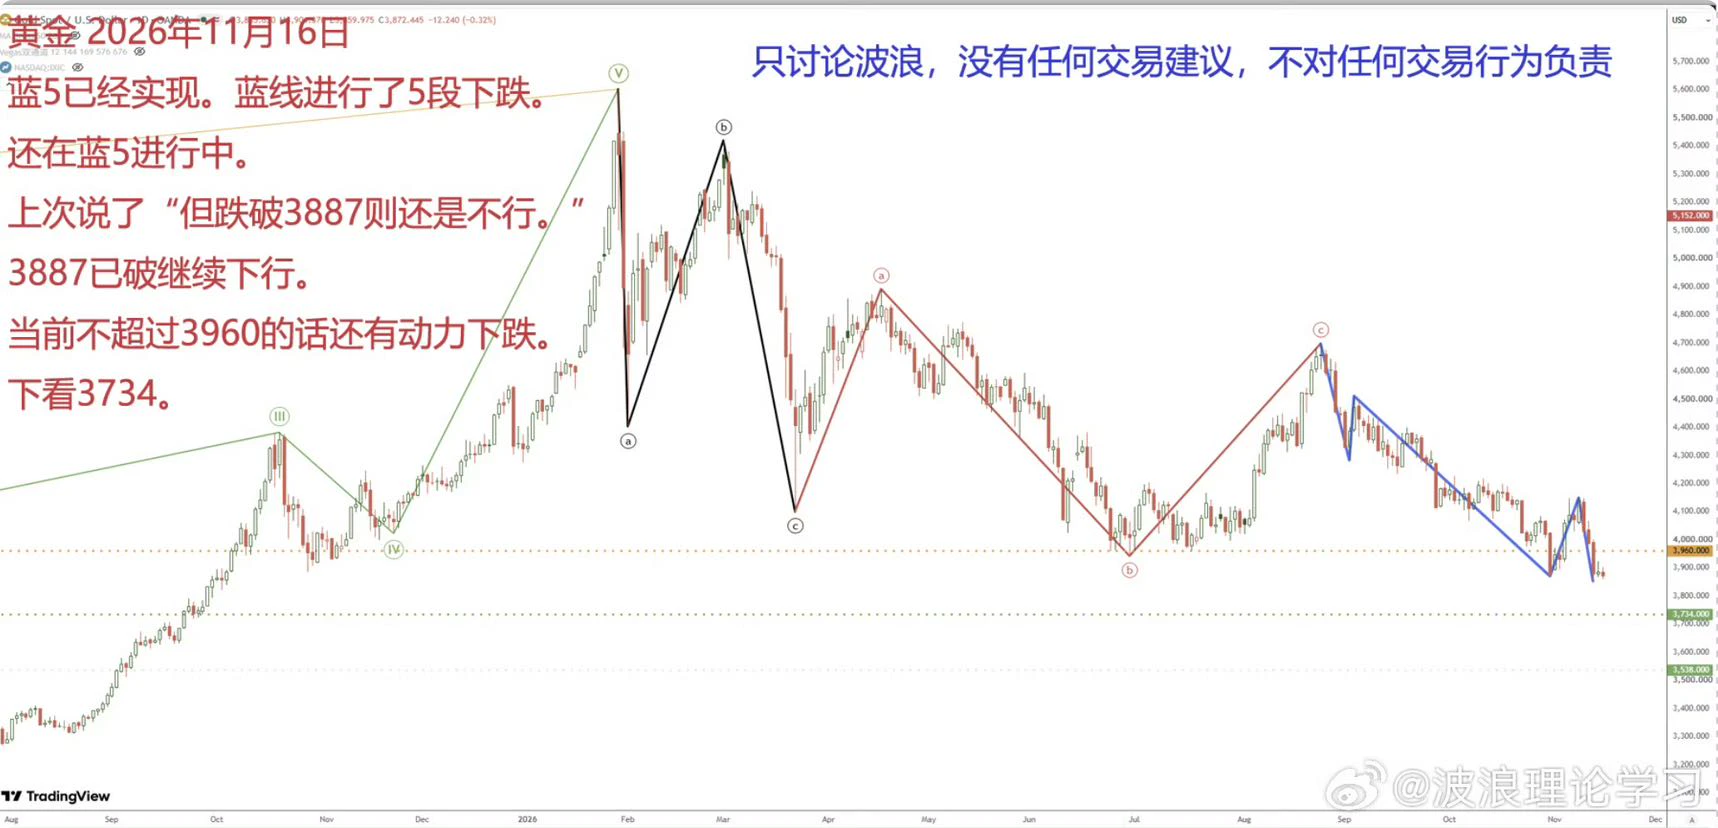
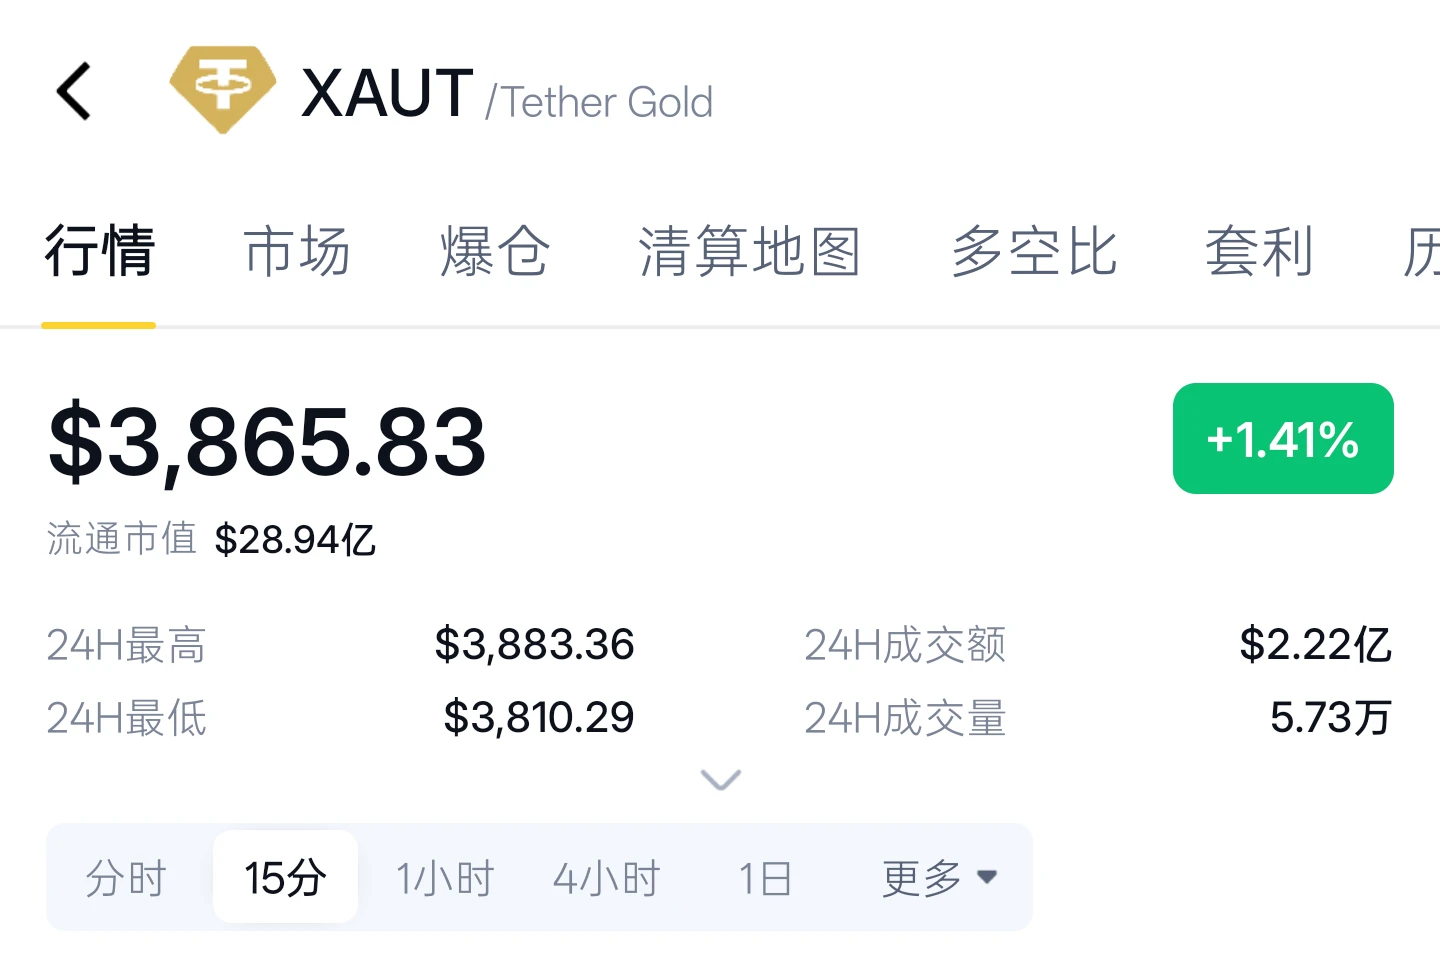
Oversold rebound after a sharp plunge! The 3850 line in the sand holds, with a rebound targeting 3920!

After gold accelerated lower late last Friday and hit a low of 3842, it found support and stabilized. During today’s Asian session, it has continued to trade in a narrow range near the lows. After retesting key support around 3850 early this morning, it rebounded from the low and is currently trading near 3887. Overall, the market is showing a weak, choppy pattern of “slowing declines and bottoming out near the lows,” with the bull-bear struggle intensifying in the lower range. The 3850 leve
post-image
GLDX-0.40%
PAXG+0.37%
XAU+0.38%
btc ETHs market updates
live-cover
LIVE1,725
Nvidia’s First Earnings Report Since Jensen Huang’s Departure! Can It Prove It Can Still Win Without Its Founder?

The most unusual thing about Nvidia’s earnings report this time is not just its revenue and profits, but the major change in leadership. After Jensen Huang stepped down as CEO, CFO Colette Kress took over as interim CEO, making this a key moment for the market to assess the continuity of the company’s management. Investors may ask: Will the product roadmap change? Will customer partnerships be affected? Can AI chip delivery plans remain on track? Will a finance chief taking over t
NVDA-1.92%
The wallet has added a privacy mode, which could easily be mistaken for the entire chain becoming invisible. What it can hide depends on the limits set by the platform itself.
At 4:26 a.m. Beijing time on the 16th, Solana wallet Solflare announced the launch of Private Mode, with the underlying protocol provided by infrastructure team Helius. The official Solana account later confirmed that balances and payments can be hidden, and that the feature is fully self-custodial. It is added to the existing wallet and uses the same address. Transfers between Private Mode users can hide the amount and
post-image
SOL-0.77%
Load More

Join 40 M users in our growing community

⚡️ Join 40 M users in the crypto craze discussion

💬 Engage with your favorite top creators

👍 See what interests you

Trending Topics

GateIPOAccessAnthropic

384.1K Views2.8K Discussing

Gate IPO Access Phase 3 features Anthropic (ANT), with USDT subscription interest starting from 100 USDT. Successful allocations will be delivered as real shares to Gate Stock Accounts. Indicative price: $70–$78/share Subscription: Nov 12–17 (UTC+8) Allocation is not guaranteed. Please manage risk accordingly.

Dr.HanOxfordUnionSpeech

154.4K Views521 Discussing

BTCBreaksKeySupportAsFearDeepens

5.4M Views36.6K Discussing

View More