




Square
Following
Hot
News
Profile
Share your thoughts
placeholder
Article
Isn’t it tiring to type out “never supported it”? Is it really that hard to just write “opposed”?
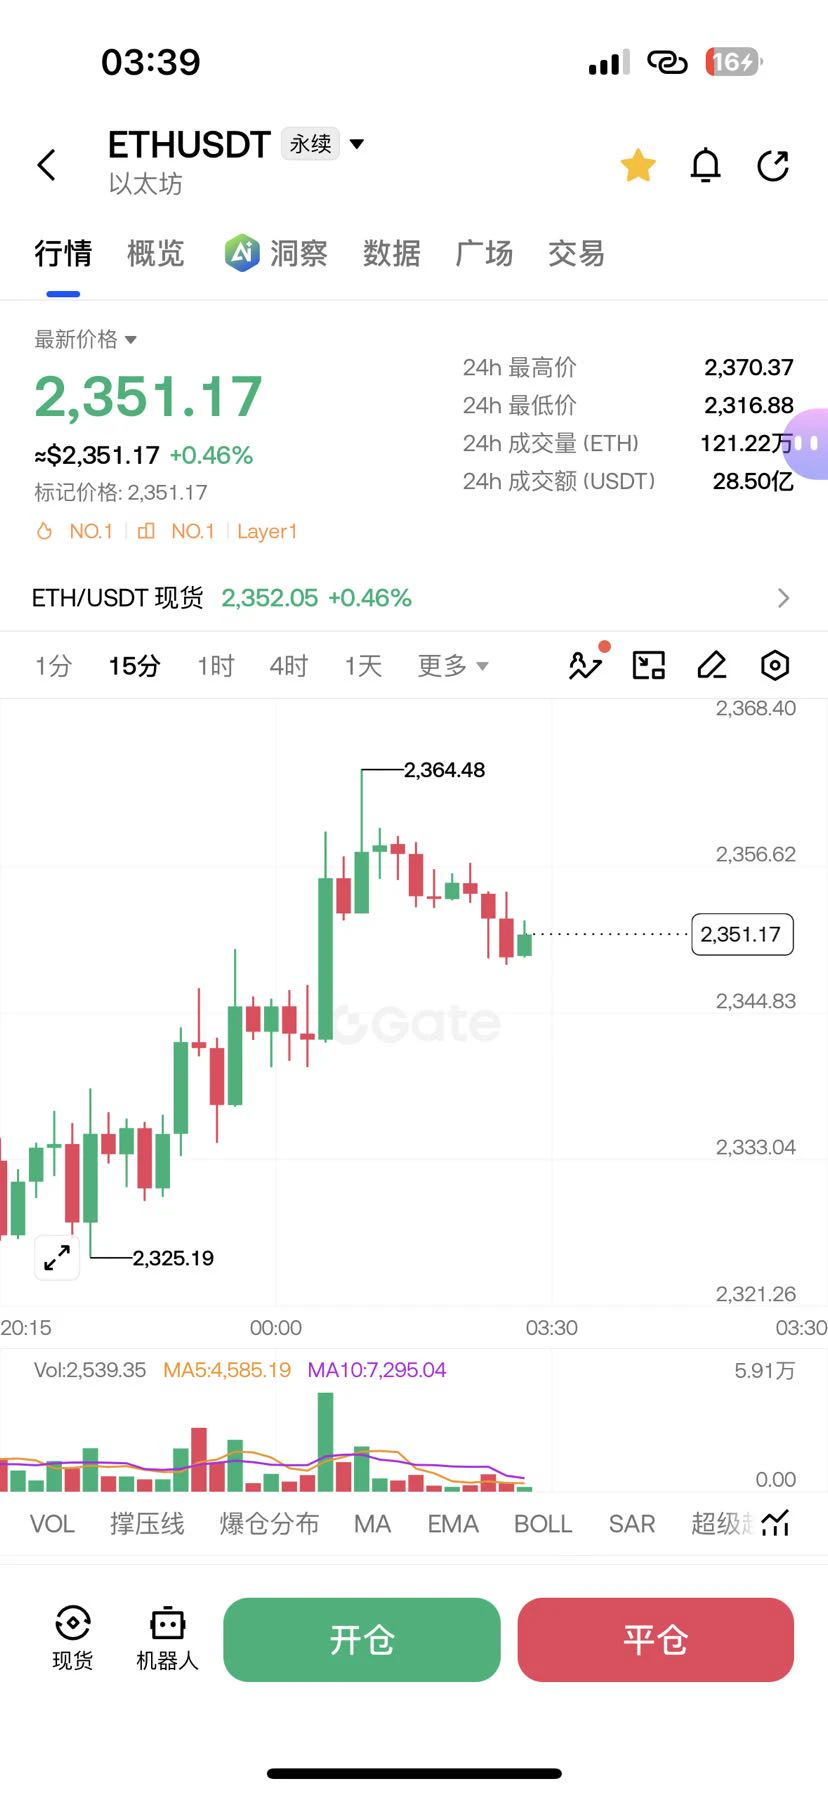
$CL So my crude oil short position just got bigger again!
Opened at 104.3, added once at 103, and now added again! Average price is around 103.2 now, guys—let’s smash it! If it breaks below 101, I’ll keep adding all the way down to 90😂😂😂😂
post-image
CL-0.93%
Trenches
STONK
S
bade
b
STONK
6GmA...UNgx
Market Cap
$.
Change
.
24h Vol
$.
Holders
.
BTC
B
bade
b
BTC
C5xp...pump
Market Cap
$.
Change
.
24h Vol
$.
Holders
.
CNPY
C
bade
b
CNPY
0xc6...ddd2
Market Cap
$.
Change
.
24h Vol
$.
Holders
.
ZIG
Z
bade
b
ZIG
0x8c...1145
Market Cap
$.
Change
.
24h Vol
$.
Holders
.
LAUNCH
L
bade
b
LAUNCH
AhBi...Qj6C
Market Cap
$.
Change
.
24h Vol
$
Holders
.
$BTC ‌ is approaching a make or break zone. Will buyers defend $79.5K or give bears more room?
Bitcoin is trading near $80.7K after another rejection around $83K. Price is still above the daily Supertrend at $79.5K, but the recent lower highs show buyers need to step up soon.
Levels to keep on your radar:
Support: $80K to $79.5K
Major support: $78.8K
Resistance: $81.85K to $82K
Next hurdle: $84.9K
Holding $79.5K could keep a recovery attempt alive. A clean reclaim of $82K would improve the picture, while a breakdown below the Supertrend could expose lower support.
BTC is at a key decision po
BTC+0.06%
TSLA-0.62%
  • 3
  • 1
I just opened a quick short trade on $KMNO
. Entry now: sell at 0.04330 or 0.04430. First target: 0.04150; second target: 0.04050; third target: 0.03950; final target: 0.03850++. Set the stop loss above 0.04750
post-image
KMNO+7.95%
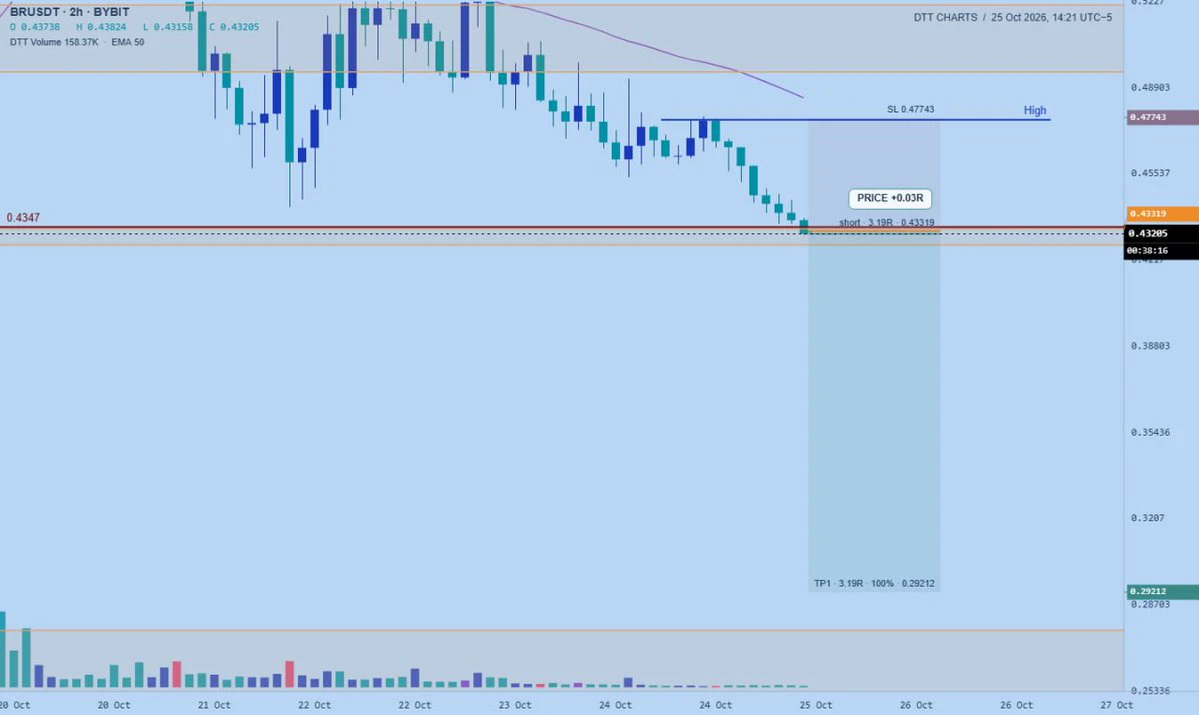
Entered a small size short on $br. Its already extended but today might be the day it breaks down
post-image
BR-1.56%
BTC MARKET CHART
live-cover
LIVE879
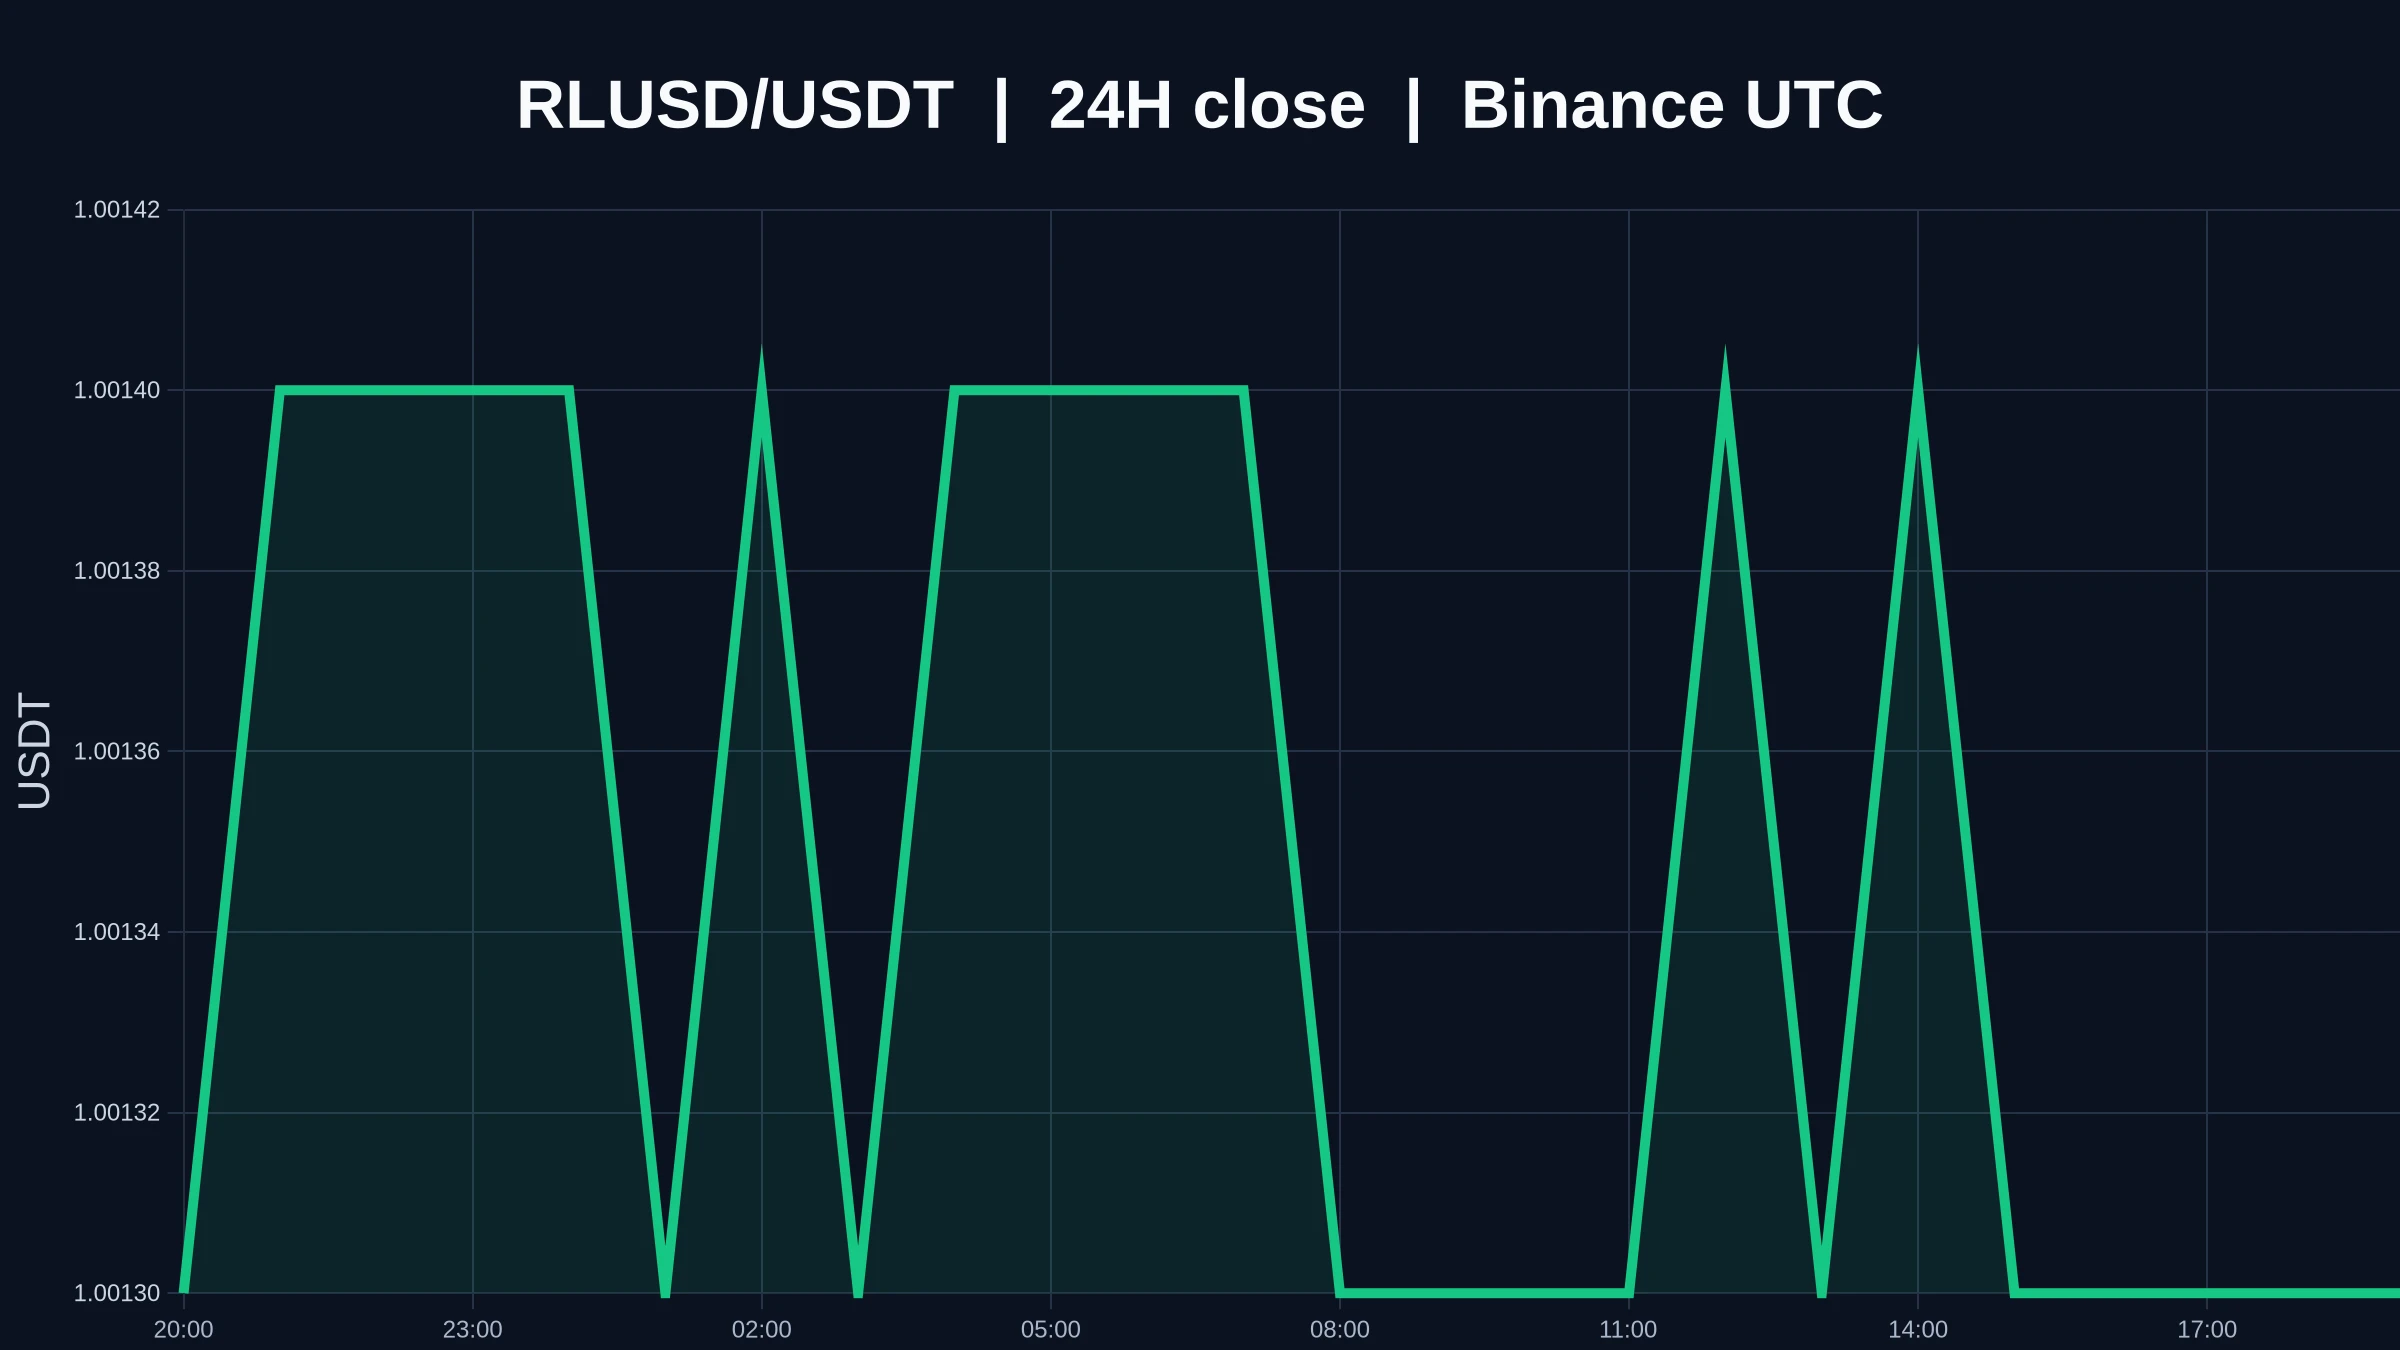
$RLUSD 24-hour +0.00%, currently at 1.0013. The 1-hour chart is weak, while the 4-hour chart is strong. Whether the two charts are telling the same story matters more than the leaderboard. Timeframe confluence is key here. The 1-hour chart reflects short-term capital flows, while the 4-hour chart reflects the broader structure. When the two timeframes point in opposite directions, it only means the market is choosing a direction; a short-term shift cannot be treated as a trend reversal. Picking whichever timeframe looks more convincing makes for a satisfying conclusion, but it is most likely t
post-image
RLUSD+0.00%
Render Network and Solana will host BEYOND THE FRAME at London's FRAMELESS on November 16, during Breakpoint 2026.
Work by 14 artists, all rendered on Render Network, will fill the immersive venue.
@rendernetwork
RENDER+1.12%
SOL+0.28%
Floki all time high hype ath go
post-image
FLOKI-1.62%
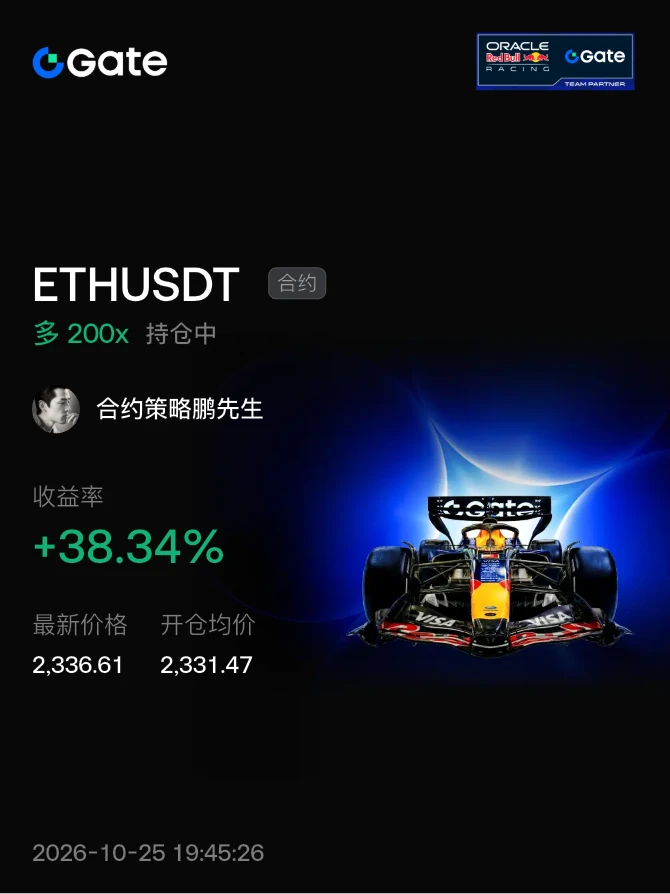
Make money, make money! Brothers, isn't Peng awesome? I told you to buy the dip—did you follow???
post-image
ContractStrategyMr.Peng
Bought the dip, guys
#晒出我的持仓收益
repost-content-media
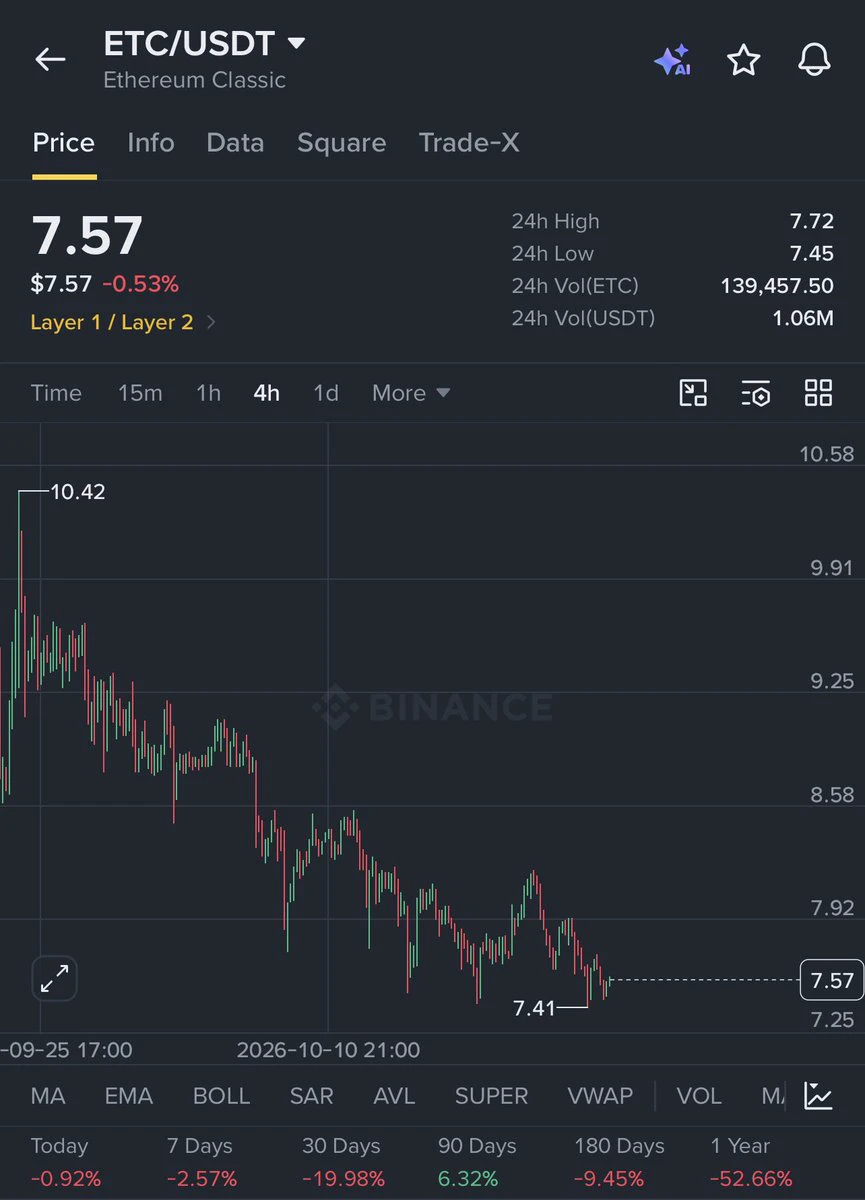
If market is right $ETC suppose pump from here.
post-image
ETC-1.08%
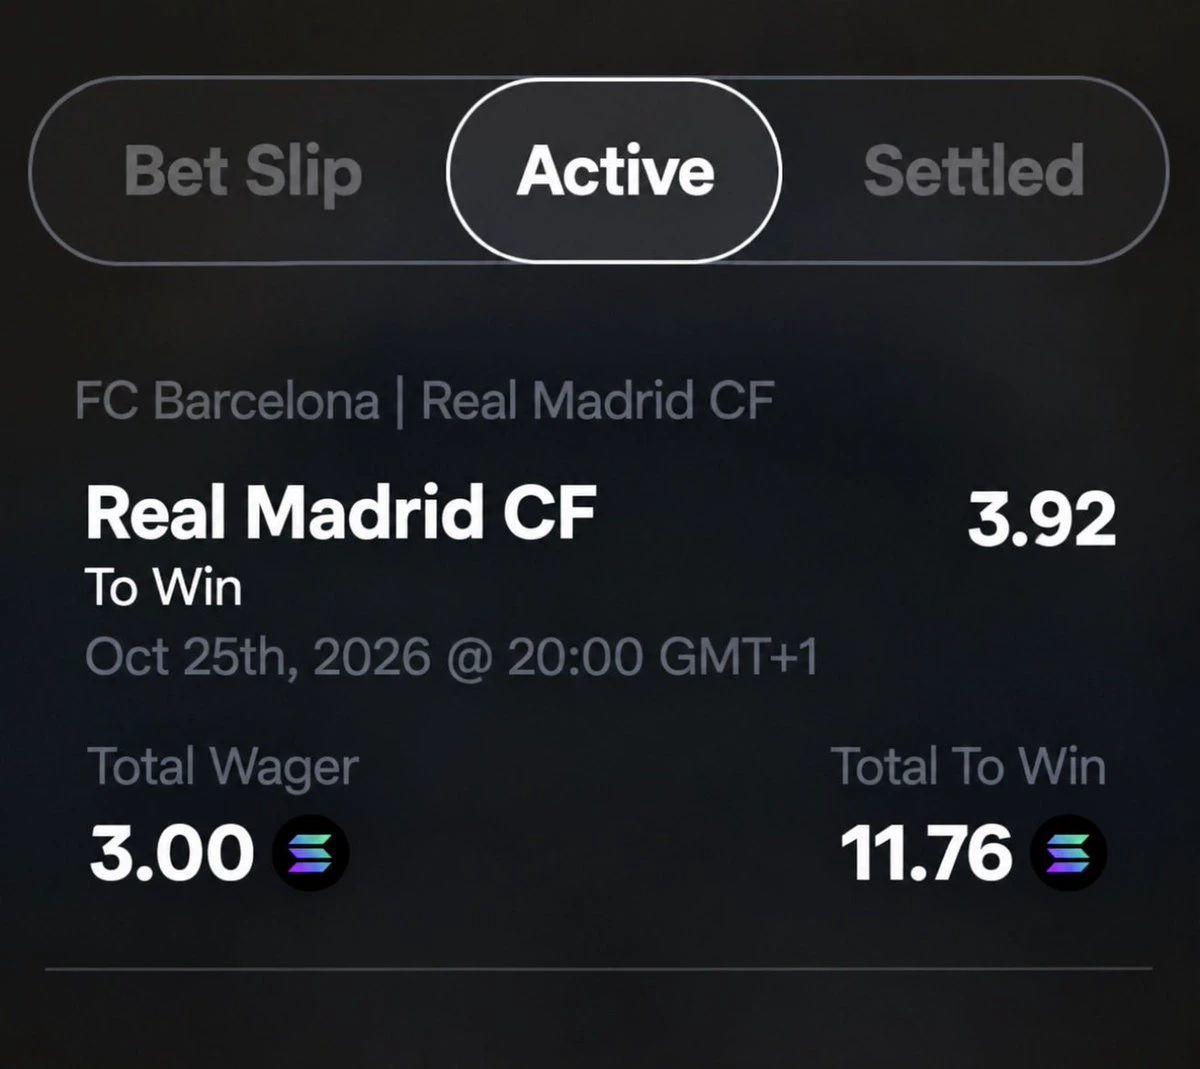
i feel like when there’s an opportunity u gotta take and i see value in the 4x odds on el clasico barça vs real
game is in 1h and i got the best odds from @DivvyBet
bonuses and much more w/ my ref:
post-image
Most of the fans Gattouz sleeps with are actually artists signed to his own company. I’m also curious how many times a month he actually has sex.
Full Analysis of the BTC/ETH Crash: Three Headwinds Converge—Why Was the Market So Vulnerable?
The market has plunged over the past two days, driven not by a single sudden headline but by the convergence of three forces in the same window: macro conditions, capital flows, and market structure.
First, the macro picture: Tensions in the Middle East have pushed oil prices higher, reigniting inflation concerns and further strengthening expectations that the Fed will keep interest rates high for longer. Risk assets have naturally become the first stop for capital exiting the market. Next, capital f
post-image
BTC-0.23%
ETH+0.28%
Crypto Trade Today
live-cover
LIVE610
$TA I’ve taken losses this round, so I can say this with confidence: 0.0608 isn’t a point to chase; it’s the starting point for recovering losses.
Yesterday’s low was 0.0498, and it’s up 14.87% over 24 hours to the current price, with 14.5M in trading volume—the volume is real, but the upper wick at 0.0620 is hard to ignore. Accumulation by funds in the 0.05–0.052 range is clear, and the rally’s pace looks like a futures bulldozer, not retail FOMO.
My plan: scale in on a pullback to 0.057–0.058, with a stop-loss at 0.053 (exit if it breaks below the previous low and the structure fails), and f
TA+22.94%
  • 1
Trading on two exchanges was a success today 🏅. Mom no longer has to worry about me being overwhelmed 🥰🥰 $nil
post-image
NIL+6.66%
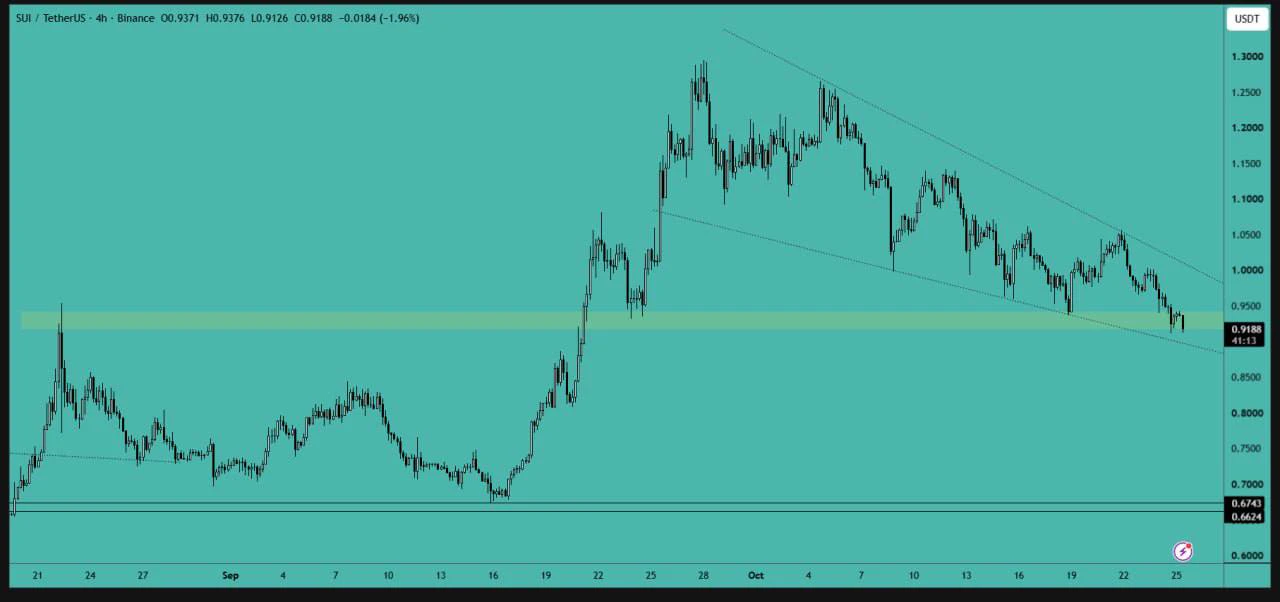
SUI analysis:
The price is currently testing a major support area, which may lead to a bounce. Additionally, there is a falling wedge pattern; a breakout from this pattern could result in a significant upward rally. Consider opening long positions, but be sure to use a tight stop-loss.
$SUI ‌#GateSquareNewCreatorProgram #ShareWeekly
post-image
SUI-1.29%
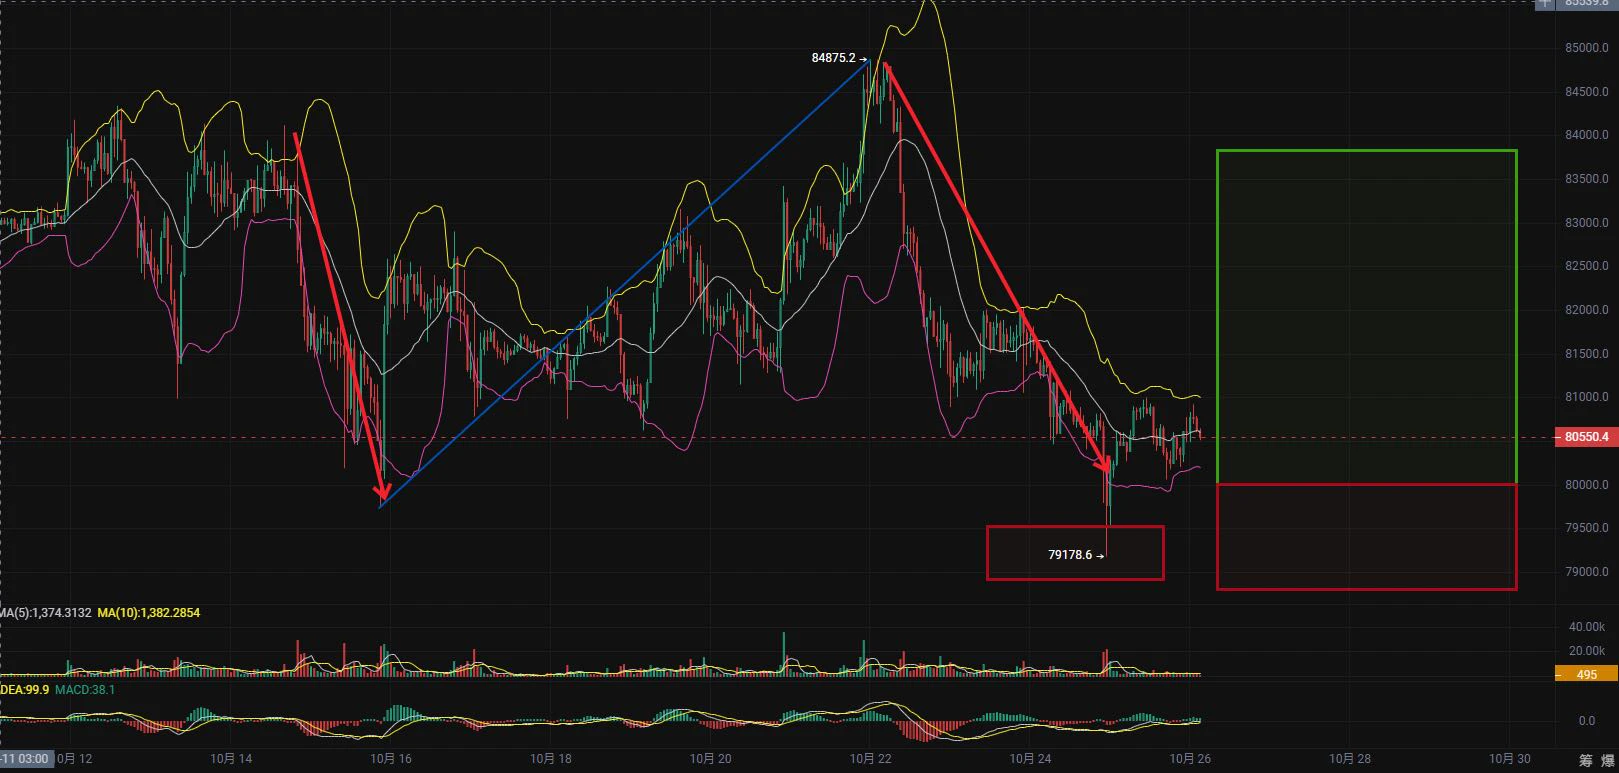
10.26 BTC Public Trading Outlook
Long Trade Setup$BTC
  Entry range: 795-802
  Stop-loss: around 788 (depending on the entry price and position size)
Take-profit targets
  First target: around 810 (middle Bollinger Band support turns into resistance)
  Second target: around 820 (upper Bollinger Band resistance)
Third target: 828 (in view if the second target is broken)
Fourth target: 838 (in view if an evening trend develops)
Trading factors: Brent crude oil remains at elevated levels, pushing up inflation expectations. This, in turn, will constrain the Fed’s room to e
post-image
BTC+0.07%
ETH+0.31%
ZEC+1.26%
$CAP Up 37% in a day to 0.1117, then dumped back to 0.1079. I looked back at the altcoin rally patterns after the previous three halvings—every cycle, between the fifth and seventh month after the halving, we saw this “violent shakeout first, then a major rally” pattern. The current 179.7M trading volume at a price just above $0.10 shows a price-volume profile close to that of small-cap coins before they took off in Q4 2020, but the market cap base is a full order of magnitude lower than at the same point in the last cycle.
Bull case: The 24h low was 0.0773 and the high was 0.1117, a 44% range
CAP+37.44%
Load More

Join 40 M users in our growing community

⚡️ Join 40 M users in the crypto craze discussion

💬 Engage with your favorite top creators

👍 See what interests you

Trending Topics

USEarningsSeason

102.33k Views3.53k Discussing

The U.S. Q3 earnings season is in full swing, with major tech companies including Tesla and Meta reporting results. Market focus is shifting beyond revenue and profit toward AI spending, capital expenditure, margins and forward guidance. Which company’s earnings are you watching most closely?

GateWCTCS9GlobalTradingCompetition

729.68k Views8.1k Discussing

USConsumerSentimentNearRecordLow

12.61k Views304 Discussing

View More