Square
Following
Hot
News
Profile
Share your thoughts
placeholder
Article
CPI data - tonight. BTC / ETH Market Updates
live-cover
LIVE3,094
  • 1
$ALGO ALGO/USD – Year-Long Base Complete, +103% Target
After over a year of declining price action, ALGO/USD has been forming a base near multi-year lows. A rising support trendline has been developing since mid-2026, and price is now breaking upward from that structure.
A continuation of the current move targets the ~0.2450 resistance zone, representing a gain of approximately 103% from current levels.
post-image
ALGO-3.09%
Today at 13:54, I wrote $TRUTH , judging it couldn't rise
Eight hours later, 0.02192 → 0.02264
Up 3.28% and still at a high level—I was half wrong
I was wrong to focus only on the drop in open interest without calculating how much of the trading volume it accounted for
Open interest notional: $1.26 million; daily trading volume: $13.83 million (0.09x)
Leverage hasn't built up; what supported it was intraday turnover
So it couldn't be pushed down—I admit this and correct my call
But it hasn't broken out either: 18:00 high of 0.023965
It surged to 0.02389 at 21:00 before being pushed back down,
post-image
TRUTH+35.42%
The hourly chart is still moving within an ascending channel, and the channel’s lower-bound support has now coincided with the support at the 820-day moving average, creating double support.
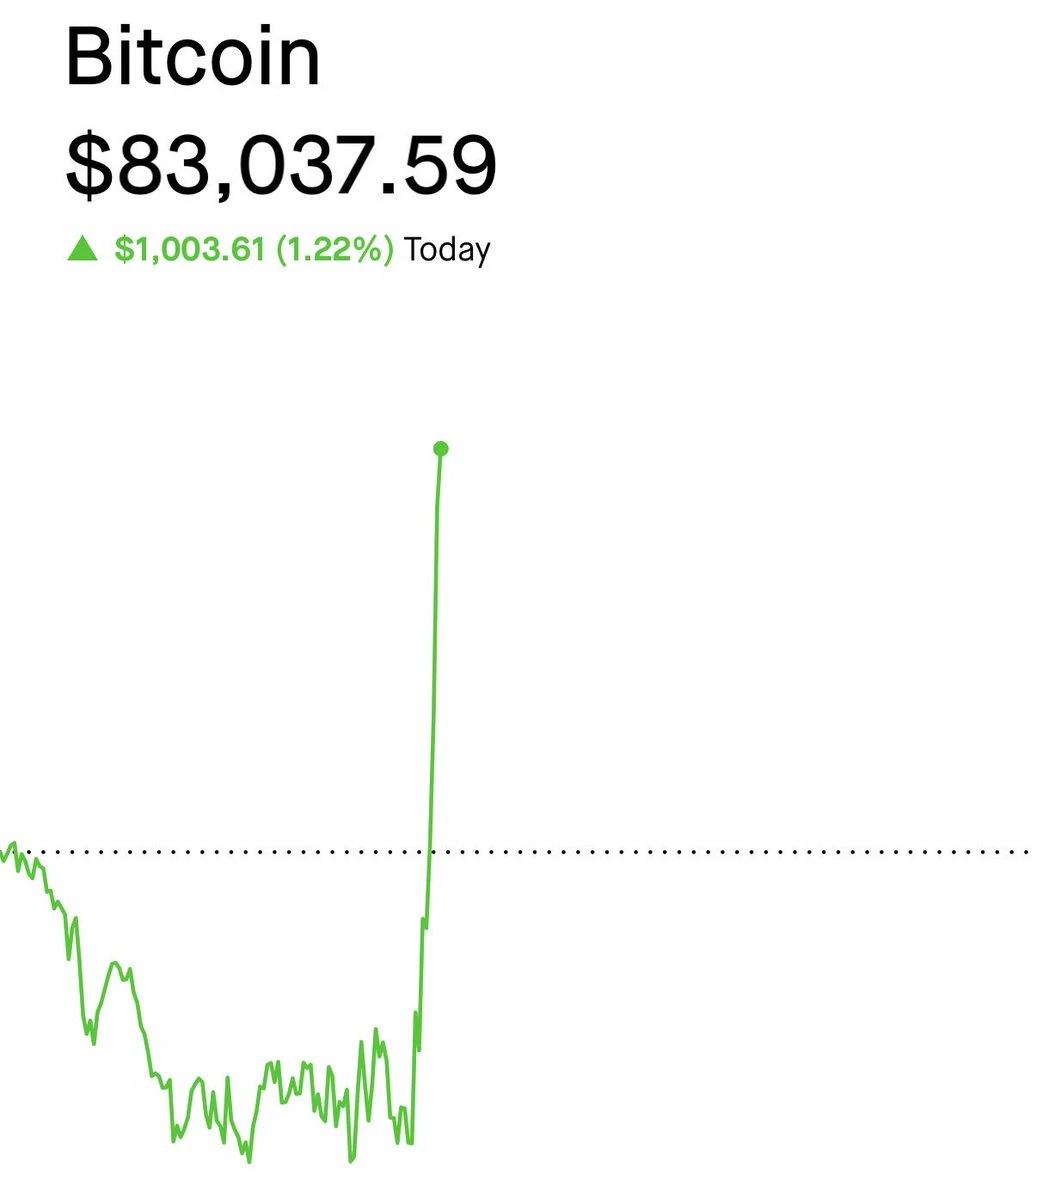
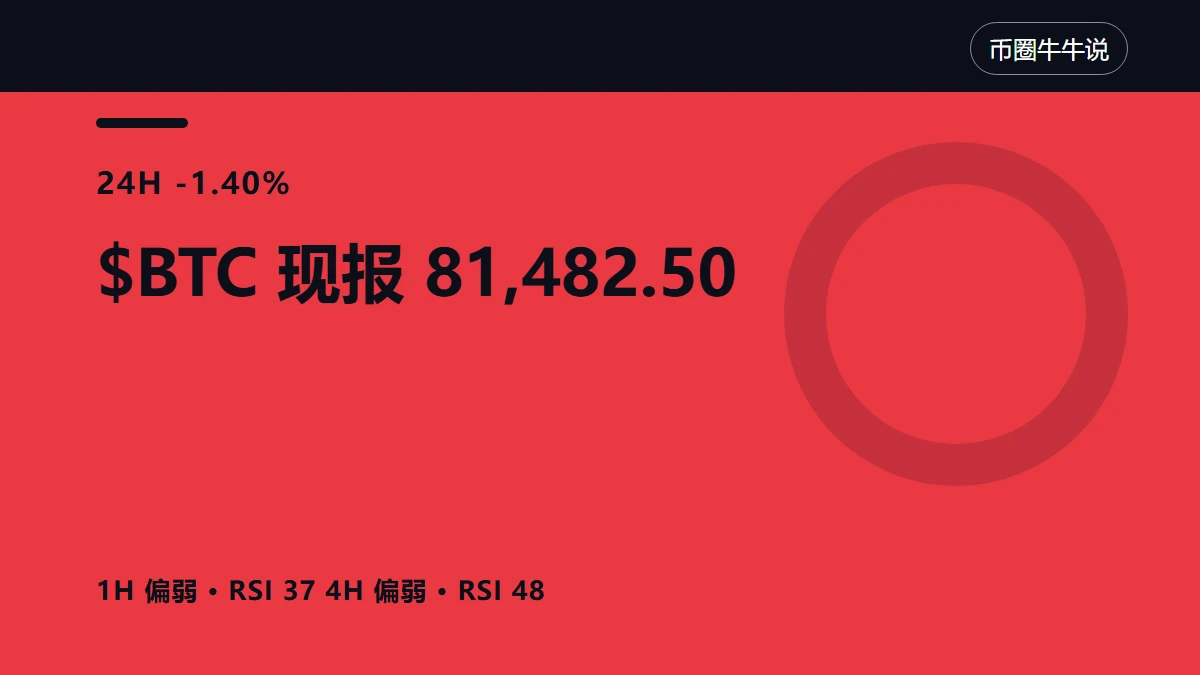
If the double support holds firmly, watch the resistance in the FVG area as the subsequent rebound target. If the rebound is weak, wait for an effective break below the 820-day support before chasing shorts. The current position is neither here nor there, but beware of a false breakdown$BTC $ETH #美国9月CPI超预期
BTC-2.03%
ETH-3.91%
$TSM is approaching a potential breakdown area, where a loss of upward momentum could create an opportunity for a move lower.
Trading Ideas Short $TSM
Entry: 438.00 - 443.00
SL: 487.50
TP1: 430.00
TP2: 420.00
TP3: 412.00
TSM is down 1.16% today at $439.99, and the chart is flashing clear bearish signals. The price is trading below all three key moving averages: MA5 at $443.74, MA10 at $450.78, and MA30 at $458.87. That is a textbook bearish alignment, with the shorter-term MAs stacked below the longer-term ones. The MACD histogram is deeply negative at -4.37, with DIF at -2.31 below DEA at 2.
post-image
TSM-2.08%
🚨🚨🚨🚨
September 2026 US CPI. Hotter than expected.
CPI MoM: 0.6% (in line with consensus, up from 0.4%)
CPI YoY: 3.7% (above 3.6% consensus and 3.4% prior)
Core CPI MoM: 0.3% (above 0.2% consensus, matching prior)
Core CPI YoY: 2.6% (above 2.5% consensus and 2.4% prior)
Something just broke.
US CPI rose to 3.72% in September, up from 3.35% the month before.
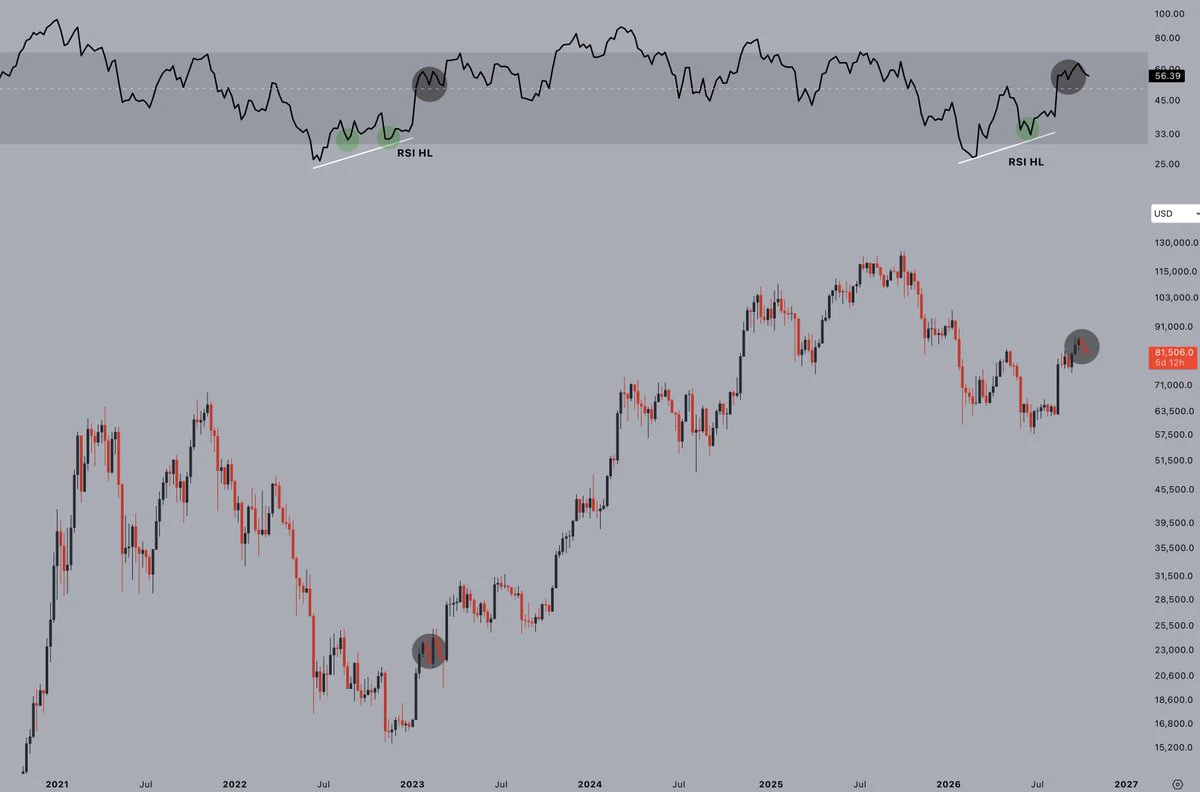
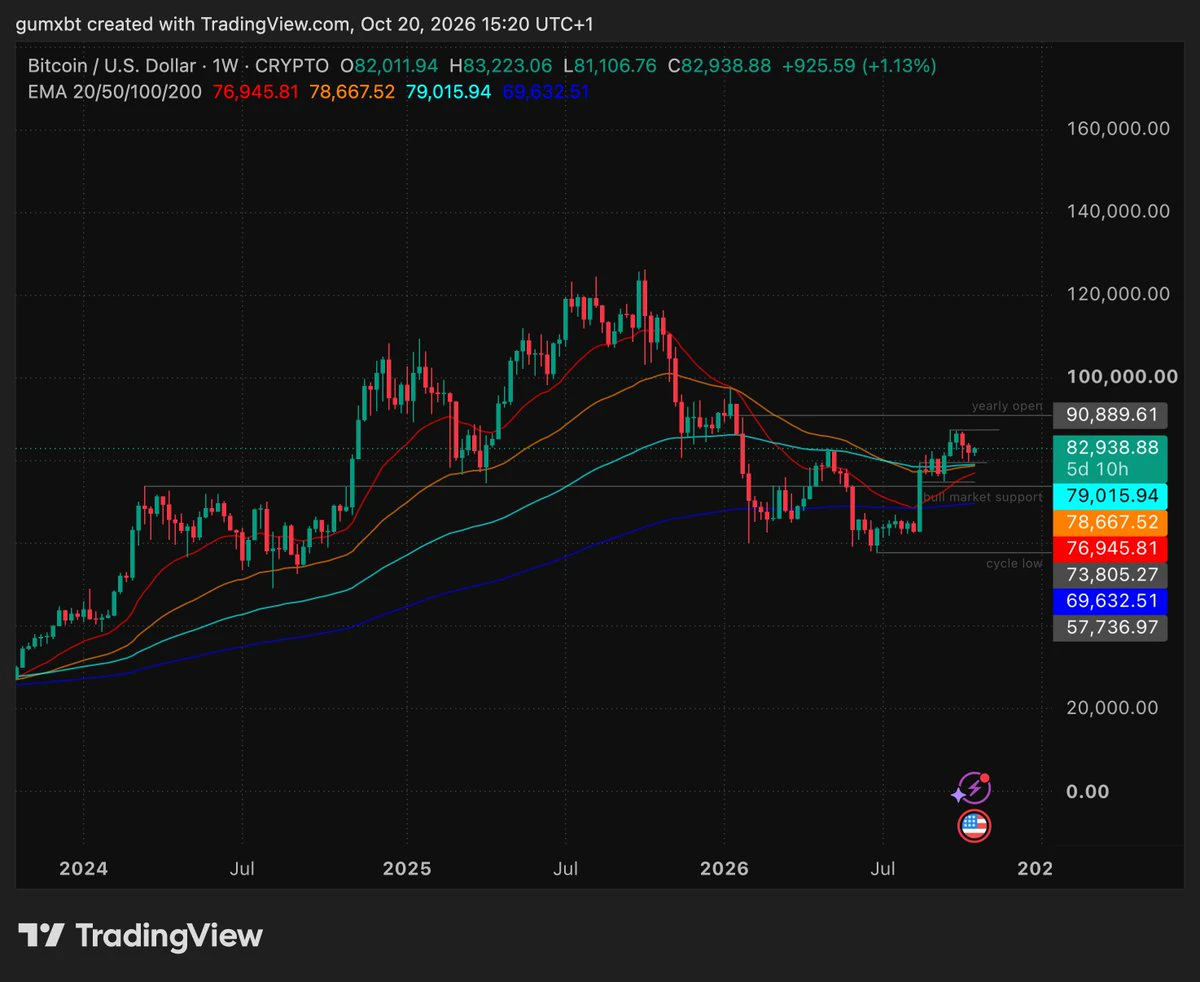
After a sharp sell-off, both tokens formed a V-shaped reversal, surging quickly from the panic low before facing resistance and retreating after touching the upper Bollinger Band.
Many people see a V-shaped rebound and assume the one-way trend has restarted. It is important to understand that V-shaped recoveries after sharp declines are mostly driven by emotional capital and do not mean a trend reversal. After a V-shaped bottom, a direct one-way rise is rare; the market usually enters a volatile shakeout.
This consolidation phase is a window for adjusting trapped positions. Strictly manage ris
post-image
BTC-2.03%
ETH-3.91%
Here’s a little tip: use AVE to monitor bundled addresses.
If the bundled addresses account for only 1% at first and suddenly surge, the token will shoot up.
If the bundled addresses suddenly drop sharply, the token will quickly fall.
This is not empty talk; it has significant reference value. Especially when the token’s internal-market progress reaches the 65–75% range, if these bundled addresses are still present, there will be a sudden pump and launch.
Usually, entering during the 65–75% internal-market progress and holding until launch can yield at least 50%–100% returns.
But this is not a
You open Gate, see $WAL up 40.89%, and your stomach drops a little. “Did I miss it?”
I know that feeling. So before reacting, I asked one simple question: why is it moving?
Right now, I don’t have a confirmed answer. About $3.96M worth was traded in the last 24 hours, and the price is sitting close to its daily high.
That tells me people are interested. It doesn’t tell me why.
So my next steps are simple: read the official news, check if new coins are about to be released into the market, and see if the move is backed by real activity.
If I can’t find a clear reason, I’ll say so openly.
When
post-image
WAL+32.88%
WAL+34.34%
$CATE already made a run to $120M once
I'm very bullish on this one and I believe it's preparing for another ATH
Way too early to get comfortable. Just sit back, relax and enjoy the ride🚀
post-image
CATE+7.41%
$S This wick makes my scalp tingle—didn't exit at 0.0739, and it's at 0.0556 now.
Let's review this trade. The day before yesterday, I saw it break out on heavy volume and chased in around 0.062, thinking the trend had arrived. It surged to 0.0739 yesterday, but I didn't exit—I got greedy. Today it was dumped straight to 0.0520, down over 17% in 24 hours, with a trading volume of 217 million, clearly a stampede among profit-takers.
Reasons to be bullish: First, 0.052 is a previous high-volume trading zone with support; second, trading volume remains above 200 million, so liquidity hasn't dried
They keep calling it a “rate-hike bull market,” while the market is voting with its feet through price action.
post-image
🧊 ICE TRADER LIVE | What's Happening in the Crypto Market Today? 🚀📊 | BTC & Altcoins Update 🔥
live-cover
LIVE2,822
South Korean stocks are experiencing one of their most critical days. After wiping out $108 billion in market value with a 3.2% drop yesterday, the KOSPI index plunged below the 6,000 level this morning, October 13, 2026, falling over 6% and triggering its first sell-side trading curb in two months.
This is not a simple panic sell-off, but a collision of three macro factors at once. And precisely for that reason, when examined academically, it presents a clear opportunity: I am accumulating on dips in stages.
Let's look at the real data. Samsung Electronics traded down to 237,000 won intraday
Sep 23 post - yes, we got higher CPI as indicated.
post-image
#ASMLTSMCQ3EarningsSoo and TSMC Q3 Earnings Soon. The Semiconductor Market Is Approaching a Major Moment.
The global technology industry is preparing for another important earnings season as ASML and TSMC move into focus. These two companies occupy critical positions in the semiconductor supply chain, and their upcoming third quarter earnings could offer valuable insights into the direction of the global chip industry.
ASML is a key supplier of advanced lithography equipment used to manufacture sophisticated semiconductor chips. Its business performance can help investors understand how chipma
TSM-2.08%
ASML+0.17%
BTC-1.99%
  • 1
$APA
Looks like it's breaking out of a high time frame bottoming structure.
post-image
APA+0.16%
Load More

Join 40 M users in our growing community

⚡️ Join 40 M users in the crypto craze discussion

💬 Engage with your favorite top creators

👍 See what interests you

Trending Topics

USSeptemberCPITopsEstimates

35.42k Views2.22k Discussing

US September CPI rose 3.7% YoY, above the 3.6% estimate; core CPI rose 2.6%, also above the 2.5% estimate. With inflation topping forecasts across the board, how will rate hike expectations shift? How will BTC react? Share your view.

DrLinHanSpeaksAtOxfordUnion

134.95k Views1.85k Discussing

GateWCTCS9GlobalTradingCompetition

37.17k Views6.06k Discussing

View More