






Square
Following
Hot
News
Notifications
Profile
Share your thoughts
placeholder
Article
$ETH At this point, keep buying and drinking! Sell after 500 days!
post-image
ETH-1.26%
Recently, I’ve seen a lot of people saying they’re rushing to buy the dip because Ahr999 has fallen to 0.2338, so let’s use this as an opportunity to break down the indicator. Ahr999 is essentially the ratio between price and long-term valuation. In crypto circles, it’s called a buy-the-dip indicator: below 0.45 is considered the buy-the-dip zone, and 0.2338 is already an extreme reading—the lowest it got during the March 2020 COVID crash was only 0.31. So what happened historically after it fell to these levels? Here are a few instances that stand out to me:
January 2015: the reading fell to
post-image
200
200Fun Time
Gate.Fun
MC:$0.1Holders:1
0%
BTC-0.67%
Trenches
FIONA
F
bade
b
FIONA
B34n...pump
Market Cap
$.
Change
.
24h Vol
$.
Holders
.
PIEVERSE
P
bade
b
PIEVERSE
0x0e...25a9
Market Cap
$.
Change
.
24h Vol
$.
Holders
.
mihao
m
bade
b
mihao
4Cxj...pump
Market Cap
$.
Change
.
24h Vol
$.
Holders
.
CLAUDIA
C
bade
b
CLAUDIA
2j5S...W2ZM
Market Cap
$.
Change
.
24h Vol
$.
Holders
.
IDOL
I
bade
b
IDOL
0x3b...ab07
Market Cap
$.
Change
.
24h Vol
$.
Holders
.
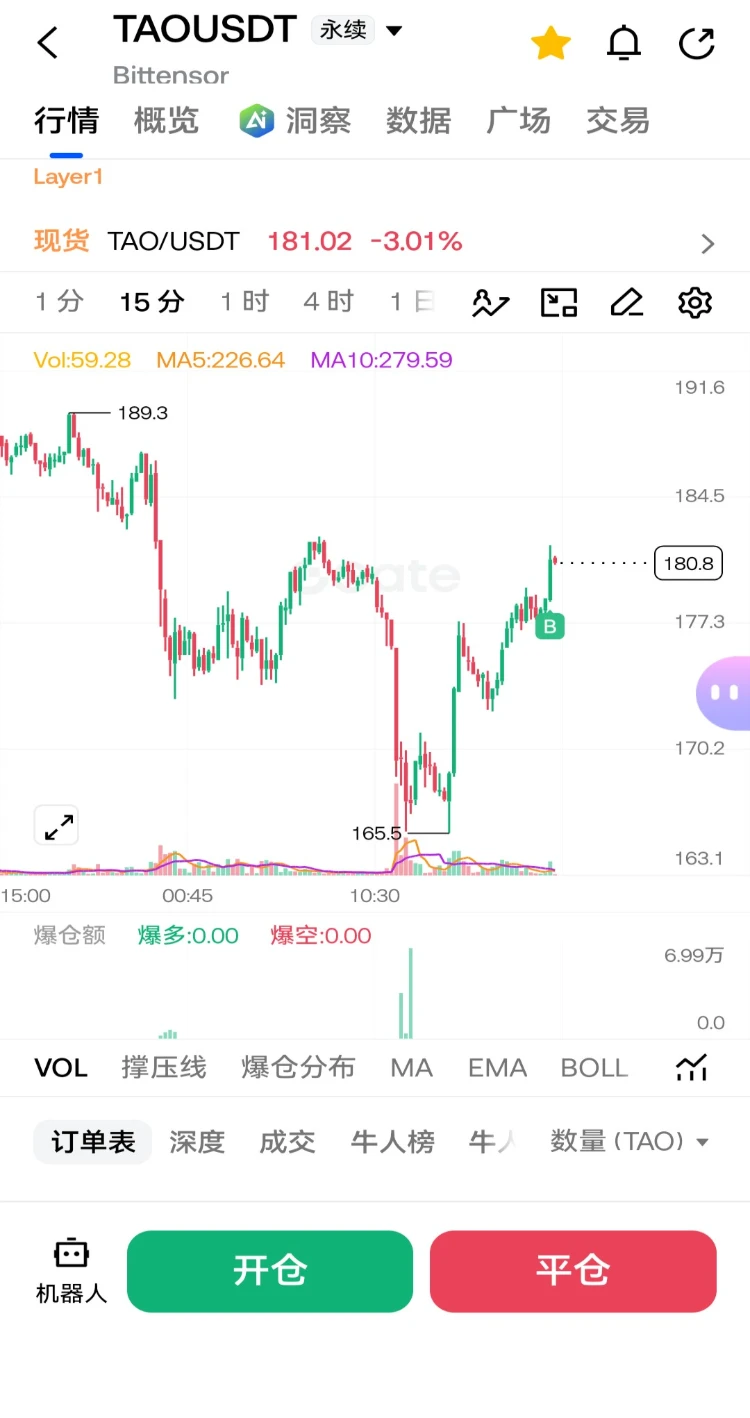
$TAO Long positions have been entered, with a reference take-profit target price of 187.5.#BTC跌破6万美元关口 #Gate年度荣耀盛典 #作手分析
post-image
TAO+0.48%
  • 2
afternoon updates
live-cover
LIVE2,542
SOL-0.77%
BTC-0.67%
ETH-1.26%
USDC+0.01%
XRP-1.15%
$PIEVERSE ‌🟢LONG · 1h · 🟢
R:R 1:1.8 ·

Entry
2,914
Stop
2,803 −3,81%

Take 1 +6,73%
3,1102
Take 2 +24,77%
3,6357
Take 3 +28,66%
3,7491

DYOR 🤔
PROFITS TO EVERYONE 💲💪💲🤝
PIEVERSE+0.58%
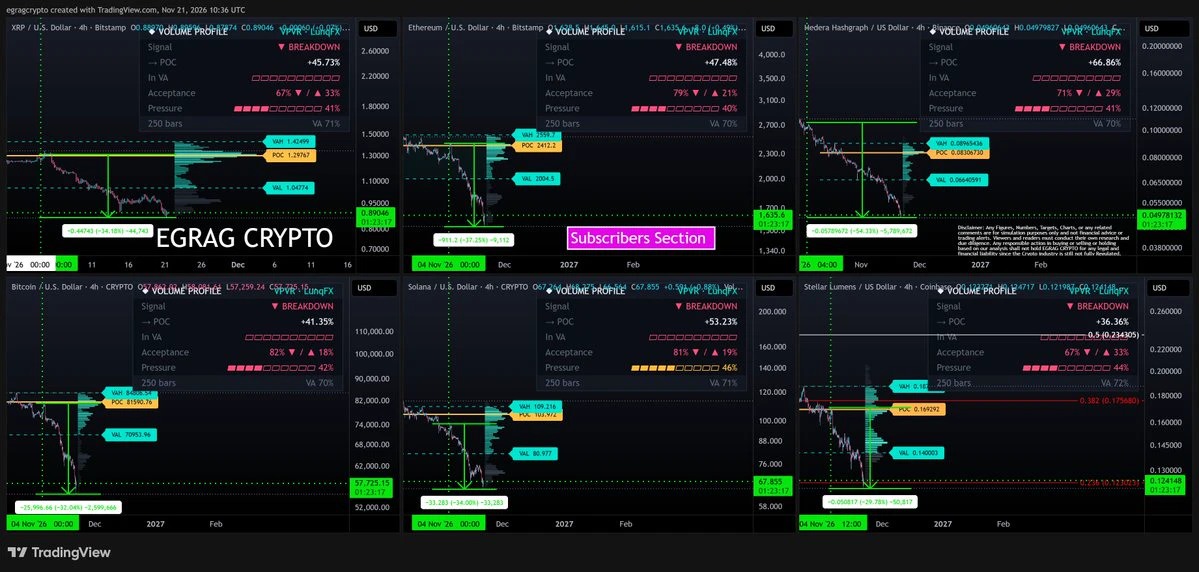
#CRYPTO 6⃣ COINS 1⃣ MASSIVE CAPITULATION!🩸:
Since November 4, the market has been BLEEDING!
FROM THE LEAST TO THE BIGGEST DROP:
🥇 #XLM: -29.78%
🥈 #BTC: -32.04%
🥉 #SOL: -34.00%
🔹 #XRP: -34.18%
🔹 #ETH: -37.25%
💀 #HBAR: -54.33%
AVERAGE DROP: -36.93%!
NOW, LOOK AT THE SIMILARITIES! 👀
👉 ALL 6 showing BREAKDOWN signals!
👉 ALL trading BELOW their Volume Profile POC!
👉 ALL experiencing synchronized selling pressure!
👉 HBAR is the WEAKEST, while XLM shows the strongest relative resilience!
MY STANCE?
▫️This looks like MARKET-WIDE DELEVERAGING and potential CAPITULATION!
▫️But remember, CA
post-image
XLM-0.64%
BTC-0.67%
SOL-0.77%
XRP-1.15%
ETH-1.26%
Starting over again with 100u; failure is a test from above for me
post-image
SOME PEOPLE WILL MAKE MONEY OFF GTA 6 WITHOUT PLAYING A SINGLE MINUTE.
They're not gamers.
They don't show their faces.
They don't know how to edit.
They hand a free repo to Claude Code and let it do the work.
Here's the whole process:
→ copy the repo link
→ paste it into Claude Code
→ pick a stream
→ hit enter
Claude installs everything on its own.
Then it turns GTA 6 streams into vertical clips, ready to post.
It doesn't even wait for the stream to end.
One skill clips finished streams.
The other clips while they're still live.
Right now millions of people are searching for GTA 6 clips at th
post-image
NVIDIA Interim CEO Colette Kress Faces a “Glass Cliff” as She Must Deal With Jensen Huang’s Legacy
live-cover
LIVE1,933
BTC-0.67%
ETH-1.26%
SOL-0.77%
USDC+0.01%
XRP-1.15%
🚨 $2.55 BILLION WIPED OUT IN LIQUIDATIONS
$2.27B CAME FROM LONGS.
IN-6.81%
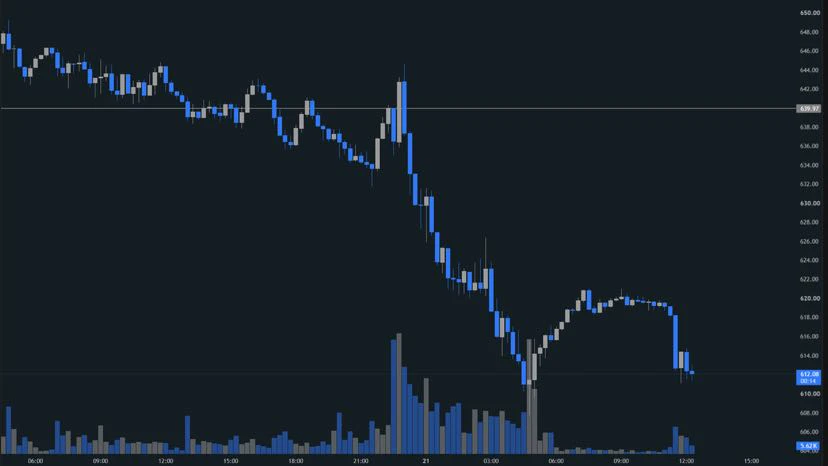
$QQQ This selloff has been a bit more severe than I expected

The Nasdaq 100 continued to plunge on heavy volume last night, with the price touching a low of 607.76. It also decisively broke below its early-November low. The index is down more than 10% for the week, bringing it close to—or even into—technical bear market territory.

Another pretty alarming statistic: more than 70% of Nasdaq 100 constituents are already down over 20% from their historical highs!

This means the selloff is spreading from a handful of AI-heavyweights to the broader tech sector.

Previously, the market was willing
post-image
QQQ+0.01%
  • 1
  • 2
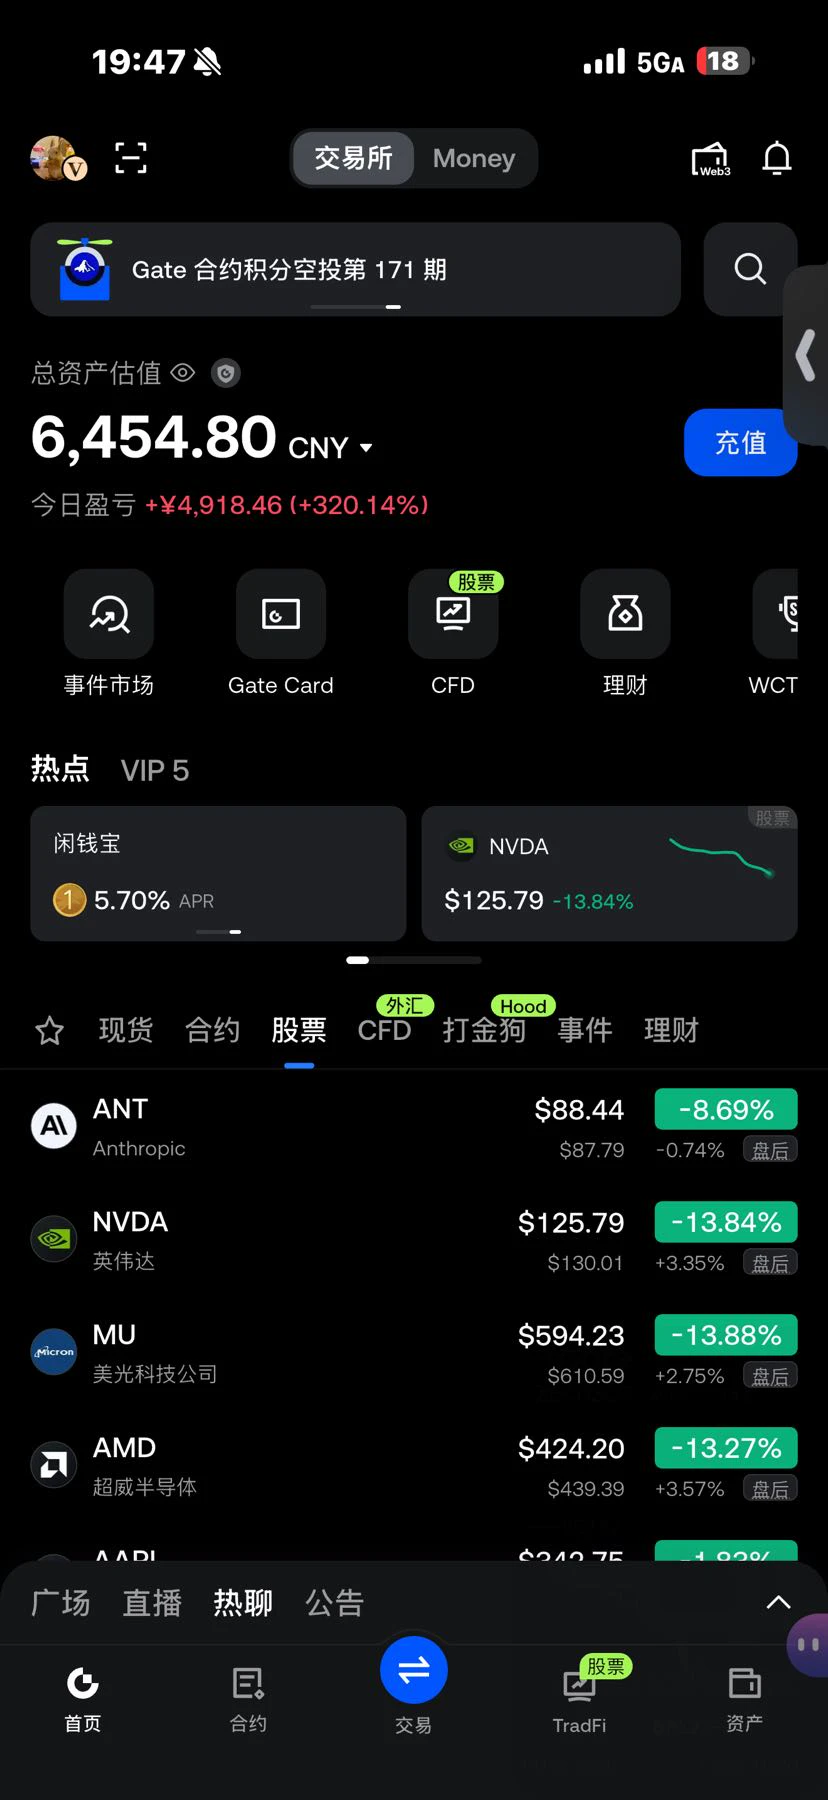
#英伟达单日重挫近14%
My most important criteria would be the returns generated from artificial intelligence investments and free cash flow.

Revenue growth and ambitious forecasts are impressive, but they do not necessarily translate into sustainable profits.

AI companies are spending billions of dollars on chips, data centers, and infrastructure. The real question is whether these investments will generate enough cash flow to justify their valuations.

NVIDIA remains a key player in the AI ​​ecosystem, but its recent 14% decline shows that even strong fundamentals cannot shield a stock from shifti
post-image
NVDA-13.84%
MU-13.88%
AMD-13.27%
ANT-8.68%
AAPL-1.83%
  • 9
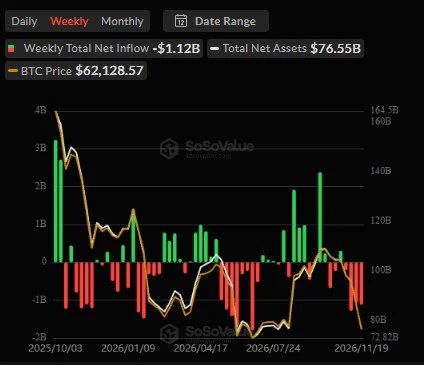
Bitcoin ETFs Face Four Consecutive Weeks of Outflows

U.S. spot Bitcoin ETFs have recorded four straight weeks of net outflows, with approximately $1.25 billion withdrawn during the latest week.

This continued outflow highlights weakening demand for Bitcoin ETF exposure and adds pressure to the market's short-term sentiment.

However, ETF flows can change quickly. The coming weeks will be important to see whether institutional demand returns or selling pressure continues.

ETF flows remain an important indicator to watch when assessing Bitcoin market sentiment.

DYOR. NFA.

#BTCBreaksBelow60K
post-image
BTC-5.94%
  • 1
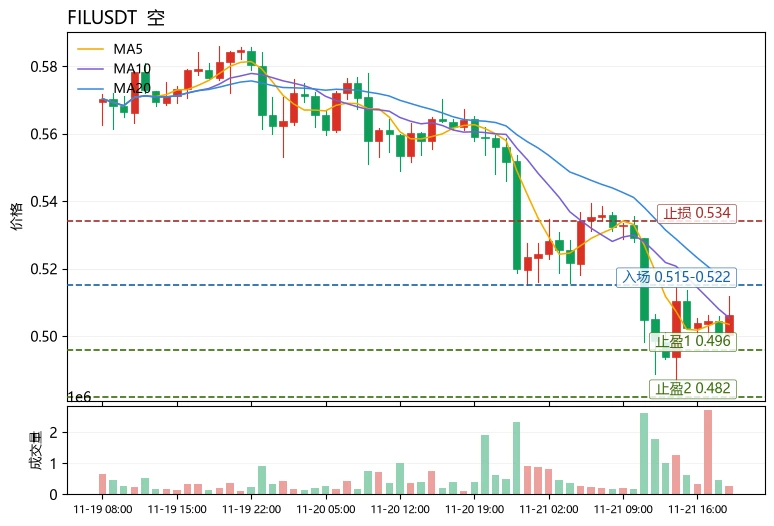
$FIL Conclusion first: Short-term outlook is bearish; a rebound is an opportunity to reduce positions, not a window to chase longs. The current price is 0.506, and MA5 at 0.50348 remains below MA20 at 0.517385; the bearish moving-average alignment remains intact. The MACD histogram stays negative at -0.0001323, while RSI at 38.3 is nearing the weak zone but is not yet oversold, leaving room to fall further. The funding picture warrants more caution: the price is down nearly 10% in 24h, yet the funding rate is +0.0034%, indicating that longs are still paying to hold positions while shorts can
post-image
FIL-2.00%
I just woke up, glanced at the chart, and nearly thought my eyes were playing tricks on me😳

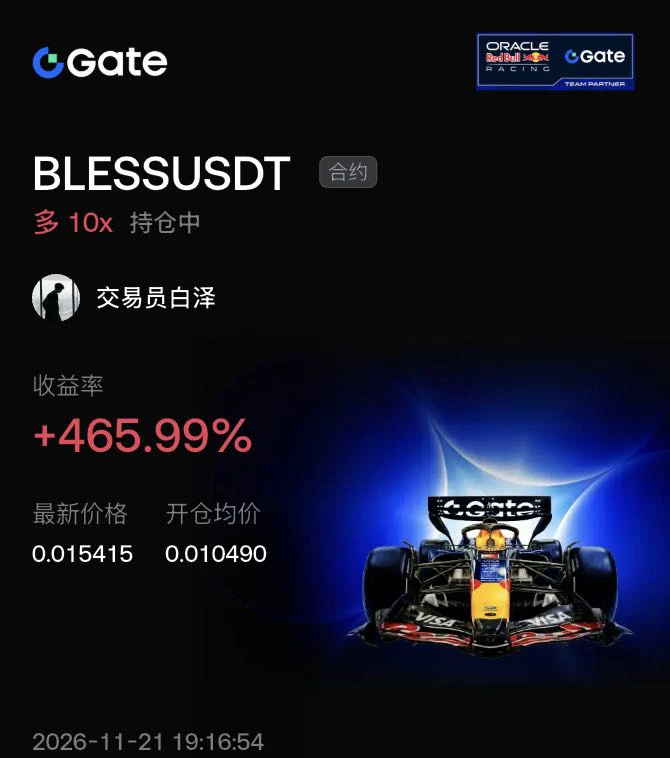
I bought the bottom at 0.010490, and now it’s surged to 0.015415. My heart is racing even harder than the market. $BLESS This run is riding the tailwind of AI computing power; people in the group chat have been talking about it every day lately.

A few days ago, the chart was deep in the red. Then it suddenly ripped through several hourly candles in a row, and I nearly got shaken out. The logic is simple: it stopped falling, someone was quietly scooping it up, so I hopped on too.

It looks great now,
post-image
BLESS-2.03%
BTC-0.65%
ETH-1.23%
🚨 Bitcoin emergency stream: the recap
Bitcoin traded down to $55K, a potential sweep of the July low, then bounced to $57,800 during the stream.
The levels from the session:
• $60K: a weekly close back above it would be a good signal for a relief rally
• $49K to $48K: the acceptance line into the range below
• $44K, then $27K: the next points of control
• $48,500: the long-term holder realized price, which every bear market has taken out
Also covered: a daily RSI of 16, SOPR capitulation still missing, the VIX closing at 35.9 and Nvidia's weekly RSI at 25.
▶️ Replay:
📝 Full written summary
post-image
BTC-0.67%
NVDA-13.84%
📉 BTC fell below $60,000—can it rebound this weekend?

On November 20, BTC briefly fell below $60,000, hitting its lowest level since July. Tech stocks also came under pressure, and selling sentiment continued to intensify.

The market had been discussing whether $60,000 could hold. Now the question is: after breaking below it, can BTC quickly reclaim that level? 👀

🔮 Weekend market predictions are live!

📈 Bullish camp: Quickly reclaim $60,000

📉 Bearish camp: Continue lower and search for new support

💬 Do you think BTC will reclaim $60,000 first, or fall further first?

Leave your pre
GateSquare
📉 BTC fell below $60,000—can it rebound this weekend?
On November 20, BTC briefly fell below $60,000, hitting its lowest level since July. Tech stocks also came under pressure, and selling sentiment continued to intensify.
The market had been discussing whether $60,000 could hold. Now the question is: after breaking below it, can BTC quickly reclaim that level? 👀
🔮 Weekend market predictions are live!
📈 Bullish camp: Quickly reclaim $60,000
📉 Bearish camp: Continue lower and search for new support
💬 Do you think BTC will reclaim $60,000 first, or fall further first?
Leave your prediction + a key price level in the comments, and we’ll review it together next week!
#BTC跌破6万美元关口

repost-content-media
BTC-0.67%
SOL-0.77%
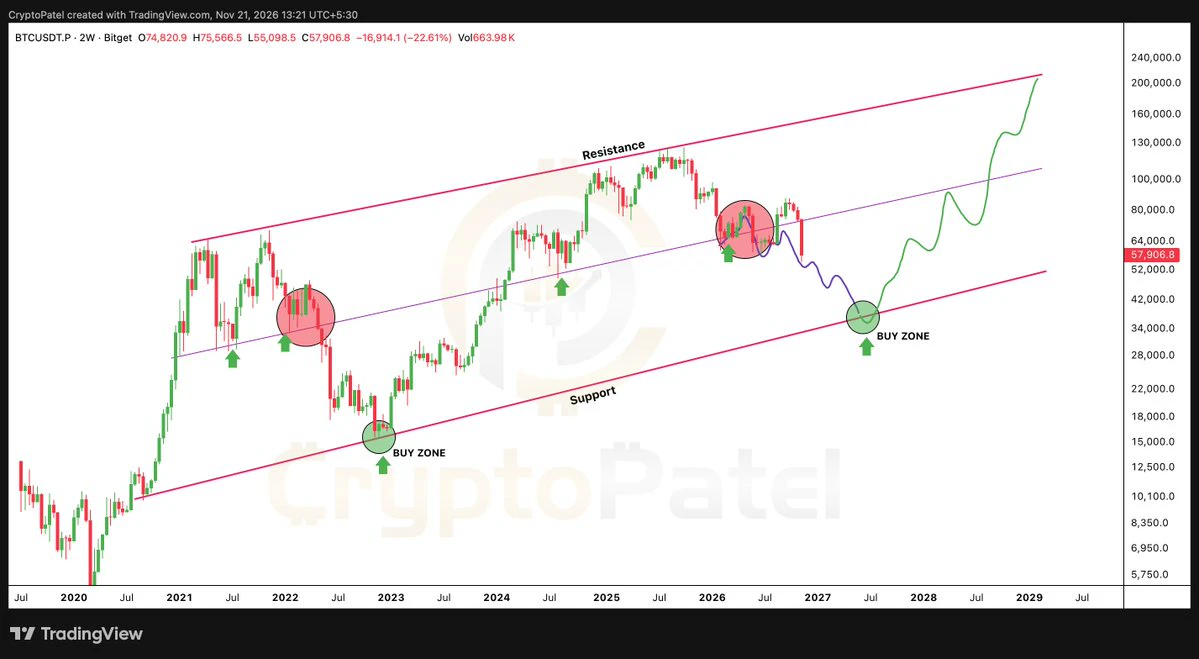
Bitcoin to $35K before $200K?
Most people aren't ready for another 50% crash.
But the long-term ascending channel says $35K–$40K could be the ultimate BTC accumulation zone.
The next bull run could make today's panic look stupid.
post-image
BTC-0.67%
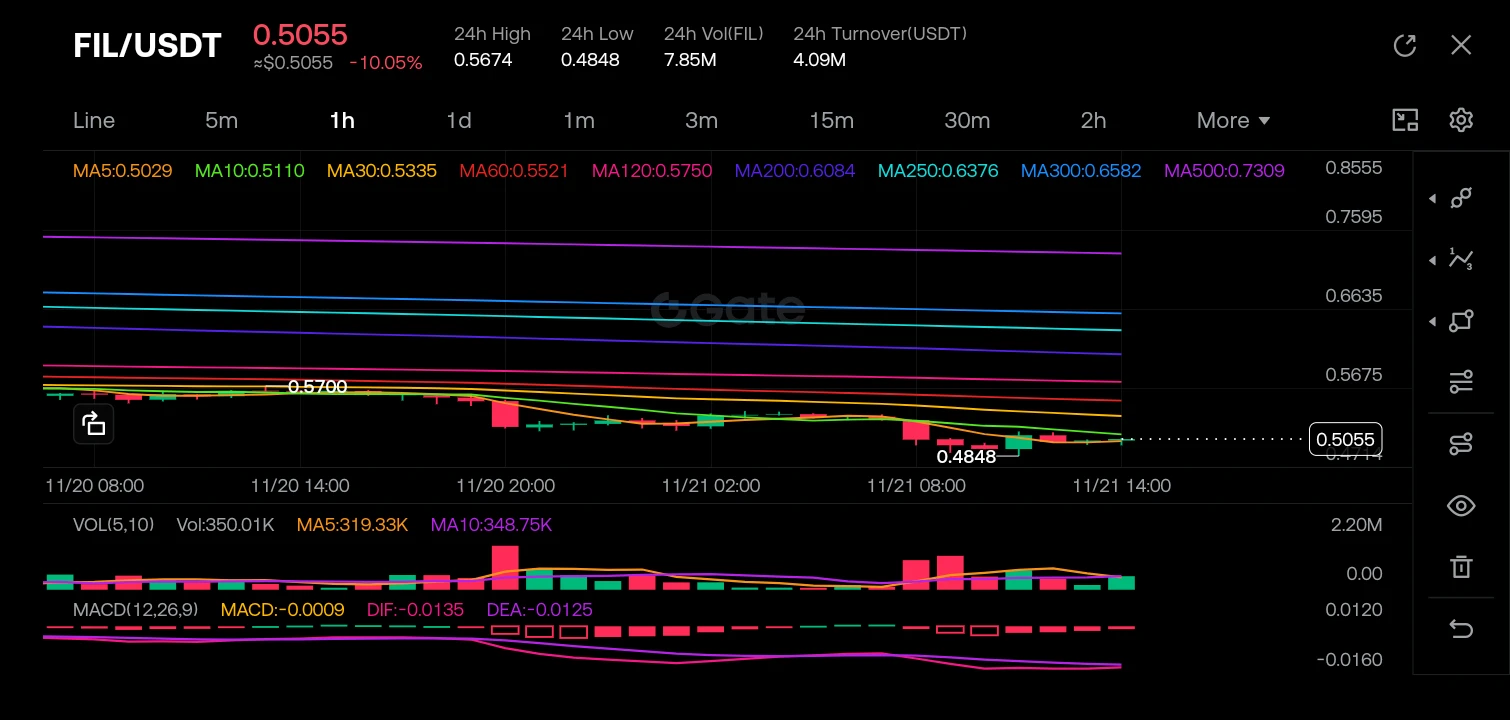
Navigating the FIL/USDT Bearish Breakdown ‌
$FIL ‌
The market is currently witnessing a classic liquidity sweep, where the price has aggressively broken below key structural support levels, triggering a cascade of long liquidations. As seen in the chart, FIL/USDT has dropped over 10% in the last 24 hours, currently hovering at 0.5055. By analyzing the confluence of moving averages, volume spikes, and MACD divergence, we can map the path from macro distribution to micro-scale oversold conditions to determine the next high-probability entry point.

· Macro Flow (1 Month to 1 Week): The overarch
post-image
FIL-2.00%
  • 1
Load More

Join 40 M users in our growing community

⚡️ Join 40 M users in the crypto craze discussion

💬 Engage with your favorite top creators

👍 See what interests you

Trending Topics

BTCBreaksBelow60K

2.1M Views29.4K Discussing

BTC fell below $60,000 on November 20 for the first time since July, alongside a tech stock selloff and broader pressure on risk assets. Will $60K become resistance, or can BTC quickly reclaim it? What price or volume signals would convince you that selling pressure is easing?

GateDirectIPOPhase3ANTAllocates92100Shares

754.6K Views4.8K Discussing

NvidiaDropsNearly14Percent

316.8K Views7.5K Discussing

View More