



Square
Following
Hot
News
Profile
Share your thoughts
placeholder
Article
#美股财报季 #AMZN Amazon’s earnings report has a clear main story: AWS determines growth, advertising and retail determine the margin for error, and AI capex determines share-price volatility.
1. Growth drivers: AWS matters most, followed by advertising
AWS generated $42.232 billion in second-quarter revenue, up 37% year over year; operating profit was $16.621 billion, with its margin rising to 39.4%. It contributed about 60% of the group’s operating profit but only one-fifth of revenue.
So AWS is the first thing to watch when judging whether Amazon can continue to beat expectations. E-commerce pro
AMZN-0.97%
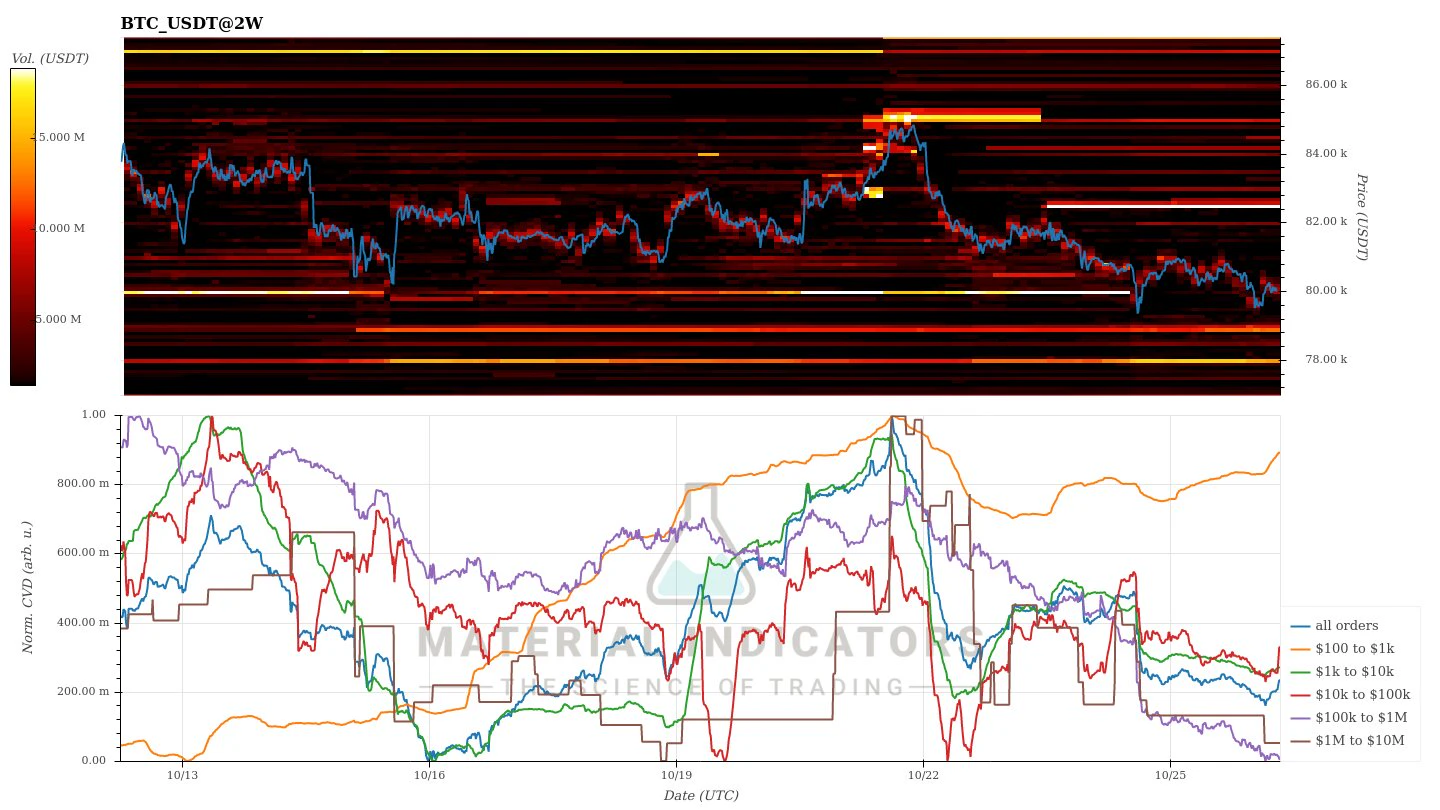
The $BTC CVD indicator shows the activity of red whales.
The whales had been taking a break since the weekend, but the red whales are now showing signs of movement again.
Meanwhile, the larger purple and brown whales remain inactive.
The sell wall at $82.5k remains solid, while buy walls have formed at $79k and $78k.
post-image
BTC-0.23%
Trenches
STONK
S
bade
b
STONK
6GmA...UNgx
Market Cap
$.
Change
.
24h Vol
$.
Holders
.
CNPY
C
bade
b
CNPY
0xc6...ddd2
Market Cap
$.
Change
.
24h Vol
$.
Holders
.
BTC
B
bade
b
BTC
C5xp...pump
Market Cap
$.
Change
.
24h Vol
$.
Holders
.
LAUNCH
L
bade
b
LAUNCH
AhBi...Qj6C
Market Cap
$.
Change
.
24h Vol
$.
Holders
.
Q
Q
bade
b
Q
0xc0...0589
Market Cap
$.
Change
.
24h Vol
$.
Holders
.
$PAXG is attempting a bullish rebound after a sharp sell-off! After a sustained decline on the 4-hour chart, $PAXG is showing signs of a rebound in the $3,985–$4,000 range. Buyers are pushing the price toward $4,030, but confirmation is still needed before expecting further gains. Entry: $4,020 – $4,030 Target: $4,045 / $4,060 / $4,075 Stop-loss: $4,000 Buy and trade
post-image
PAXG+0.37%
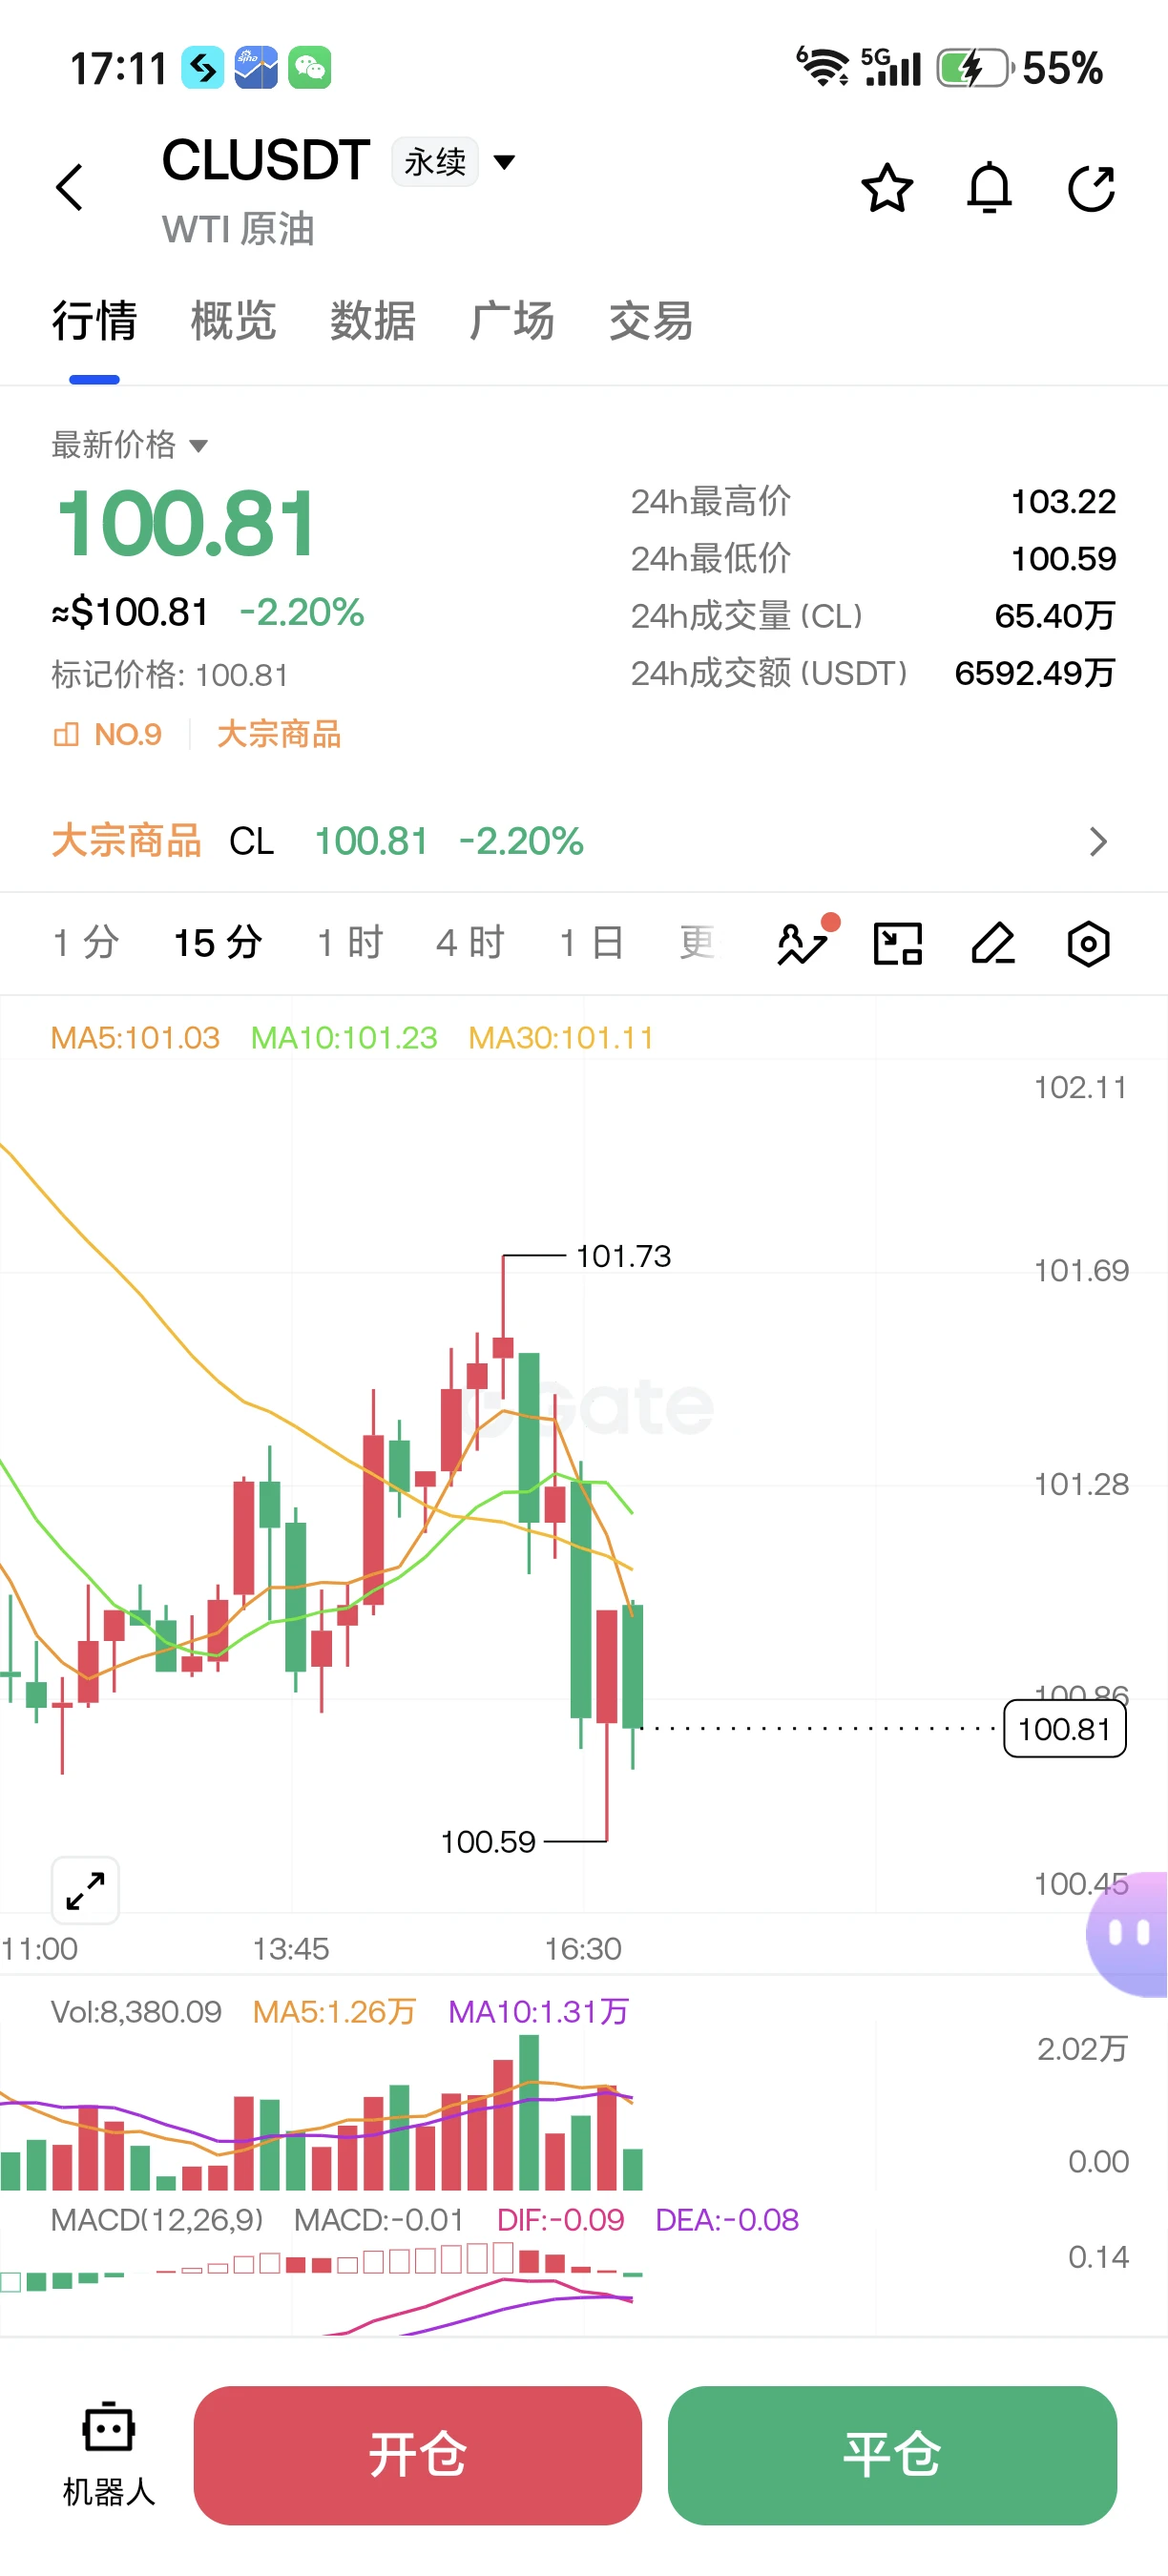
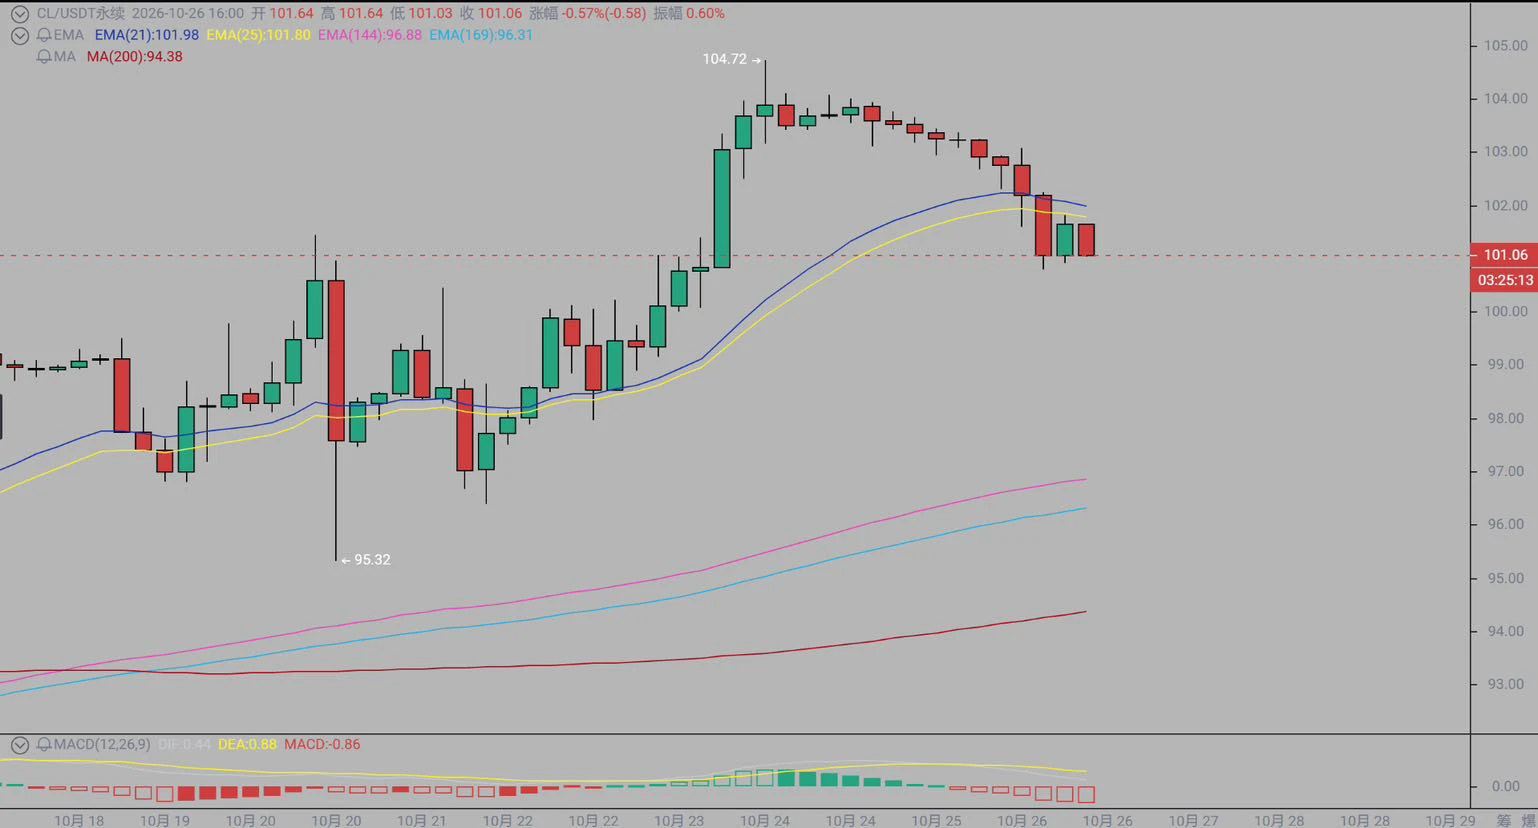
Oil has finally come down! Holding on was killing me!
This time I had to endure two brutal positions, gold and oil. I give up! It’s been a whole week!
There are just three key reasons behind the sustained rise in oil prices this time:
First, geopolitical risks in the Middle East. The Strait of Hormuz and the Red Sea are major arteries for global oil flows. Tensions have markets worried that tanker shipments could be disrupted, adding a risk premium directly. This is the biggest driver of the rally.
Second, OPEC+ cuts are propping up prices. Saudi Arabia and Russia are actively limiting product
post-image
GLDX-0.40%
PAXG+0.37%
GAS-0.57%
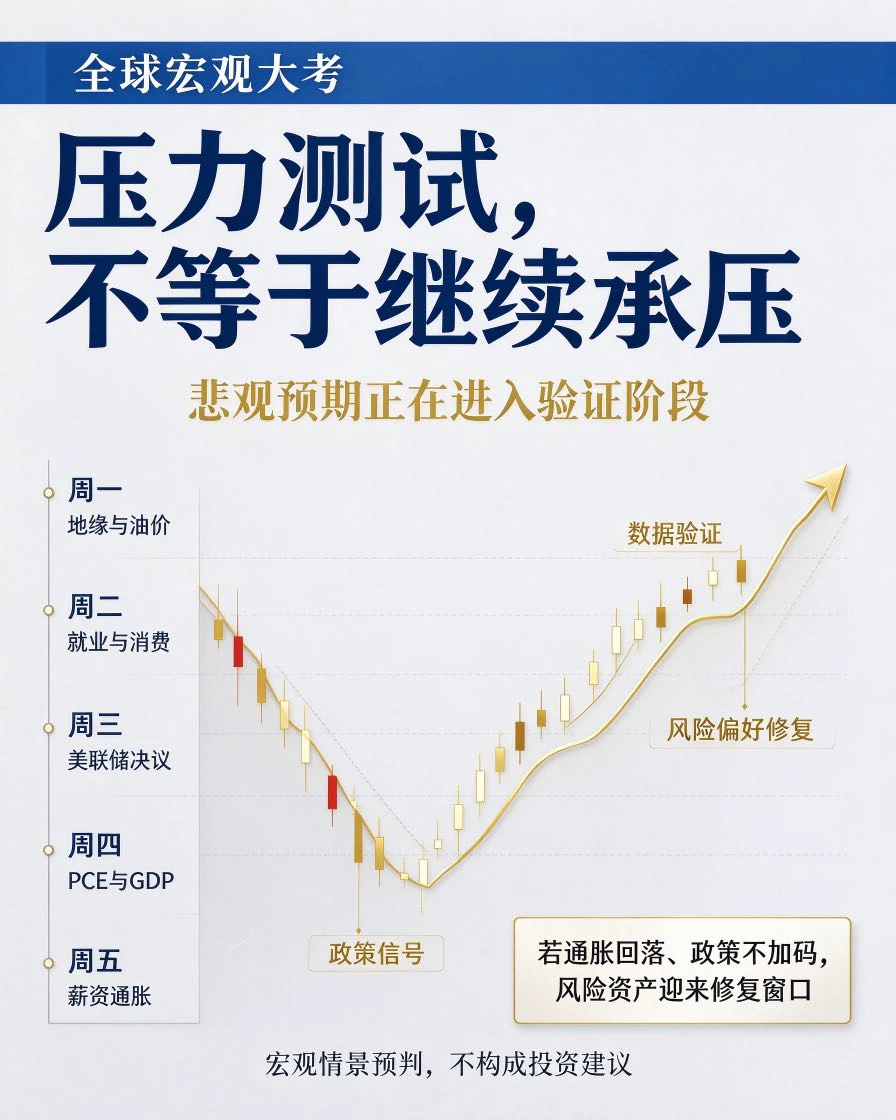
This week could be a stress test for global markets! ⚠️
Oil prices, inflation, Fed policy, jobs data, and the situation in the Middle East—multiple risk factors are about to converge.
The key dates to watch:
#BTC争夺8万美元关口
Monday: U.S. markets reopen, and the situation in Iran could affect oil prices and risk appetite.
Tuesday: U.S. employment, housing, and consumer confidence data.
Wednesday: The Fed's rate decision and remarks by Kevin Warsh.
Thursday: PCE inflation and GDP data. Inflation is forecast to rise to 3.6%,
Friday: Japan's unemployment rate and U.S. wage inflation data.
Meanwhile,
post-image
Crypto
What price will Bitcoin hit in 2026?
↑ 90,000
47%2.13x
↓ 70,000
40%2.50x
$160.52K 24H+44 more
BTC-0.67%
Key News This Week | 10.26–10.30

✅Monday | Blast project shutdown
An on-chain project is exiting, weighing on market sentiment. No major data releases are expected for now, so don't rush in; wait for BTC to retest key support before assessing the market.

✅Tuesday | First day of the FOMC meeting
Most funds are reducing positions and waiting on the sidelines, with the market likely to trade sideways in a narrow range. The market is suited to short-term range trading, not trend positions.

✅Wednesday | FOMC decision (02:00) + Warsh press conference (02:30)
Rates are widely expected to remain
post-image
BLAST-15.25%
BTC-0.67%
ETH-1.26%
SOL-0.77%
If crude oil comes down, BTC and ETH may have a chance.
But the blond guy has already amassed forces in the Middle East. He probably won't make a move before the midterm elections on November 3, and crude oil needs to be brought down a bit too; otherwise, it won't be very beneficial for him.
Yesterday, Russia also compromised, agreeing to provide the US with any amount of diesel, so this may just be a show put on before the midterm elections.
If crude oil comes down, can I go long and make back what I lost on BTC?🥹
$BTC $ETH #美股财报季
post-image
FyPaymentMadeEasy
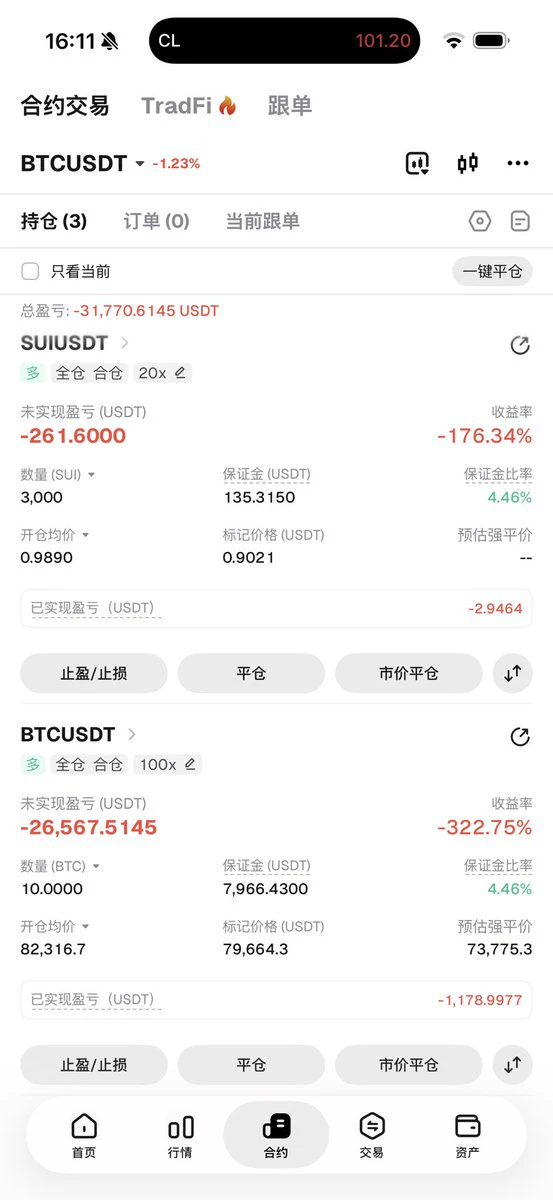
I can barely hold on anymore, guys!
I’ve been a little anxious these past few days. I keep telling myself it can’t go any lower, but it’s not up to me.
Bitcoin, just put me out of my misery. Whether I live or die is up to fate.
repost-content-media
BTC-0.65%
ETH-1.23%
3 altcoins I'm watching: Next rally targets
$LIGH — Target: $0.3100
$ER — Target: $0.0990
ANIME — Target: $0.003650
post-image
ANIME-6.83%
🔥 $RAYSOL
Strong long: RAYSOL stabilized near the 1.7500 support area and is showing signs of recovery. The price is currently trading around 1.8564, up nearly 3.5% over the past 24 hours. The chart shows that after a prolonged decline, the price has entered a consolidation phase, with buyers attempting to regain control of the market. If the price breaks through the local resistance area and bullish momentum strengthens, it could rebound to higher levels. 🚀Entry: 1.8300 – 1.8600Stop-loss: 1.6850Take-profit 1: 2.0000Take-profit 2: 2.3000Take-profit 3: 2.6891Trade here $RAYSOL : 👇
post-image
Gold special, another day of great gains—six-six, everything’s going smoothly, and the God of Wealth is on the way!
GLDX-0.40%
PAXG+0.37%
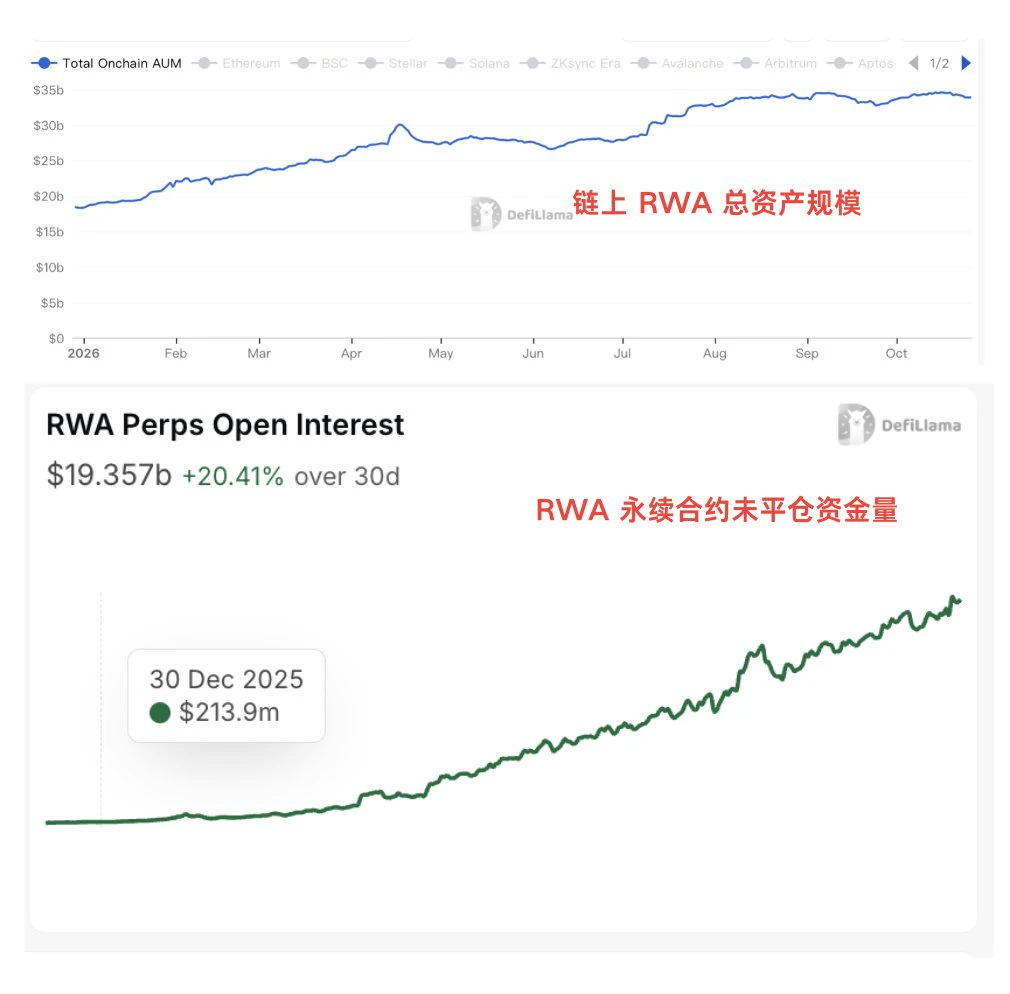
Facts you need to know about bringing RWA assets on-chain:
In 2026, the total value of RWA assets on-chain grew from $18 billion to $34 billion, up around 90%—already pretty fast, right?!
But open interest (OI) in RWA contracts surged from $200 million in 2026 to $20 billion, a 10,000% increase, and it continues to trend upward.
The total market cap of the US stock market is about $75.3 trillion. Imagine Crypto capturing just 1% of the US stock market—even then, there’s still dozens of times more room for RWA spot assets to move on-chain.
Just imagine how big the RWA Perps market could get by
post-image
RWA-0.39%
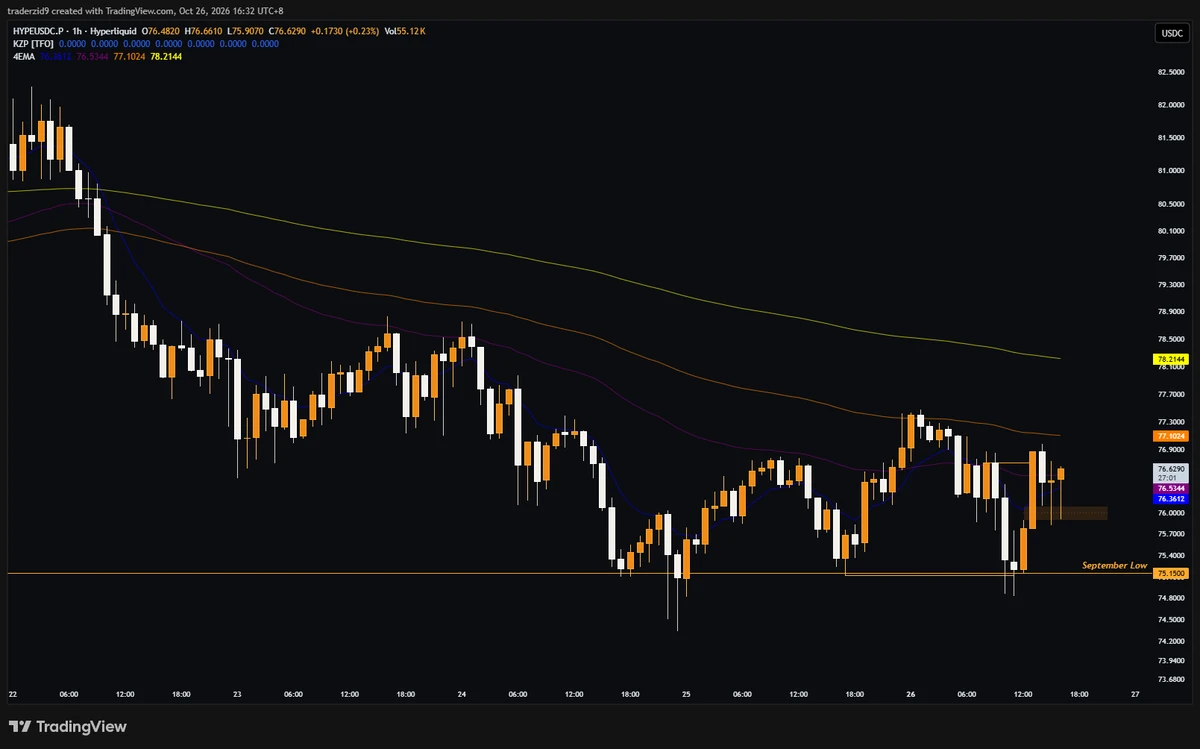
I may have been a hyperliquid:native bear for a few weeks but you always need to trade the setup when it's there in your face.
If $BTC holds this could be a runner.
post-image
HYPE+0.24%
BTC-0.67%
market update
live-cover
LIVE2,170
Gold is basically forming a bottom
Whether to buy the dip is up to you; basically, a V-shaped bottom has formed
The support is still quite strong
#Gate广场万圣节
post-image
GLDX-0.40%
PAXG+0.37%
BTC update
live-cover
LIVE1,829
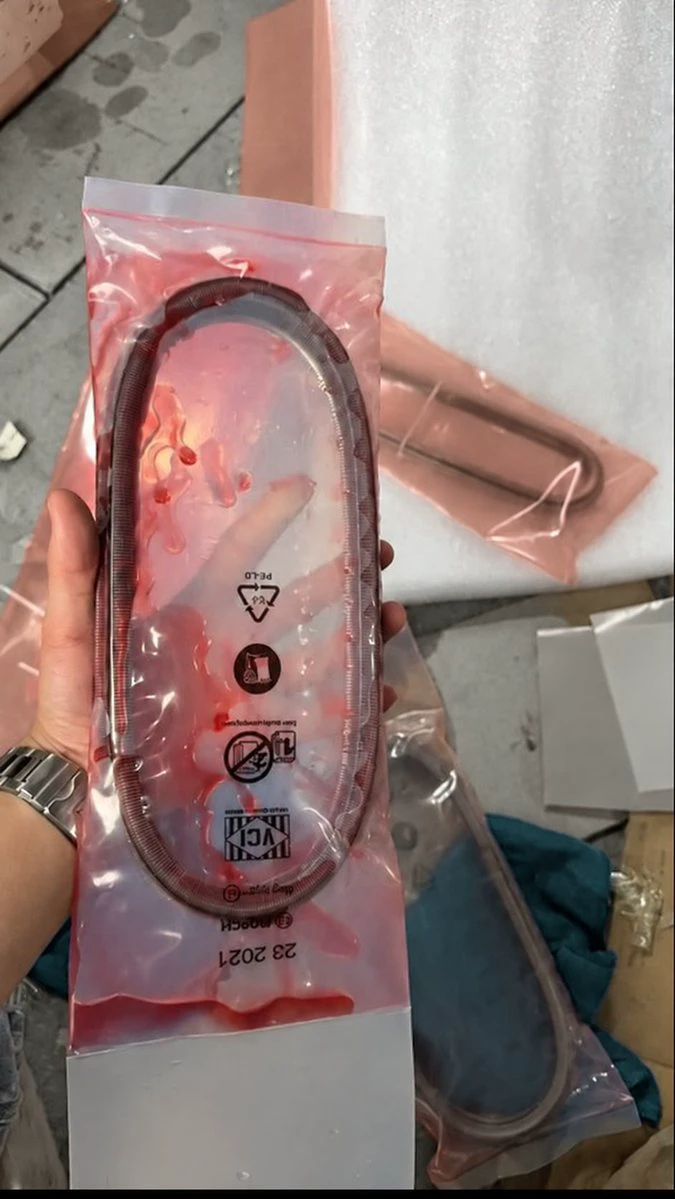
What is this? Should I call the police?
What should I do? What should I do?
Urgent! Urgent! Urgent!
post-image
📈 BTC bulls and bears battle around the $80k mark | Post to claim red packets, win up to 100 USDT on the weekly leaderboard!
Gate Square’s “Come Share Every Week” trending special is underway!
🎁 Event Rewards
New users who post: Claim a red packet with a 100% chance
Weekly leaderboard: Win up to 100 USDT
📌 How to Participate
1️⃣ Sign up for the event 👉 https://www.gate.com/campaigns/6244
2️⃣ Share your take with the hashtags #每周来晒 and #每周来晒
💬 This Week’s Topic
Bitcoin continues to fluctuate around the $80k mark as bulls and bears battle it out. $BTC Can it regain a foothold above $80k,
GateSquare
📈 BTC bulls and bears battle around the $80k mark | Post to claim red packets, win up to 100 USDT on the weekly leaderboard!
Gate Square’s “Come Share Every Week” trending special is underway!
🎁 Event Rewards
New users who post: Claim a red packet with a 100% chance
Weekly leaderboard: Win up to 100 USDT
📌 How to Participate
1️⃣ Sign up for the event 👉 https://www.gate.com/campaigns/6244
2️⃣ Share your take with the hashtags #每周来晒 and #每周来晒
💬 This Week’s Topic
Bitcoin continues to fluctuate around the $80k mark as bulls and bears battle it out. $BTC Can it regain a foothold above $80k, or will it continue to fall in search of support? Given the current market, would you buy the dip, go short, or sit on the sidelines?
👉 Post now: https://www.gate.com/post/topic/BTCBattlesFor80000?topic_id=179682
‍#BTC争夺8万美元关口
repost-content-media
BTC-0.67%
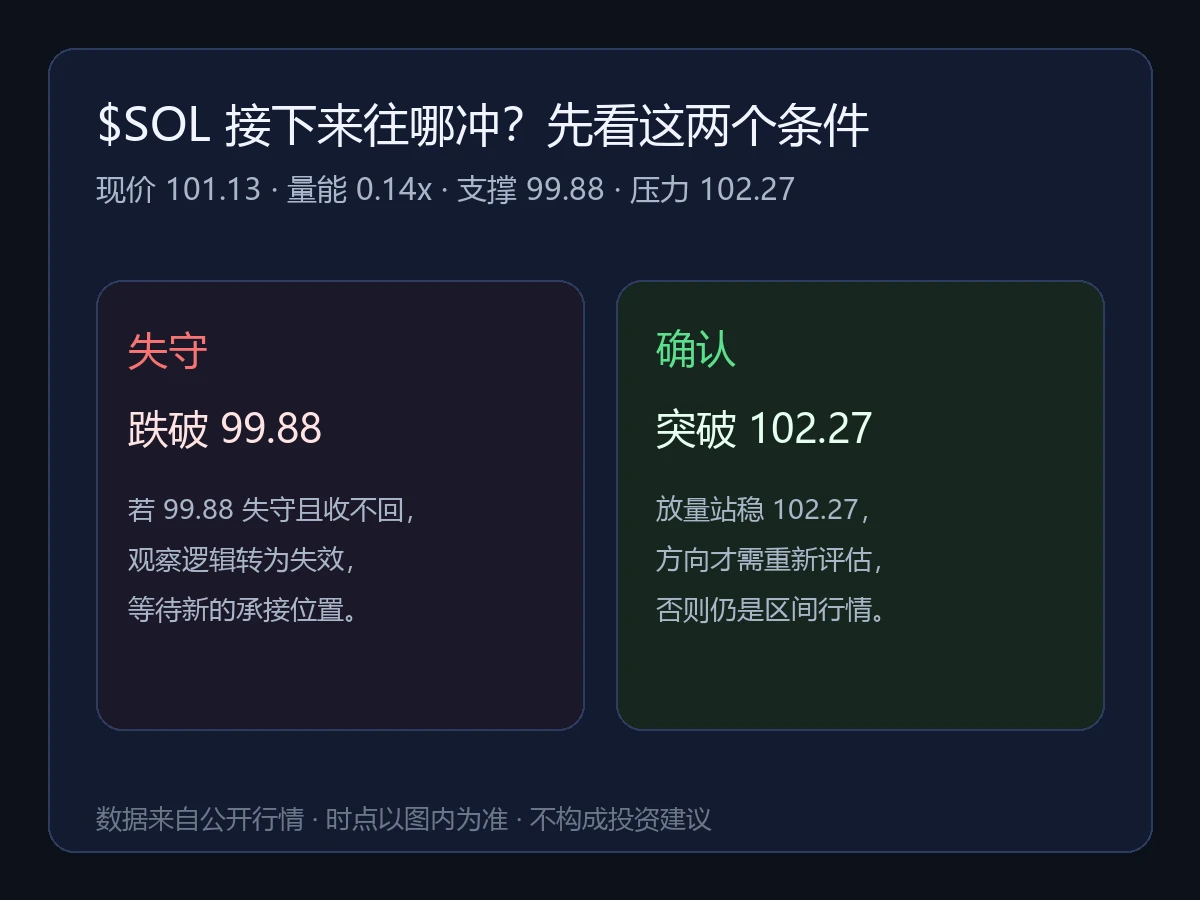
What’s most worth watching in this $SOL chart isn’t the 0.18% 24-hour gain itself, but that the 1-hour and 4-hour charts are both weak without pointing to the same conclusion.
$SOL is currently at 101.13 USDT, up just 0.18% over 24 hours, with volume at only 0.14 times the average—price moved, but volume didn’t follow.
Both the 1-hour and 4-hour charts show weakness. Support at 99.88 and resistance at 102.27 have yet to be decisively broken, and the directional signals are clearly at odds with volume.
I’m inclined to think this weak move lacks momentum to continue. Low volume often means the
post-image
SOL-0.77%
Load More

Join 40 M users in our growing community

⚡️ Join 40 M users in the crypto craze discussion

💬 Engage with your favorite top creators

👍 See what interests you

Trending Topics

USEarningsSeason

127.46k Views3.7k Discussing

The U.S. Q3 earnings season is in full swing, with major tech companies including Tesla and Meta reporting results. Market focus is shifting beyond revenue and profit toward AI spending, capital expenditure, margins and forward guidance. Which company’s earnings are you watching most closely?

GateWCTCS9GlobalTradingCompetition

811.07k Views8.26k Discussing

BTCBattlesFor80000

50.18k Views24.65k Discussing

View More