Square
Following
Hot
News
Profile
Share your thoughts
placeholder
Article
peak lighting on the streets of north kolkata
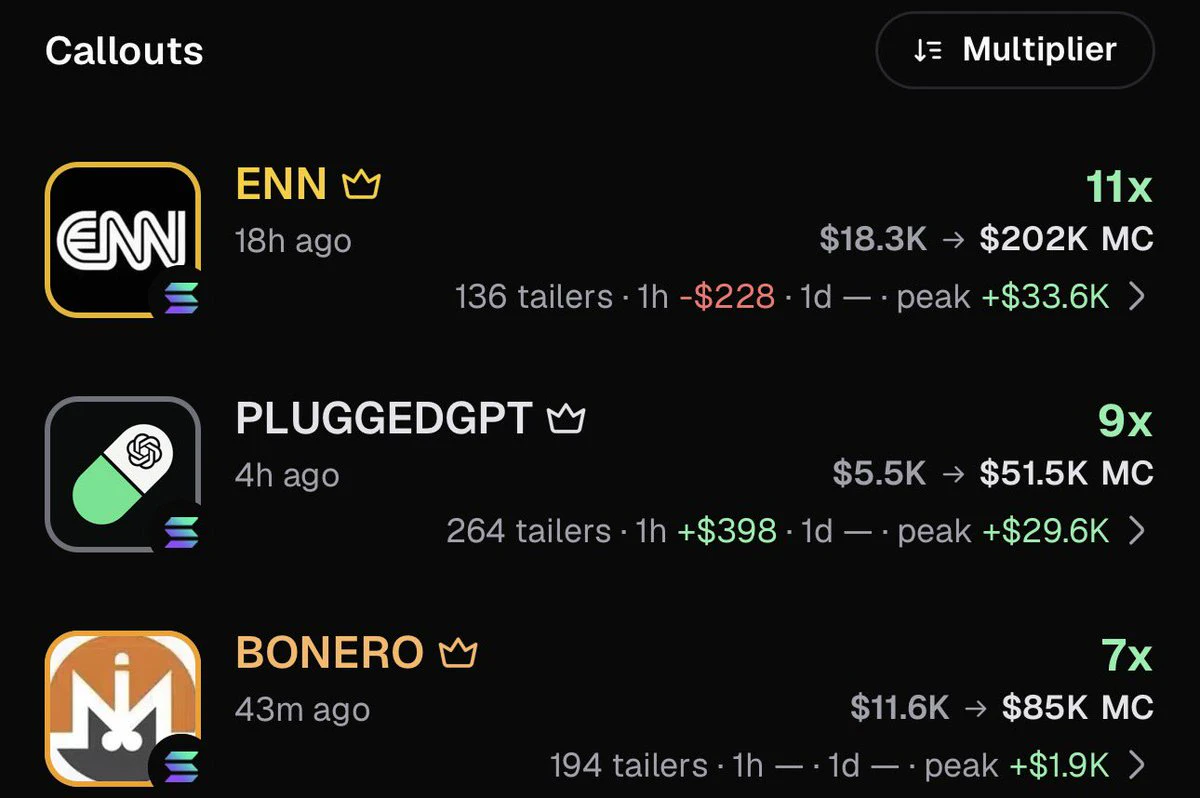
first day calling on @Pumpfun
bullish tek!
post-image
$INJ is heading straight toward a major selling-pressure zone
INJ has rebounded strongly from around 7.00 and is now approaching the 8.50–8.70 resistance zone. This is exactly where I stop chasing the rally and start watching for a potential price rejection. Short setup entry zone: 8.30–8.60Next target price: 8.20TP1: 8.05TP2: 7.80Final target: 7.55Stop-loss: 8.95The upward momentum is strong, but the price is now approaching the same zone where sellers stepped in previously. If INJ fails to establish a firm foothold above 8.50–8.70, a strong rejection candle could trigger a rapid pullback. A
post-image
INJ+10.36%
I make about $29k a month with options.
NO Day trading
NO Swing trading
NO Covered calls
NO Cash secured puts
NO BS
INSTEAD, I DO THIS:
Build base portfolio
Sell portfolio secured puts (not cash secured)
Buy LEAPS with the premium from sold puts
BUY shares with the premium from sold puts
Keep ratios in check
I can explain it to a 13 year old & I will likely outperform 95% of people that read this.
Simple wins.
post-image
$NEAR The most interesting thing right now is not guessing whether prices will rise or fall, but seeing who is forced to change their tune first.
The bulls’ test is at 5.44, while the bears’ test is at 4.527. $NEAR is currently at 5.392, up 11.96% in 24 hours. One-hour support is 4.527, resistance is 5.44, and current volume is 0.31 times the average volume of nearly 20 bars.
For now, I’ll note that $NEAR remains strong, while the crowded positioning is already out in the open. I acknowledge that the trend is strong, but what matters next is not how much higher it can surge, but whether anyone
post-image
Range-bound SKHYNIX is about to break out and most traders are positioned the wrong way.

$SKHYNIX /USDT - SHORT

Trade Plan:
Entry: 971.37 – 978.79
SL: 1010.69
TP1: 948.37
TP2: 930.56
TP3: 903.85

Why this setup?
Why now? The daily trend is range, but the 1h ATR of 14.839521 signals a squeeze is building inside that range. The 15m RSI at 58.85 shows momentum is not yet exhausted, so a short entry near 975.08 is valid as long as we stay below 978.79. TP1 at 948.37 and TP2 at 930.56 define the first two targets on the path down, while the invalidation level of 1156.63 is the hard line that w
SKHYNIX-5.77%
$SNDK
Key levels respected; bounced from the $1,279.29/share support zone
I will only pick this at $995.69/share, or I leave it
#NFA
SNDK-0.56%
If I could leave just one note for $FIL today, it would be: don’t let +7.87% make the decision for you.
What’s really worth discussing is that $FIL remains strong, while the crowded trade is already out in the open. $FIL is currently at 1.172, up +7.87% over 24 hours. The 1-hour support is 0.9999, resistance is 1.1774, and current volume is 0.61 times the average volume of nearly 20 bars.
The 1-hour trend is strong, with RSI at 78; the 4-hour trend is strong, with RSI at 56. This combination makes me temporarily accept the following interpretation: I acknowledge that the trend is strong, but
post-image
FIL+6.46%
$NEAR NEAR Breaks Out of a 4-Year Descending Channel: TP1: $11
NEARUSDT
Weekly Time Frame:
NEAR (1W, log scale) is breaking out of the descending channel that has defined price action since the 2022 top, and the weekly candle is now pushing above the upper boundary.
What the chart shows:
After the 2022 high (~20.6), price spent years in a descending channel, bottoming around the 0.9 area in early 2026.
Since that low, price has risen sharply and is now trading at ~5.4, above the channel’s upper trendline.
The breakout is happening at the 2024 volume profile POC (~5.2), so the trendline and a h
post-image
NEAR+10.25%
The more gold prices fall, the more aggressively China buys. From March to July, its purchases rose from 4.98 tons to 19.91 tons. This isn’t bottom-fishing; it’s welding a floor under gold prices. Ahead of the Fed decision, the market is already pricing in expectations. True liquidity providers only watch who is quietly absorbing the supply. Those holding gold should weigh this for themselves. If you have anything to add, see you in the comments.
post-image
GLDX+1.96%
PAXG+1.41%
Short-Selling Analysis of the Biggest Decliners: Real wealth is hidden in the red candlesEveryone is mesmerized by green candlesticks. Chasing pumps, chasing hot trends. But where is the real opportunity? It is right in front of you—in the red candles. Most people are too afraid to touch them. These four coins are weakening sharply. The market structure has already broken down. Sellers are fully in control. This is not a pullback, but a trend. Smart money positioned itself long ago. I have carefully examined every chart. No hype, just letting the charts speak. $TRUT
Risk level: HighEntry price
post-image
$DOGE About To Make Some Gains!?
Just locked into a long on $DOGE!
NFA, DYOR ⚠️
#Crypto #Trading #DOGE
post-image
DOGE-0.40%
$RIVER Always keep a calculator at hand. RıVER+RıVER 3L+RıVER 3S = the resulting figures are the figures that make up the coin’s price
post-image
RIVER-1.66%
Bitcoin’s Long Term Cycle Chart Points to a Bigger Question: Are We in Another Accumulation Zone? 🙄
Bitcoin’s historical price cycles show a recurring pattern: major rallies, deep corrections, and long recovery periods.
The chart highlights previous peaks near $19,700 in 2017, $69,000 in 2021, and $126,000 in 2025, alongside earlier areas that some traders viewed as accumulation zones.
Now, the key question is whether the current price structure represents another opportunity to accumulate or whether the cycle is changing.
I think that the Historical patterns can offer useful context, but the
post-image
BTC+0.31%
$CORE Everyone, do you think it will reach 2u?
post-image
CORE+0.90%
JUST IN: MSCI to remove Michael Saylor's Strategy $MSTR from its indexes.
MSCI+2.49%
MSTR+5.58%
[New Streamer] Whales Moves in Sync!
live-cover
LIVE1,107
Layout: Bitcoin, Ethereum, Dogecoin
live-cover
LIVE880
  • 4
Intraday, Ethereum pulled back toward around 2480, hitting a low of 2322 before recovering and rebounding, but the broader bearish trend remains unchanged. The rebound is only a brief bounce during the decline, with clear overhead selling pressure.
From the current chart, the main bearish structure on the daily timeframe remains intact. This rebound is merely a brief recovery after the rapid dip, while MACD remains bearish.
On the 4-hour timeframe, the price has risen close to the upper Bollinger Band, while bullish momentum is gradually fading and the rebound is weakening. On the 1-hour timef
post-image
ETH+1.52%
1016 $DOGE Recent entry position for DOGE—just look at the daily chart. Every time the broader market makes any move, DOGE starts falling in advance.
I've bought at 0.06888 many times before and played the August range quite a bit. The last time, I held DOGE until it started moving at 0.083 and then exited. I haven't really watched DOGE since, because I think DOGE can sometimes be difficult to trade short-term.
We'll continue placing long orders around 0.06888 and 0.07, with a stop loss at the bear-market low of 0.067. Keep the stop-loss range slightly wider. Leave this long-term lottery orde
post-image
DOGE-0.33%
Load More

Join 40 M users in our growing community

⚡️ Join 40 M users in the crypto craze discussion

💬 Engage with your favorite top creators

👍 See what interests you

Trending Topics

USSeptemberPPIBeatsExpectations

91.35k Views1.88k Discussing

US September PPI came in at 6.3% YoY, well above the 5.3% market expectation, pointing to renewed producer-side inflation pressure. Weekly jobless claims were 199K, broadly in line with forecasts. Could hotter inflation further reduce room for rate cuts, and what does it mean for $BTC, US stocks, and gold?

DrLinHanSpeaksAtOxfordUnion

135.63k Views1.86k Discussing

JapanAndKoreaStocksPlunge

47.27k Views1.76k Discussing

View More