
Share your thoughts
placeholder
Article
Breaking: 🚨🤖 Circle co-founder and CEO Jeremy Allaire announced that machines have chosen their money, with USDC dominating machine-to-machine (agent‑to‑agent) transactions. 🚀 This surge reflects growing confidence in an algorithmic settlement layer that can reduce latency and costs in digital commerce. An increasing number of businesses are automating payments and favoring stablecoins that can be instantly verified on-chain. Analysts predict that USDC may hold a majority share of machine-driven finance within months. Stay tuned for updates. 🔔$CEL , $ONE, $CELR
.
post-image
CRCL+7.92%
USDC0.00%
CEL+22.54%
CELR+47.17%
Financial News, Crypto Market Updates, Real-World Strategies
live-cover
LIVE1,044
  • 1
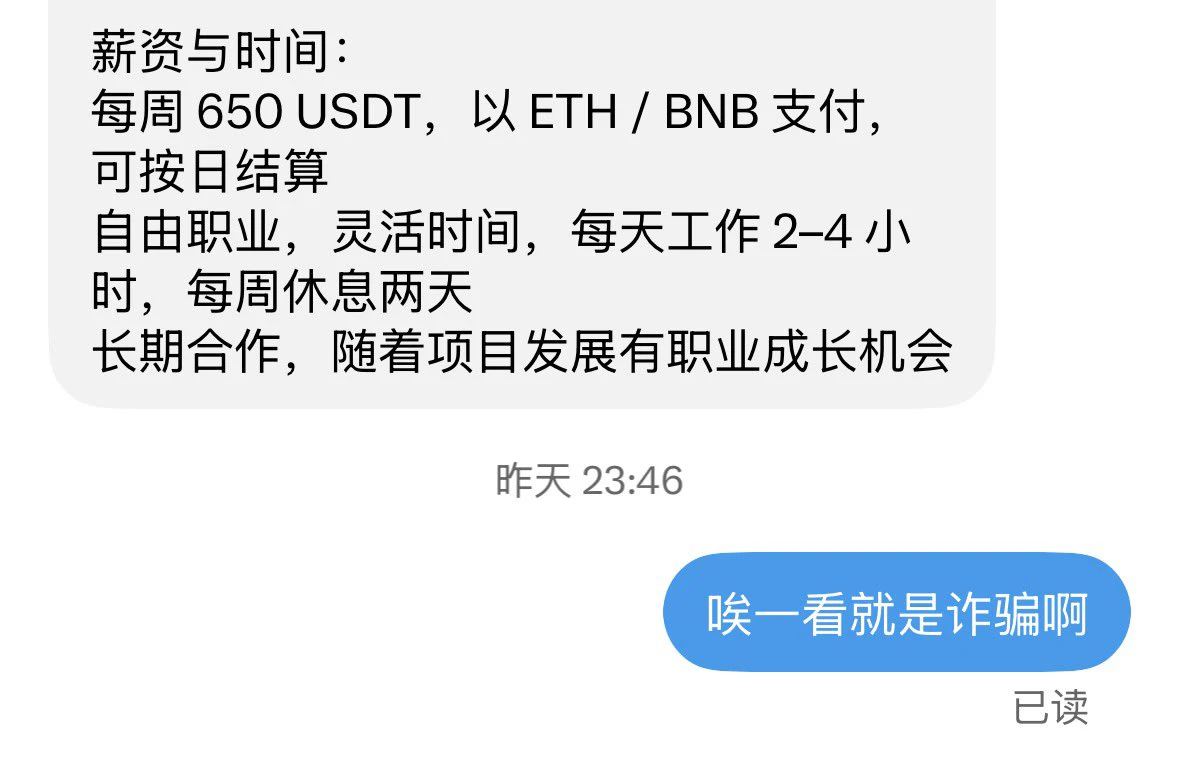
Ugh, bro, it’s obviously a scam.
post-image
#EthereumSpotETFsSee144MNetInflow #GateSquareMidAutumnReunion
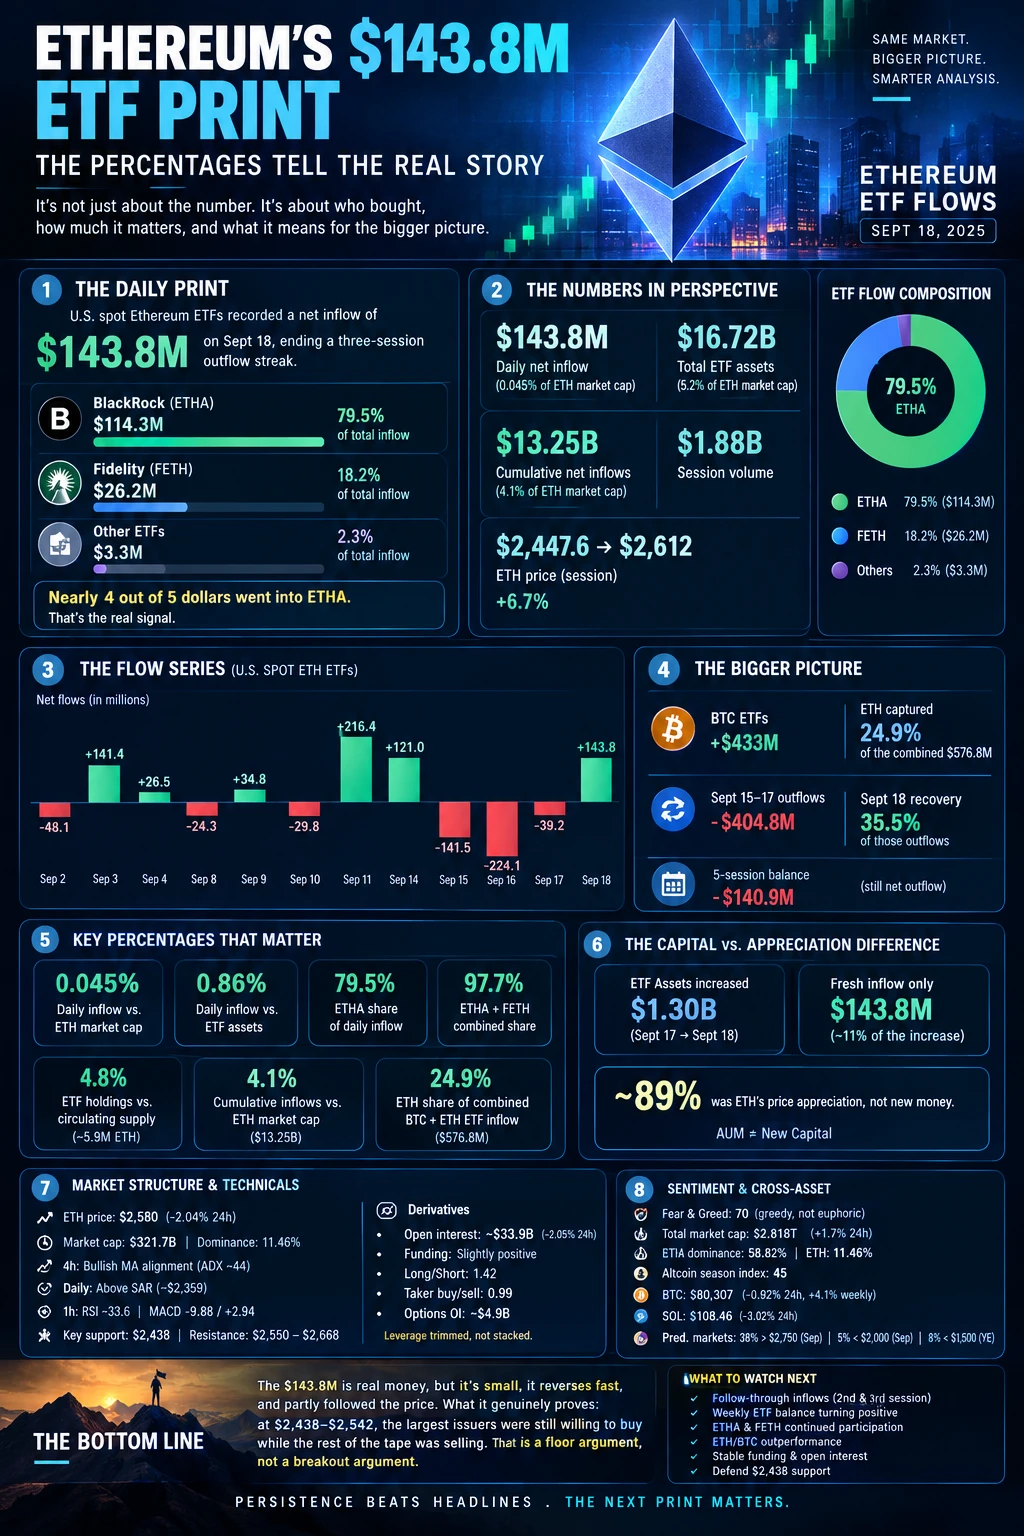
ETHEREUM’S $143.8M ETF PRINT — THE PERCENTAGES TELL THE REAL STORY
Ethereum’s September 18 U.S. spot ETF print deserves more attention than the headline alone suggests. Spot Ethereum ETFs recorded approximately $143.8M of net inflows, ending a three-session outflow streak. The headline is strong, but the real signal appears when the flow is measured against ETF assets, Ethereum’s market capitalization, previous withdrawals and the distribution of capital across products.
BlackRock’s ETHA attracted approximately $114.3M, meaning ETH
post-image
MARKET UPDATES
live-cover
LIVE785
WIF and BONK: Watch One, Avoid the Other
The trends of WIF and BONK have diverged noticeably recently in the Meme sector.
First, WIF.
It previously rose 34% in a single day, reaching $0.2157, then pulled back, dropping nearly 9.5% over 24 hours and returning to around $0.19. On the surface, this looks like a normal correction, but several signals are off. The top ten wallets control 28% of the supply, indicating relatively high concentration. Solana DEX trading volume has not kept pace with the price, showing a price-volume divergence. An analyst said verbatim: “The rally is almost entirely dr
BONK-1.18%
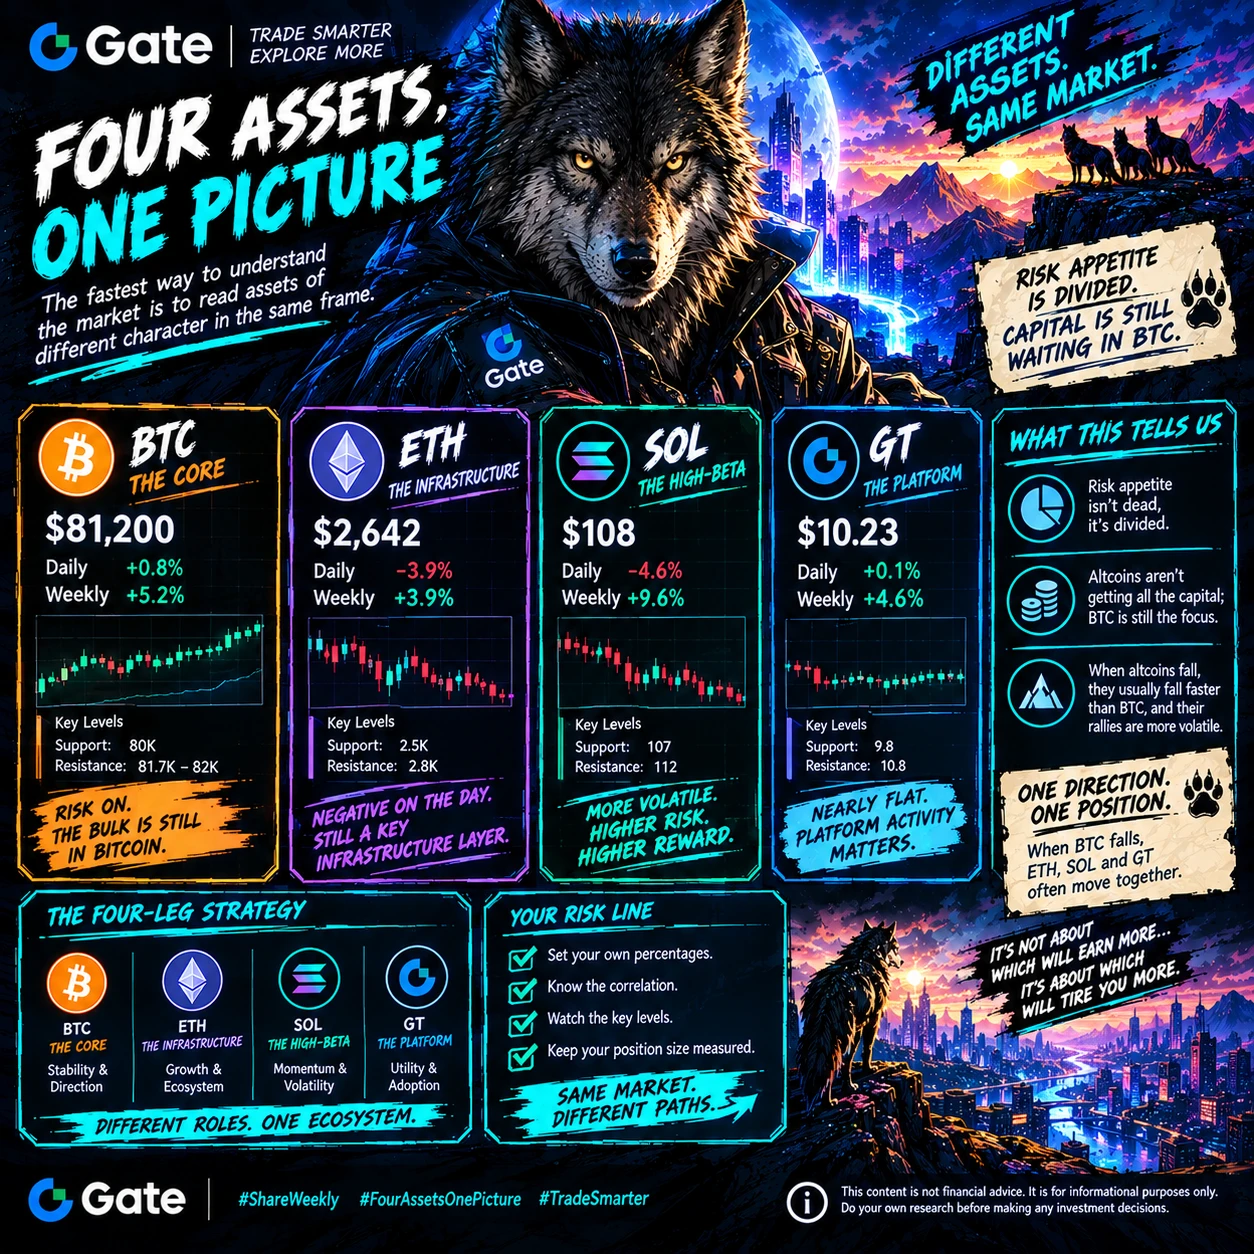
Four Assets, One Picture
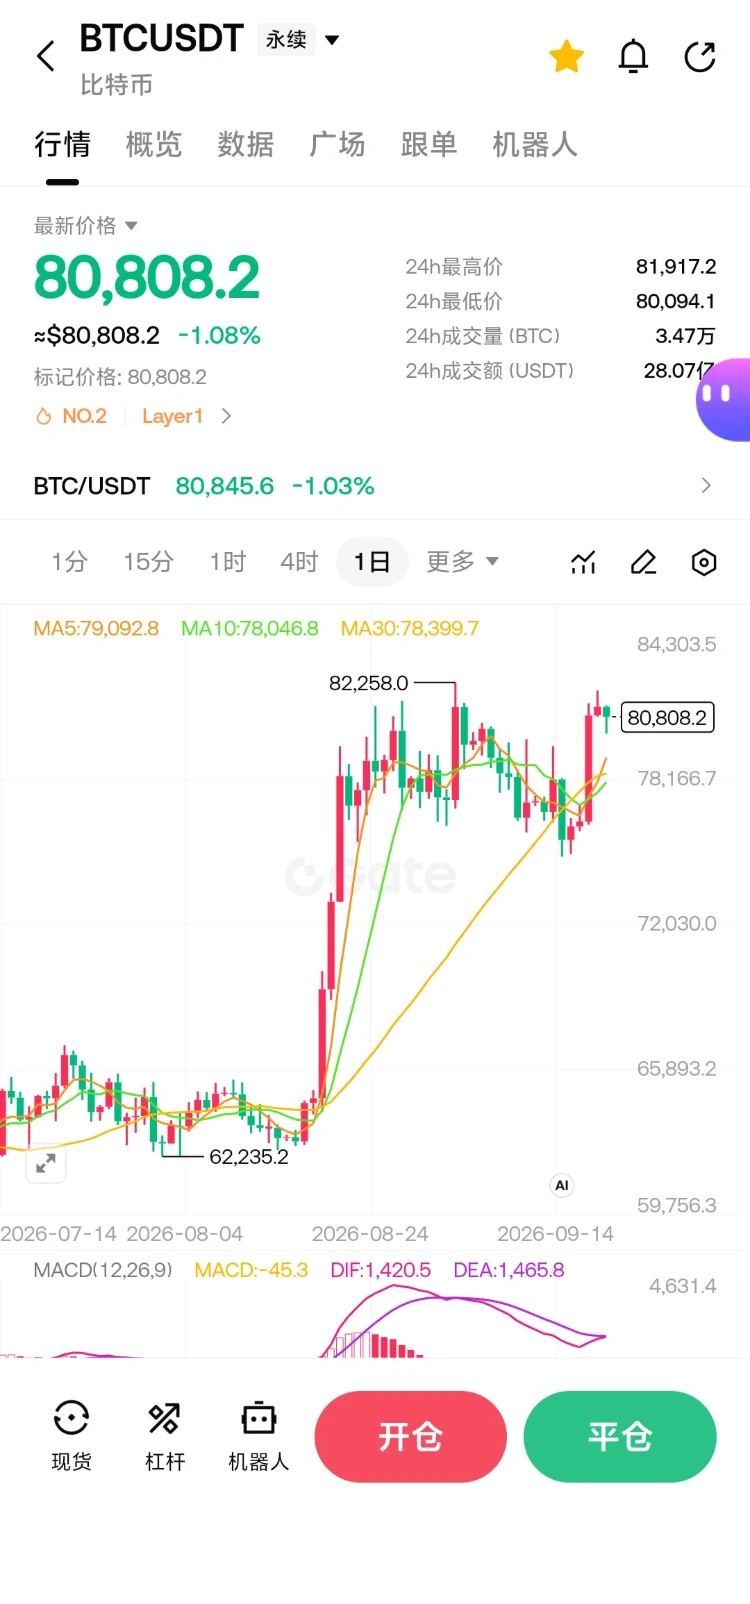
The fastest way to understand the market is to read assets of different character in the same frame. The current picture is short and clear: BTC is trying to hold above 80K and is green on the week; ETH is negative on the day in the 2.5K zone; SOL is seeing a sharper daily drop around 108 dollars; GT is trading nearly flat in the 10 dollar zone.
What this table says is this: risk appetite is not dead, it is divided. Capital is not flowing fully into altcoins; the bulk is still waiting in Bitcoin. In periods like this, declines in altcoins are usually faster than BTC's,
post-image
xxx40xxx
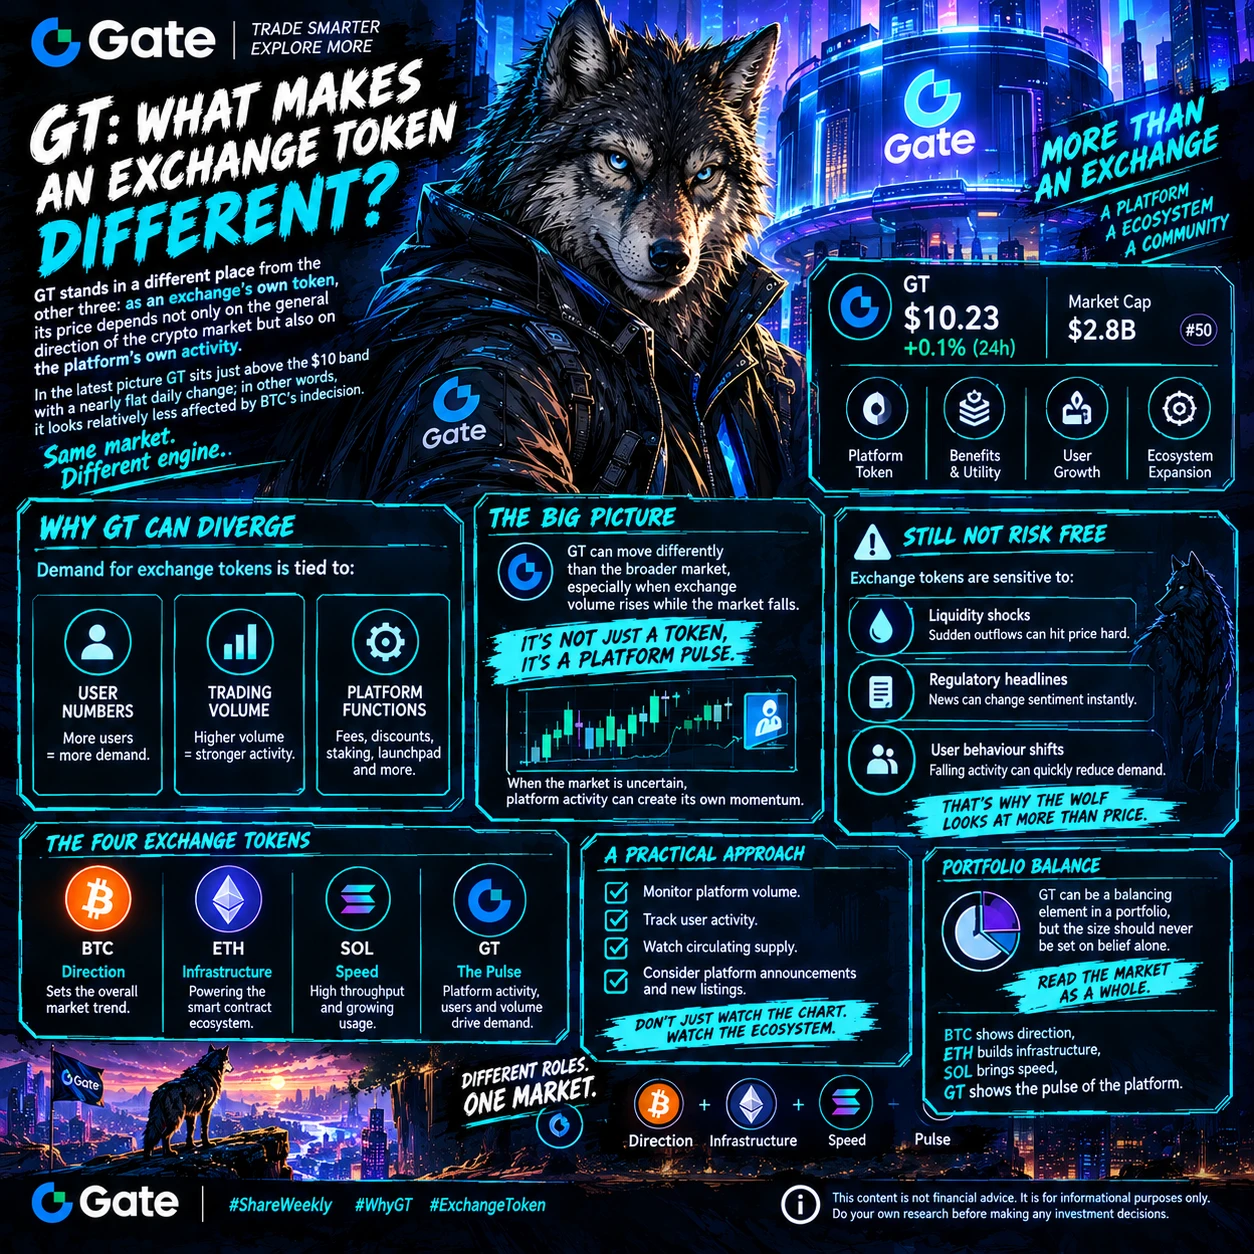
$GT : What Makes an Exchange Token Different
GT stands in a different place from the other three: as an exchange's own token, its price depends not only on the general direction of the crypto market but also on the platform's own activity. In the latest picture GT sits just above the 10 dollar band with a nearly flat daily change; in other words, it looks relatively less affected by BTC's indecision.
The logic of this divergence is simple: demand for exchange tokens is interwoven with user numbers, trading volume and the token's functions inside the platform. When the broader market falls but an exchange's volume rises, that token's story gets written differently.
Still, this does not make GT a safe harbour. Exchange tokens are sensitive to liquidity shocks, regulatory headlines and sudden shifts in user behaviour. That is why the wolf does not look at price alone; it also looks at platform volume, user activity and the token's circulating supply.
A practical approach: GT can be considered a balancing element in a portfolio, but its size should never be set on belief alone. And tracking GT purely through a price chart is an incomplete reading; platform announcements, newly listed assets and activity on the user side directly shape demand for the token. BTC represents direction, ETH infrastructure, SOL speed, and GT the pulse of the platform. Read together, the market picture becomes far clearer: where is capital waiting, where is it flowing, and where is it getting stuck?
Risk Note: This content is not financial advice. It is for informational purposes only. Do your own research before making investment decisions.
$BTC $ETH $SOL
#GateSquareMidAutumnReunion
#BTCRetakes80K #WeekendMarketBullishOrBearish #ShareWeekly #WeeklyShare
repost-content-media
BTC-0.76%
ETH-1.05%
SOL-2.01%
GT-0.57%
  • 1
9/20
Trend Wealth Code
Position for the Bull Market
  • 1
Bitcoin’s opportunity has arrived. Wherever it goes today or tomorrow, I’m going to short from the highs and take a test flight—hurry up and fuel up to push higher.
post-image
BTC-0.79%
#JapanRealEstatePowerChipStocksRise #GateSquareMidAutumnReunion
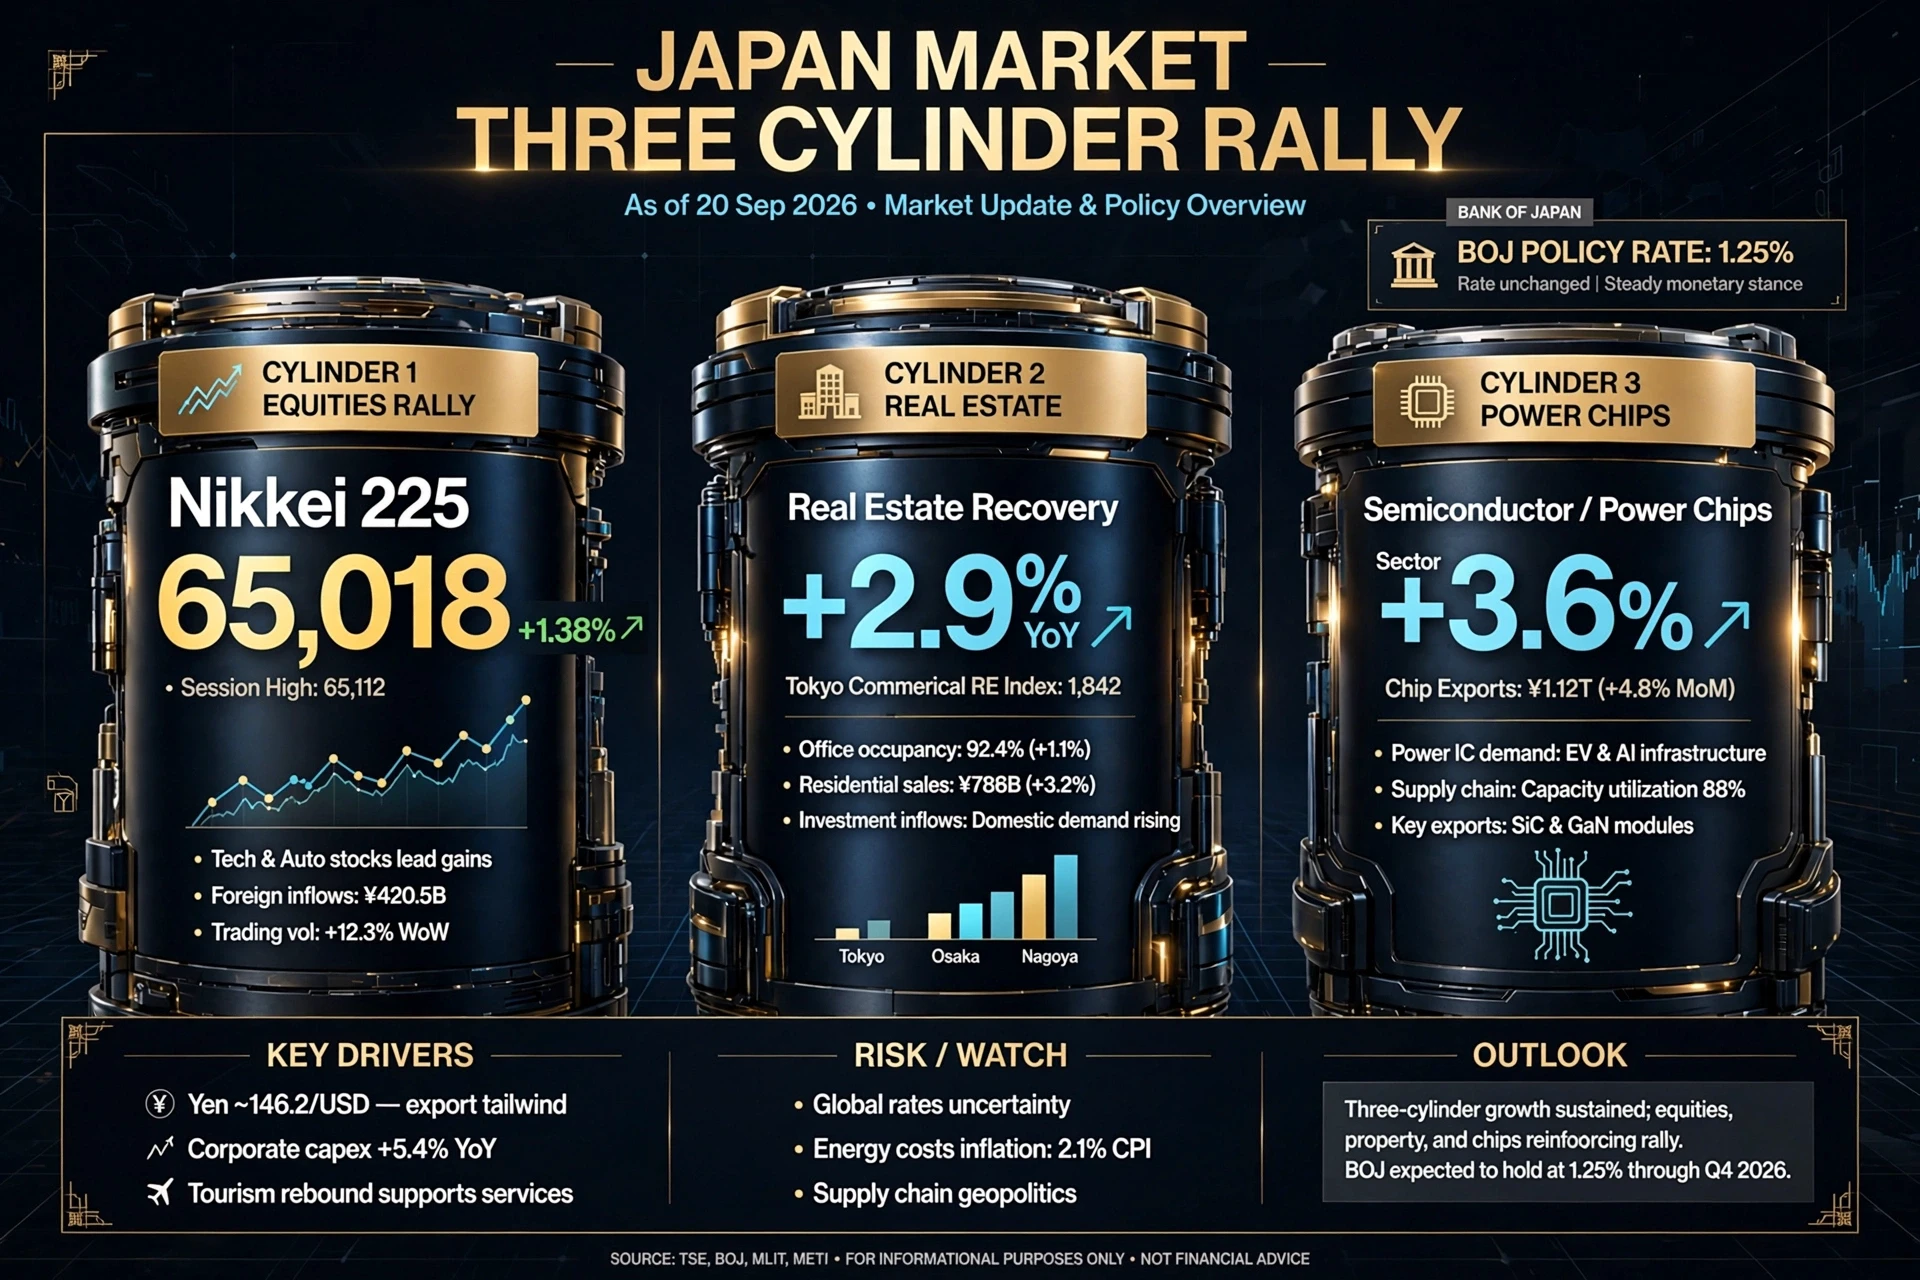
Japan’s market is no longer running on a single engine. It is being driven by three powerful themes at the same time: semiconductors, electricity demand and real estate. But the latest session reveals an important difference between headline index strength and the actual breadth of the market.
The Nikkei 225 closed at 65,018.95, up 882.75 points or 1.38%, extending its winning streak to three sessions. Over 12 months, the index is up around 44.34%, while the one-month performance remains slightly negative at -0.47%. The Topix, ho
post-image
🚨 HBAR Big.... Alert 🤯 I'm going long here‼️‼️‼️👇Entry: 0.08737Stop loss: 0.08405Take profit 1: 0.08969Take profit 2: 0.09201Take profit 3: 0.09433Click here to trade👇⬆️⬆️ Go long.. Join me...👇⬆️ $HBA
post-image
HBAR+5.08%
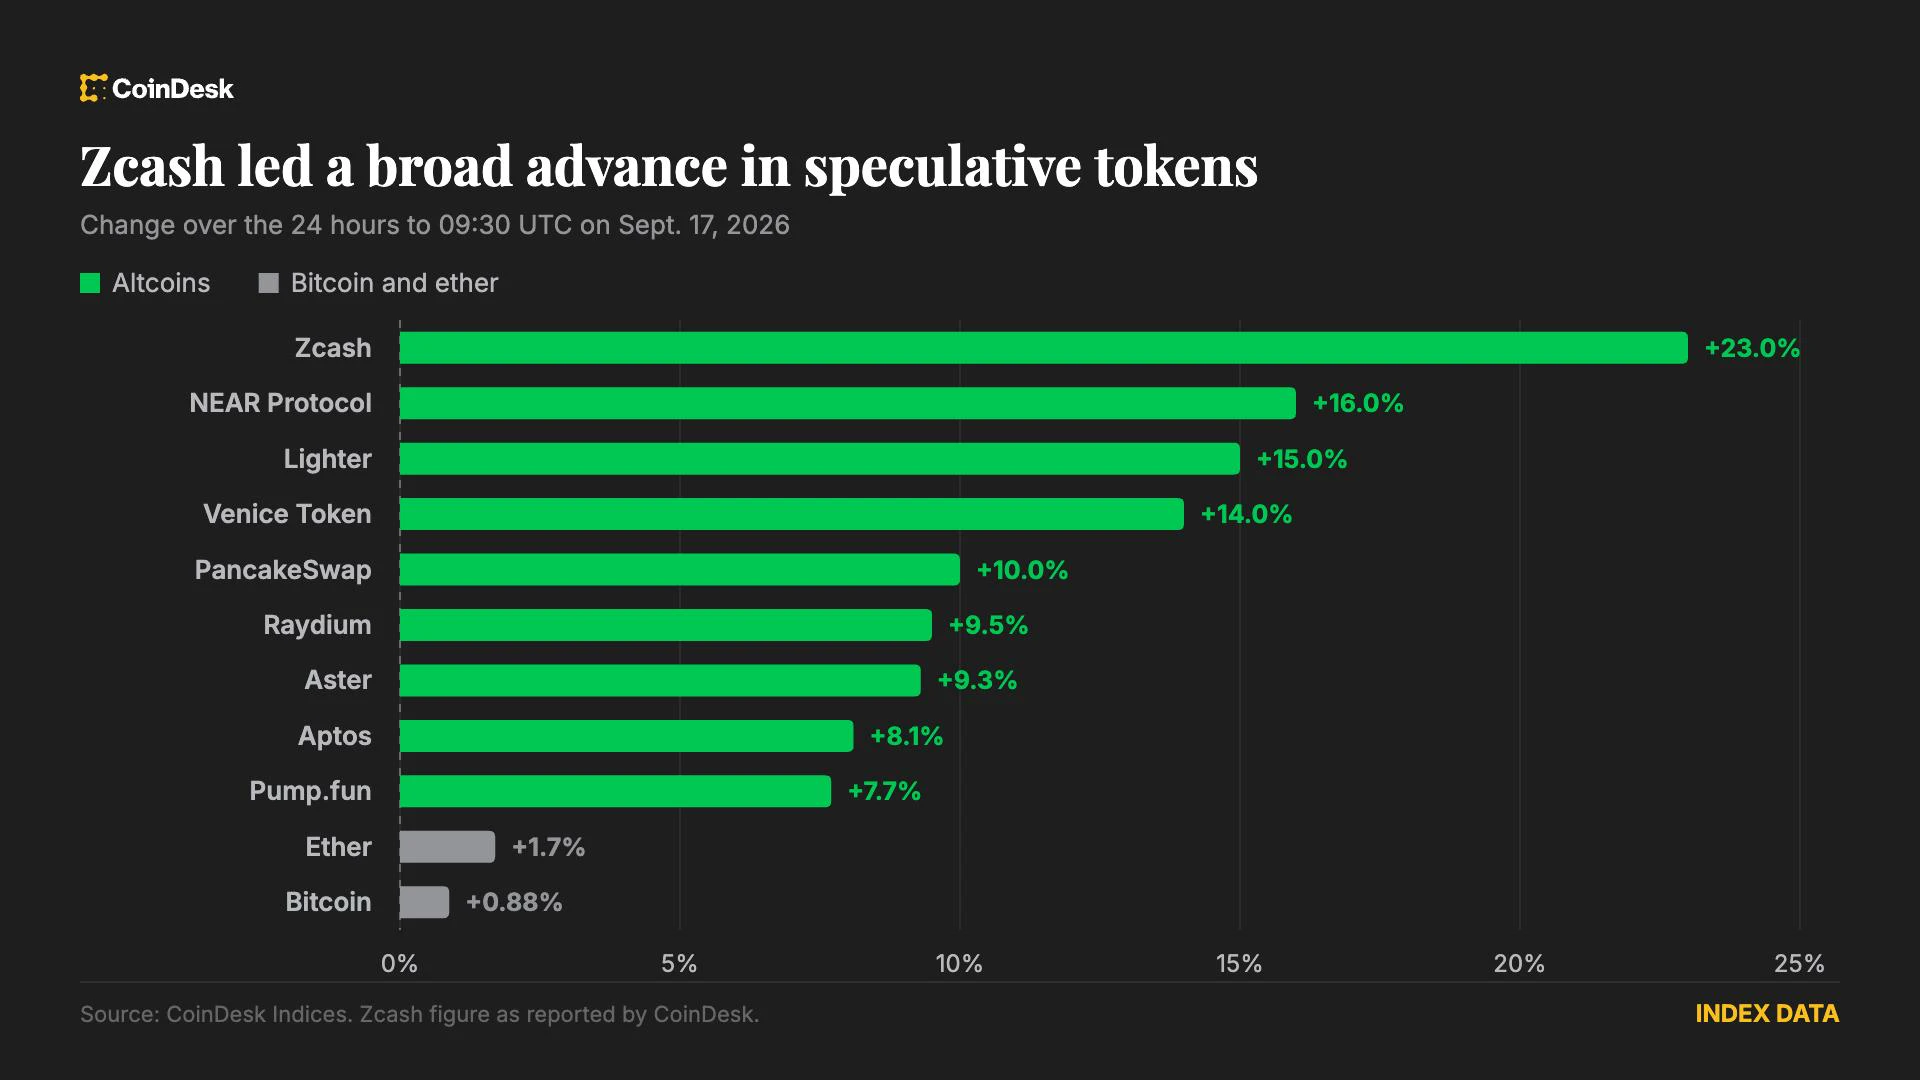
INTEREST RATES ARE RISING BUT THE BULLS REFUSE TO STEP ASIDE. Central bank policy updates usually bring fear to traditional markets, yet the digital asset space is shrugging it off with impressive price action. Let us see how the weekend volatility plays out for major tokens. - Leading asset $BTC pushed higher to $76,621 as investors digested the economic outlook. - Privacy token $ZEC printed a massive 23 percent rally after a major fund disclosed their investment stake. - Volume indicators suggest traders are actively positioning themselves for the next leg. Wild times to be trading this mark
post-image
BTC-0.76%
ZEC-3.96%
  • 6
  • 1
JUST IN: Fed’s Kashkari says inflation remains too high and not just driven by oil, reaffirming the Fed’s 2% path. This keeps pressure on rate expectations and macro risk sentiment for crypto markets. $BTC $ETH
post-image
BTC-0.76%
ETH-1.05%
$8 trillion in U.S. debt needs to be rolled over within a year. If the average coupon rises from 3.3% to the current 5%, that alone would add $136 billion in interest costs. Warsh understands the situation: the U.S. truly cannot withstand higher interest rates. Rate cuts are not a matter of whether it wants to cut, but whether it can afford not to. What do you think? If you’re watching the dollar, follow me.
post-image
AVAX surges 50% in four days and hits the trending list: I’m watching for a pullback here, not chasing
Wow, $AVAX itself has climbed onto CoinGecko’s trending list. I’m bullish at this level—up 50% in four days to 11.271, with 24h volume at 141 million USDT, 6.2 times the 30-day average.
My view: the bullish trend remains intact, but RSI at 79.2 is clearly overbought. I wouldn’t chase here; I’d buy the dip on a pullback.
Bullish rationale: first, the momentum isn’t over yet—MACD’s bullish crossover above the zero line is only one day old, and MA7 has crossed above MA30 on its first day; secon
AVAX+15.54%
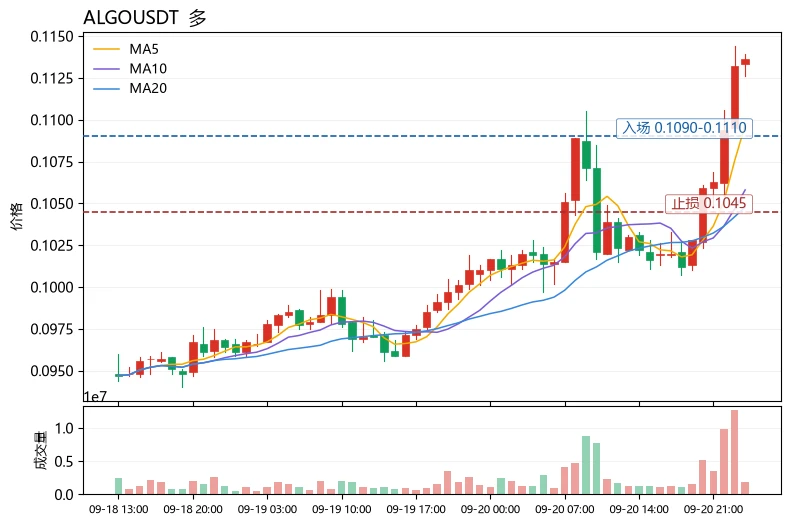
$ALGO The most unusual point today: it rose 12.47% over 24h, and the price of 0.1136 is already above the Bollinger upper band at 0.112318, yet the MACD histogram is only +0.0009673—the price increase and momentum histogram are severely mismatched, a typical “price leads, indicator lags” structure.
Technical breakdown: MA5=0.10968 has crossed above MA20=0.104775, confirming a bullish short-term moving average alignment, with no issue regarding trend direction; however, RSI=75.6 has entered overbought territory, and the price is hugging/breaking above the Bollinger upper band, signaling overhea
post-image
ALGO+10.53%
ZRO-3.15%
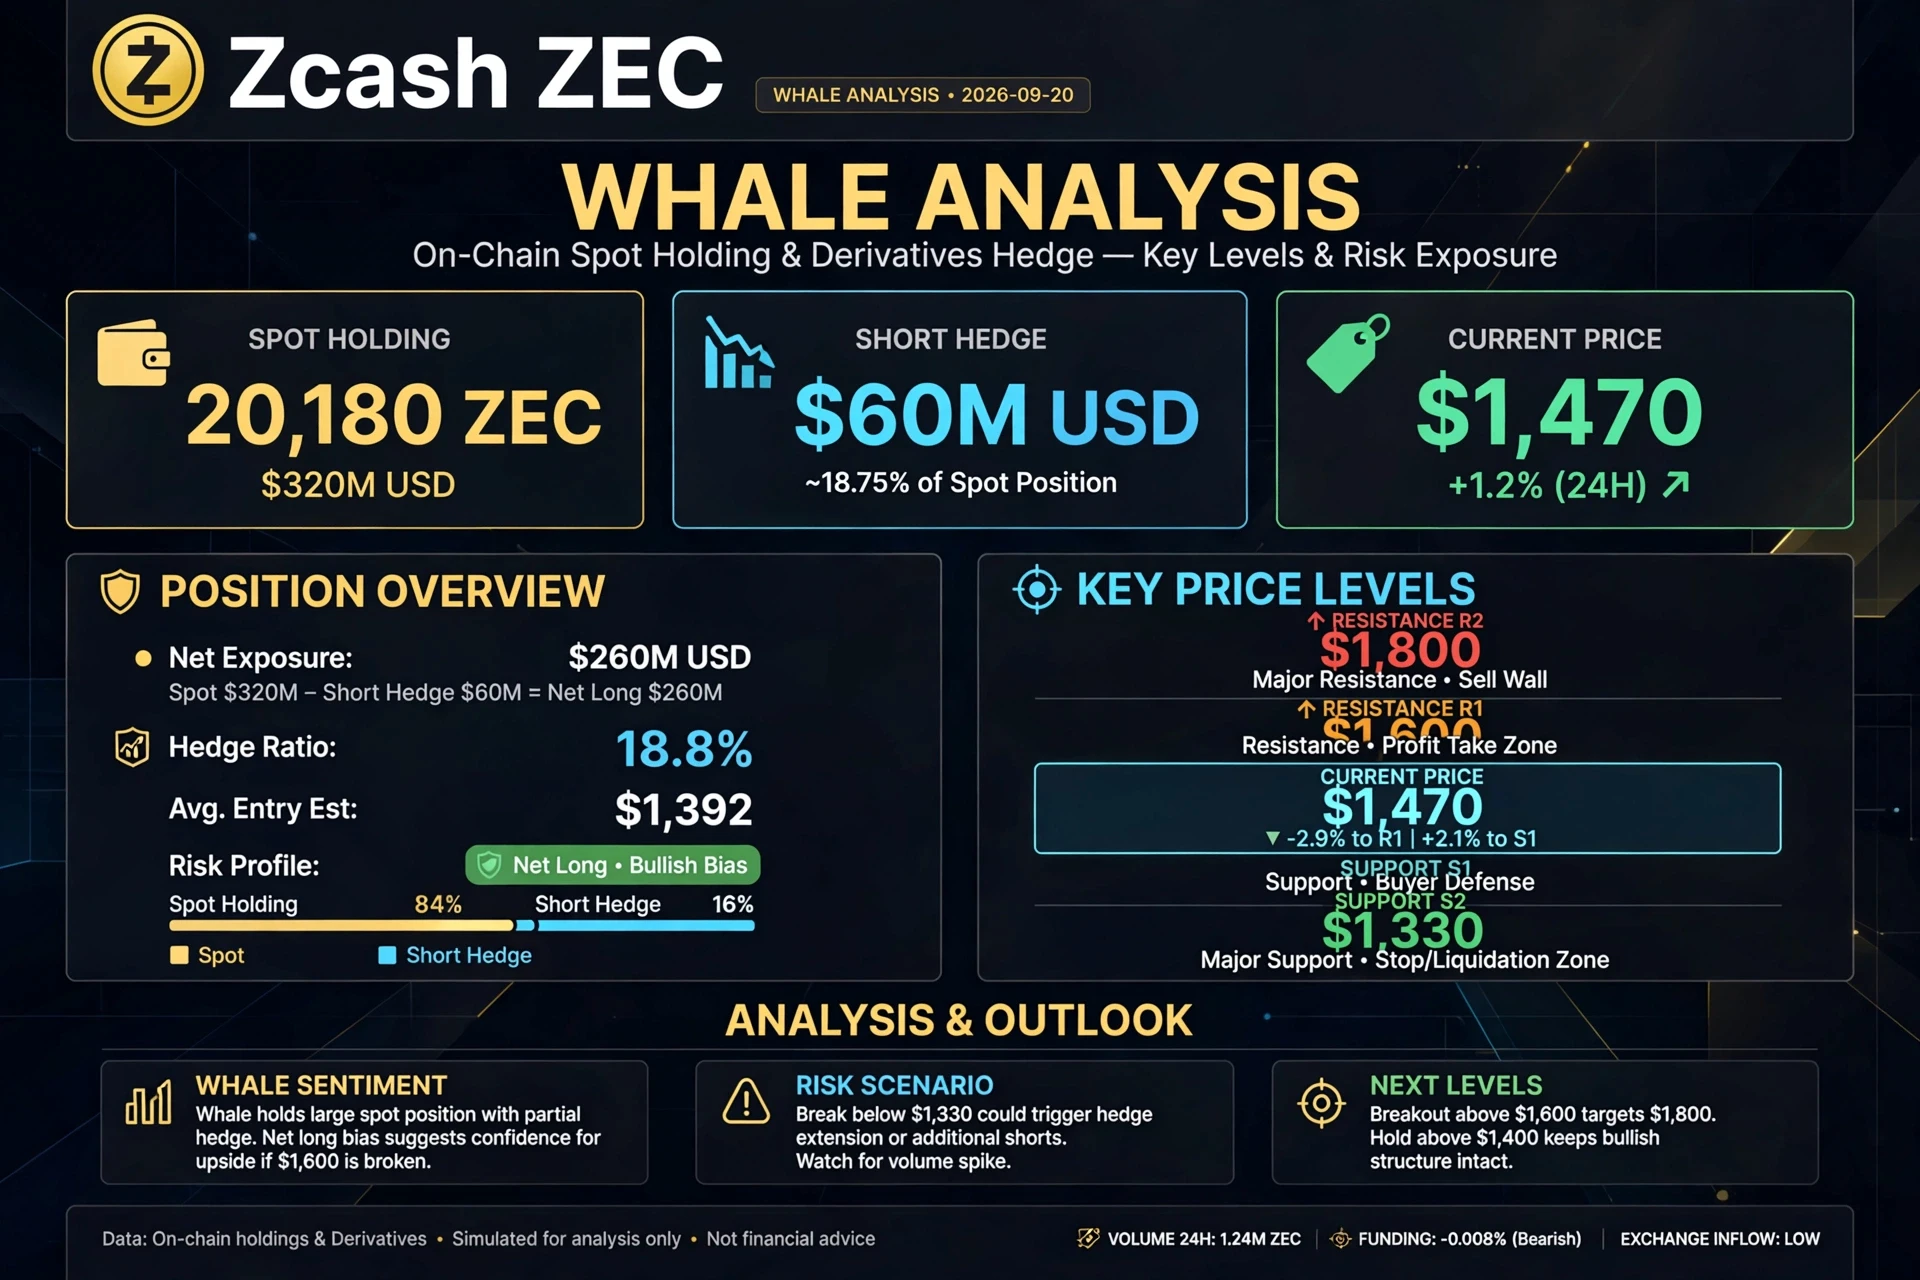
#GarrettJinHolds320MInZEC #GateSquareMidAutumnReunion
Garrett Jin is reportedly holding approximately $320 million worth of Zcash (ZEC), making this one of the most notable whale positions currently attracting attention in the ZEC market. According to Gate News, the tracked holdings amount to around 202,080 ZEC at a reference price of approximately $1,580 per coin no. This combination is important because it shows that the headline is not simply about a massive bullish spot position; the reported wallet structure also includes a hedge through derivatives.
My understanding of this news is that
post-image
Fun, the original image is in Figure 4.
  • 2
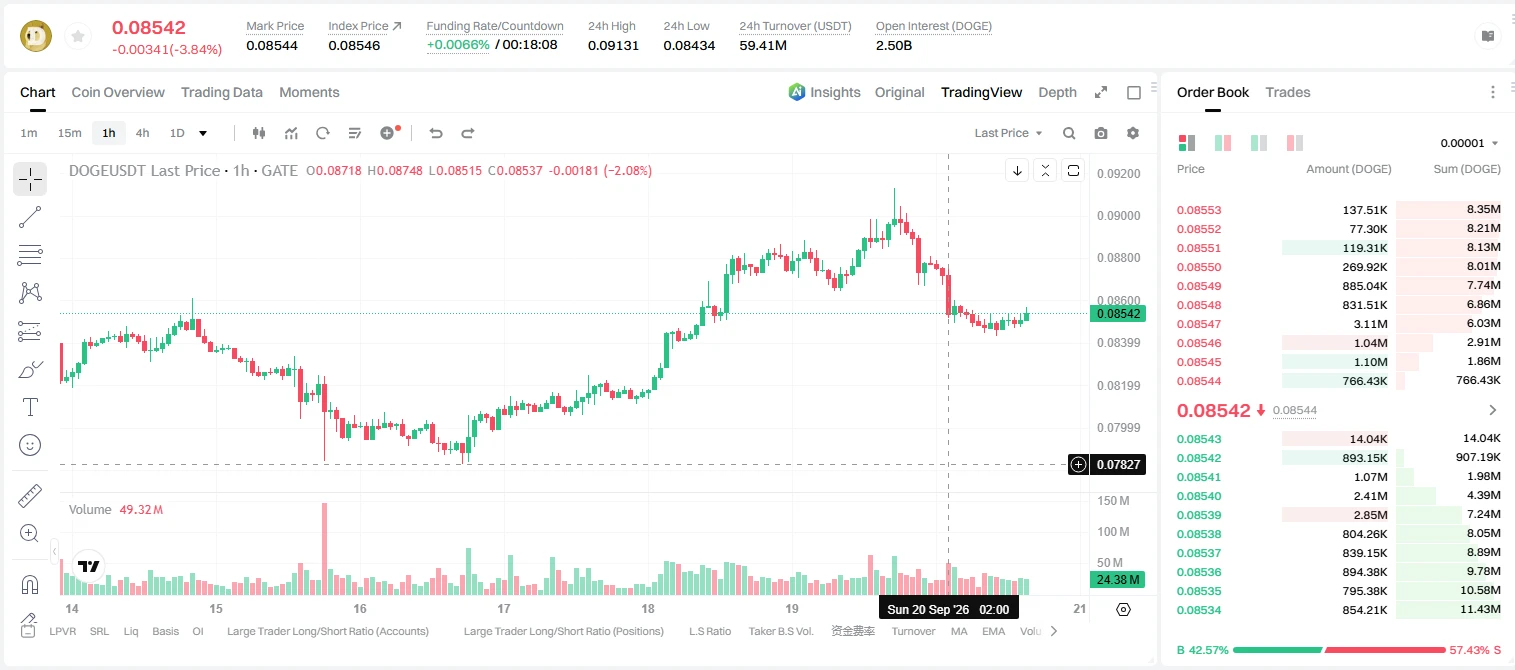
Insiders are quietly pressing SHORT on SYMBOL while the 1h price clings to 0.08547.

$DOGE /USDT - SHORT

Trade Plan:
Entry: 0.08526 – 0.08568
SL: 0.08745
TP1: 0.08399
TP2: 0.08299
TP3: 0.08151

Why this setup?
Why now? The 1h price sits at 0.08546, barely above the entry zone low of 0.08526, while the 1h ATR of 0.000825 shows enough volatility to reach TP1 at 0.08399 and TP2 at 0.08299 if momentum shifts. The 15m RSI at 56.96 is not overbought, so a short bias remains valid inside a daily range. The invalidation level of 0.08564 is the line in the sand that protects the trade.

Debate:
Ar
post-image
DOGE-3.02%
Everyone watching BTC right now is about to miss a massive move

$BTC /USDT - LONG

Trade Plan:
Entry: 81059.0 – 81211.6
SL: 80403.1
TP1: 81684.5
TP2: 82050.6
TP3: 82599.7

Why this setup?
Why now? The daily trend is firmly bullish, setting the stage for a continuation play. The 1h ATR of 305.084005 indicates volatility is expanding, which often precedes a sharp directional shift. The 15m RSI sitting at 68.13 shows momentum is strong but not yet overbought, leaving room for further upside. The entry zone between 81059.0 and 81211.6 offers a precise risk-defined opportunity, while TP1 at 816
BTC-0.79%
Load More

Join 40 M users in our growing community

⚡️ Join 40 M users in the crypto craze discussion

💬 Engage with your favorite top creators

👍 See what interests you

Trending Topics

MSTRTopsNasdaq100

74.15k Views2.99k Discussing

Strategy (MSTR) has gained about 48% over the past month, making it the best-performing stock in the Nasdaq 100, while Bitcoin rose roughly 12% over the same period. The company holds 845,050 BTC with a cumulative cost basis of about $63.73B. MSTR is not a pure Bitcoin proxy — its price swings can be more extreme. Can this rally last?

Gate Tops 24H Net Inflows Among Exchanges

26.46k Views3.69k Discussing

BTCRetakes80K

57.24k Views60.58k Discussing

View More