
Share your thoughts
placeholder
Article
I did nothing—just went to the restroom, and when I came back, the candlesticks had already done the work for me.

I had been watching $ZEC for quite a while as it formed a bottom during the session. It held the range without breaking down, money was quietly flowing in, and the volume looked unusual—yeah, the kind of prelude to a pump. I opened a long directly around 833.19, without the slightest hesitation.

When I checked the chart after lunch, the price had shot straight up to 1207.95, and the account balance was jumping faster than my heartbeat. This trade felt great, with +3192.49% secu
post-image
ZEC+0.73%
BTC-0.75%
SNDK+0.19%
No action, no analysis, all sheer luck—this performance is embarrassing even to talk about. I opened the chart this morning and saw that the $HYPE long was already up +36.52%, with the current price at 83.635 and the entry price at 83.212. The numbers were right there, and everything looked pleasing.
Looking back at this trade: while everyone was still watching from the sidelines, the chart hadn’t fully taken off, but buyers stepped in every time it pulled back to a key level. My judgment was that the key level hadn’t broken and the short-term direction leaned bullish, so I entered along with
post-image
HYPE-1.52%
DOGE+0.20%
ADA+1.54%
Castle Opens Bitcoin Savings Stack to Individual Users With Flexible Dividend Conversion
Miami-based bitcoin fintech Castle announced on September 8 that it is opening its automated bitcoin financial stack to individual users for the first time, bringing its 12% annual yield product to personal accounts alongside a category-first feature: allowing customers to receive dividend income in bitcoin at any ratio they choose. The yield comes from STRC, Strategy's perpetual preferred stock, which Castle added earlier this year and currently pays a 12% annual dividend on a semi-monthly schedule. Holde
post-image
BTC-0.73%
STRC+0.22%
  • 6
$SIRIUS at ~$1.09M MC, with a previous peak around $4.3M on this chart.
The bounce off the lows caught my attention. $1.6M–$1.8M is the area to reclaim next for a more convincing recovery.
Vlad-inspired lore on Robinhood Chain is still an interesting story at this size. I like the comeback potential here, but buyers need to follow through.
post-image
For both long and short positions, let the orders complete the entire process in advance; once the orders end, do not use this strategy anymore. The long positions caught early at the bottom under Plan Two can be allocated according to Direction Two’s strategy. Reminder: Whenever any order’s profit exceeds 50% or 80%, 50% of the position should be closed early for profit-taking, and the stop-loss should be moved to the entry price. This is a practical habit.$ETH
Nice隔壁王叔
$ETH Order for a Subscription Post,
Please check it promptly at 🚨🚨🚨
(Ultimate Two-Way Contract Plan and Strategy)
ETH-0.15%
  • 7
No conviction, couldn't hold on—the profits on this move were paper-thin, but I loved every second of it. I originally only wanted to test the waters with a small position, but $SOL performed even better than I imagined. Each leg up looked more solid than the last, and I was so glued to the chart that I even forgot to drink water.
After lunch, when I checked the chart around midday, the price had pulled back to around 94.68. The pullback held, buying pressure kept strengthening, and I got that feeling—this was the time to get on board. I decisively opened a long position, but after posting it
post-image
SOL-0.27%
DOGE+0.20%
ETH-0.15%
Nobody is talking about the short setup forming right under your screen.

$XAU /USDT - SHORT

Trade Plan:
Entry: 4393.39 – 4400.73
SL: 4432.31
TP1: 4370.62
TP2: 4352.99
TP3: 4326.55

Why this setup?
Why now? The 1h price is sitting at 4396.93, which is practically identical to the entry reference of 4397.06, so the trigger is already on the chart. The daily trend is range-bound, which means a directional breakdown from this congestion is overdue and not a matter of if. The 15m RSI is at 45.4, showing just enough bearish lean to confirm that the recent bounce is losing steam without being ov
XAU-0.44%
SpaceX Stock Hits $153.35, Market Cap Recovers to $2.02 Trillion Since July 7
SpaceX shares rose 3.65% on September 8 to reach $153.350 per share, marking the highest level since July 7 and pushing the company's total market capitalization back above $2 trillion to $2.02 trillion. The recovery represents a significant milestone for Elon Musk's space exploration company, which had seen its market cap dip below $2 trillion in recent weeks. The stock has been on an upward trajectory, having gained 5.2% on September 3 to reach $147.995. The company's valuation surge reflects continued investor ent
post-image
SPCX+3.43%
  • 3
  • 1
A few days ago I was still calculating whether I had enough money for instant noodles this month; this morning I was already wondering whether to add sausage. 🍜

This move goes to the credit of $XAUT being weak. When it plunged intraday, I watched it rebound on shrinking volume and knew what was going on: insufficient buying support, a strong bull-trap vibe, and sellers waiting to dump into every rise. Without hesitation, I placed a short around 4486.7, with the initial target of taking out 4383 below. 💥

I just checked my position, and the return has reached +214.43%. Honestly, I didn't
post-image
XAUT-0.44%
XRP+2.43%
SNDK+0.19%
Just getting started on setting up camp.
Everything is fine!
🔥🐶🔥
post-image
$FERMI (per request)
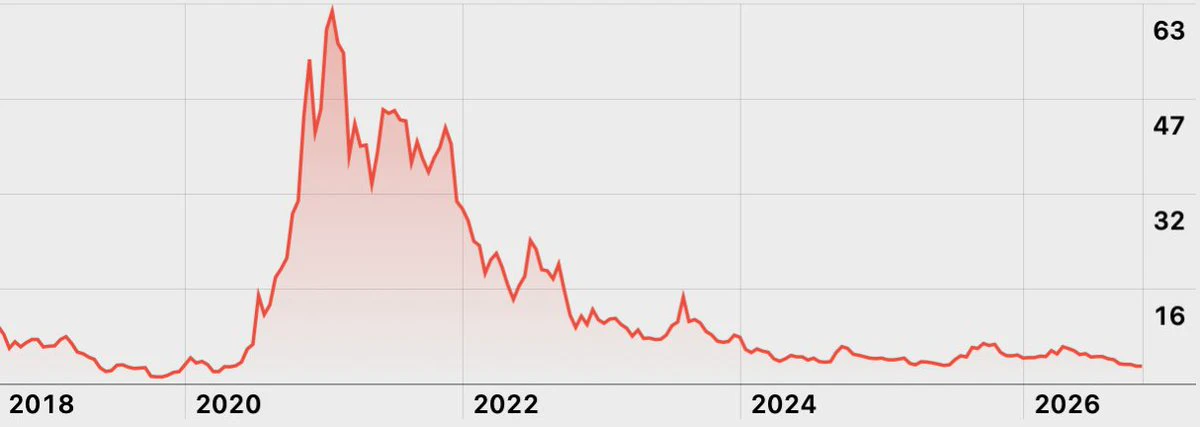
Interesting chart because it basically has to hold these lows to avoid oblivion.
Maybe a double bottom setting up here. Needs quite a few confirmations but the R:R here is nice if taking a stab otherwise can wait for confirmations. Worth checking the FA and adding to watch list.
post-image
I originally wanted to sell at a loss as a sacrifice to the heavens, but the sacrifice never happened—the meat roasted itself. While it was bottoming out intraday, I saw $GIGGLE pull back to around 37.85. The key level was rock-solid, as if welded shut, and buyers were quietly adding to their positions. I said right then: this level is worth a try. By the time it broke out, I realized 38.12 had already left the level I was watching far behind, with +35.65% in the bag. It felt amazing—everyone on board should be waking up smiling. Take 80% profit first and put the bulk in your pocket; move the
post-image
GIGGLE+1.17%
BNB+1.60%
ADA+1.54%
🚨🔥 HOT is TRADER LIVE | BTC BIG MOVE LOADING! ₿⚡ | BREAKOUT YA MASSIVE DUMP?
live-cover
LIVE1,510
Gold above 4380, take profits😄 Time to rest—we’ve exceeded today’s target. Rest up, brothers. If needed, we can place another trade later, haha.
post-image
  • 3
Smart money is quietly loading SYMBOL while retail panics over nothing.

$USELESS /USDT - LONG

Trade Plan:
Entry: 0.28078 – 0.29036
SL: 0.23958
TP1: 0.32007
TP2: 0.34306
TP3: 0.37756

Why this setup?
Why now? The daily trend is firmly bullish, setting the stage for a continuation move. The 1h ATR of 0.019164 tells us volatility is compressed enough for a sharp breakout. With the 15m RSI at 54.21, momentum is neutral, meaning a sudden spike will catch weak hands off guard. The entry zone between 0.28078 and 0.29036 provides a precise floor for a long position targeting 0.32007 and 0.34306.
USELESS+28.39%
Nobody is talking about this SYMBOL setup yet.

$HYPE /USDT - LONG

Trade Plan:
Entry: 84.07 – 84.51
SL: 82.18
TP1: 85.87
TP2: 86.92
TP3: 88.50

Why this setup?
Why now? The daily trend is bullish and the 1h price is sitting right at the entry zone of 84.29, which means momentum is stacked for a long. The 15m RSI at 58.62 shows room to run before overbought, while the 1h ATR of 0.877238 confirms enough volatility to reach the first target of 85.87 and push toward 86.92. The invalidation level at 83.52 is the hard line in the sand that protects this thesis.

Debate:
Are we hitting TP2 or ge
HYPE-1.52%
$SUI /USDT is building a range on the daily, and smart money is quietly setting up for a move that could erase 6% in hours.

$SUI /USDT - SHORT

Trade Plan:
Entry: 0.8189 – 0.8263
SL: 0.8579
TP1: 0.7961
TP2: 0.7785
TP3: 0.7520

Why this setup?
Why now? The 4h trend is range-bound, but the 1h RSI at 58.09 shows the short-term momentum is still leaning bearish enough to favor sellers over buyers. The 1h ATR of 0.014709 confirms that the average hourly pulse is wide enough to swallow the entry zone of 0.8189 to 0.8263 without struggling. If price pushes below the 1h price of 0.8226, the plan t
SUI+0.28%
Moving crypto isn't complicated.
Moving it safely is where attention matters
Before you deposit or withdraw, pause for a few seconds and verify:
→ Asset
→ Wallet address
→ Network
→ Amount
→ Fees
post-image
𝗕𝗧𝗖 𝗦𝗽𝗼𝘁 𝗘𝗧𝗙 𝗙𝗹𝗼𝘄𝘀 𝗥𝗲𝗺𝗮𝗶𝗻 𝗠𝗶𝘅𝗲𝗱
Spot Bitcoin ETF flows remain mixed, according to SoSoValue, while $BTC continues consolidating inside a tight $78,000–$80,000 range.
Many traders have been waiting for a deeper retracement for more than a week, hoping to find a better entry. So far, that pullback has not arrived.
The longer $BTC holds this range without a major breakdown, the more important the eventual breakout becomes. A move above $80K could strengthen bullish momentum, while losing $78K may open the door to a deeper correction.
#BTC #Bitcoin #BitcoinETF #CryptoMar
post-image
BTC-0.75%
  • 6
Load More

Join 40 M users in our growing community

⚡️ Join 40 M users in the crypto craze discussion

💬 Engage with your favorite top creators

👍 See what interests you