
Square
Following
Hot
News
Notifications
Profile
Share your thoughts
placeholder
Article
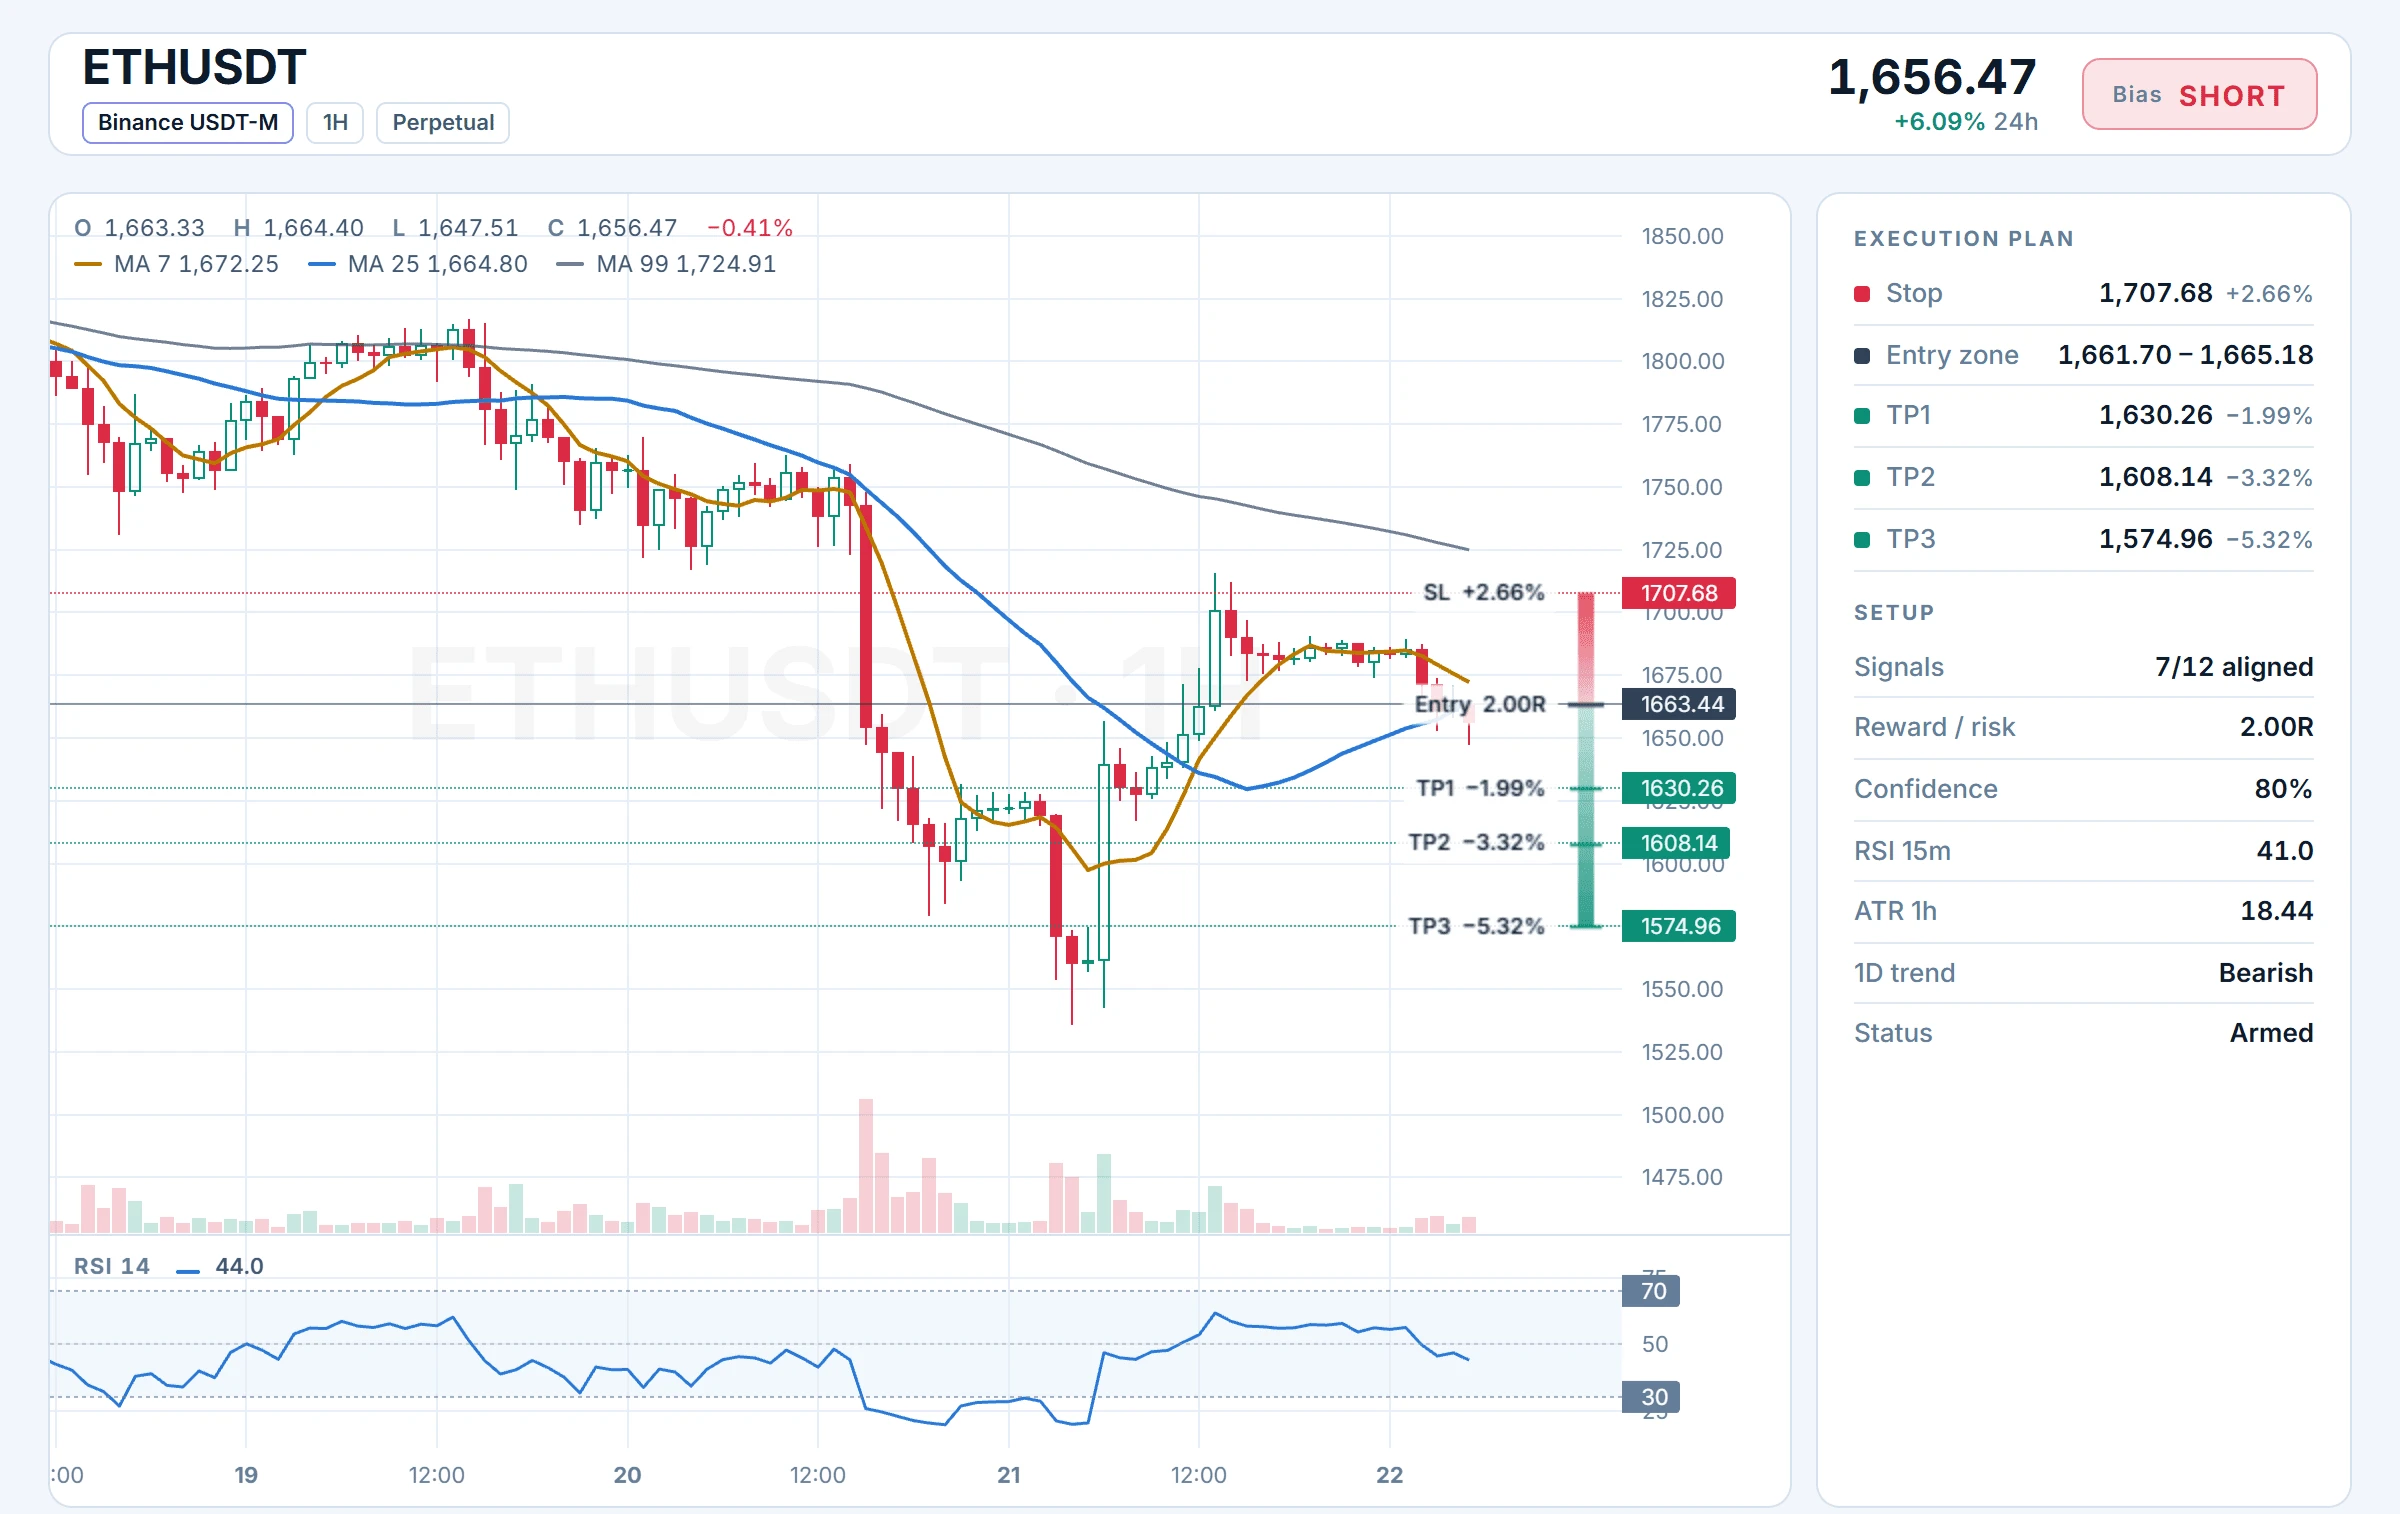
$ETH /USDT SHORT SETUP HIGH CONFIDENCE REJECTION

$ETH /USDT

Direction: SHORT

Entry Zone: 1,661.70 – 1,665.18

Stop Loss: 1,707.68

Targets
TP1: 1,630.26
TP2: 1,608.14
TP3: 1,574.96

$ETH ‌
post-image
ETH-1.23%
gSunday chat <3
Back tomorrow.
post-image
Trenches
IDOL
I
bade
b
IDOL
0x3b...ab07
Market Cap
$.
Change
.
24h Vol
$.
Holders
.
JAGENT
J
bade
b
JAGENT
0x8e...ae15
Market Cap
$.
Change
.
24h Vol
$.
Holders
.
PIEVERSE
P
bade
b
PIEVERSE
0x0e...25a9
Market Cap
$.
Change
.
24h Vol
$.
Holders
.
CLAUDIA
C
bade
b
CLAUDIA
2j5S...W2ZM
Market Cap
$.
Change
.
24h Vol
$.
Holders
.
FIONA
F
bade
b
FIONA
B34n...pump
Market Cap
$.
Change
.
24h Vol
$.
Holders
.
Another pleasant weekend is about to end. Just thinking about the market opening again tomorrow instantly takes away half the relaxation. Open this latest liquidation heatmap: before the market opens tomorrow, the big players’ playbook is already laid out in plain sight. Don’t charge in foolishly!

$BTC The current price is 59750, stuck awkwardly in the middle. Looking up, the green glow around 61000 is glaring—short positions are lined up there. But look further down: between 58500 and 59000, long positions are piled up as thick as a fortress wall. What does that mean? The big players have pl
BTC-0.65%
ETH-1.23%
SOL-0.74%
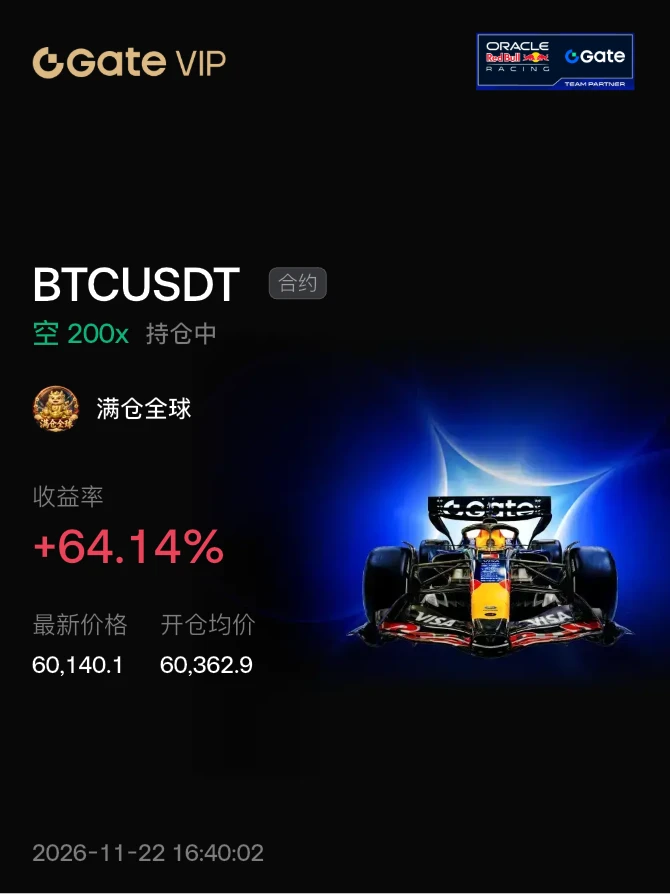
#晒出我的持仓收益 BTC, go to the moon! Live now
post-image
BTC-0.65%
🔹 BNB Surpasses 540 USDT with a Narrowed 4.43 Decrease in 24 Hours
live-cover
LIVE1,458
SPCX-7.38%
TSLA-7.56%
NVDA-13.84%
If you slept through the weekend, Bitcoin looks like it barely moved.
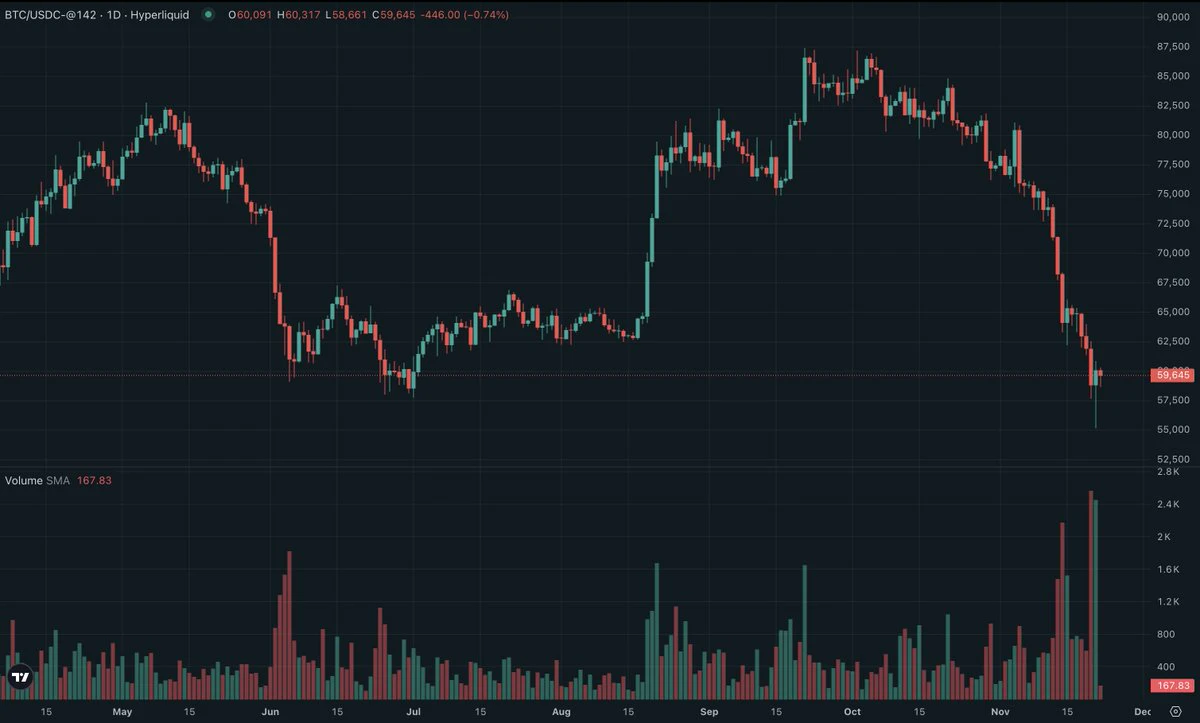
In between, it dropped to around $55K and took about $2B of longs with it, then bounced back near $60K and wiped out a few hundred million in shorts on the way up.
The chart looks calm now, which is funny considering what it did to everyone who was trading it.
post-image
BTC-0.65%
BITCOIN Falls below 5,7000k
live-cover
LIVE4,549
BTC-0.67%
$EVAA Bro took a quick bite and left; you guys can keep shorting at your leisure
post-image
EVAA-0.49%
#BTC The candles aren't cooperating! Happy weekend! A little bite works too! We'll keep grinding away at it on the livestream tonight
post-image
BTC-0.67%
Subscribe to Solo Walks the World, BTC short entered precisely at 61320; now set a breakeven stop loss
post-image
BTC-0.65%
  • 1
  • 1
You can start building your positions in batches, folks. For value coins, look at $HYPE for buybacks, $LINK for reserves, and $UNI for burns 🫰#BTC反弹后再争6万美元关口
post-image
HYPE+0.33%
LINK-0.19%
UNI+3.13%
  • 1
$SOXLB Today's gain is 7.79%, but the one-hour chart looks strong while the four-hour chart looks weak, giving completely contradictory signals. The one-hour RSI has reached 63.59, while the four-hour RSI is at 20.88, in oversold territory. This divergence between the short-term and longer-term charts has left the market outlook unclear.
I’d rather view this as a direction that hasn’t been confirmed yet than rush to call it a rebound or a pullback. The current price is 33.91, already in oversold territory. Let’s wait for a confirmed bounce before drawing conclusions; covering shorts now means
post-image
Wrapped Monero Token Crashes 99% After $13M Hack Blamed on Web Host
A wrapped Monero token on Hyperliquid collapsed by more than 99% in roughly half an hour Friday after an attacker drained the deployer wallet and dumped about 364,000 tokens across 388 addresses for $13.5 million, according to an analysis by onchain data firm Bitquery.
XMR1, issued by cross-chain swap service Wagyu, represents Monero on Hyperliquid. The token plunged from about $500 to around $1 in the sell-off. The deployer account sent 5.2 million XMR1 to a newly created account early Friday, then the attacker sold the token
post-image
XMR+0.00%
HYPE+0.24%
ETH-1.26%
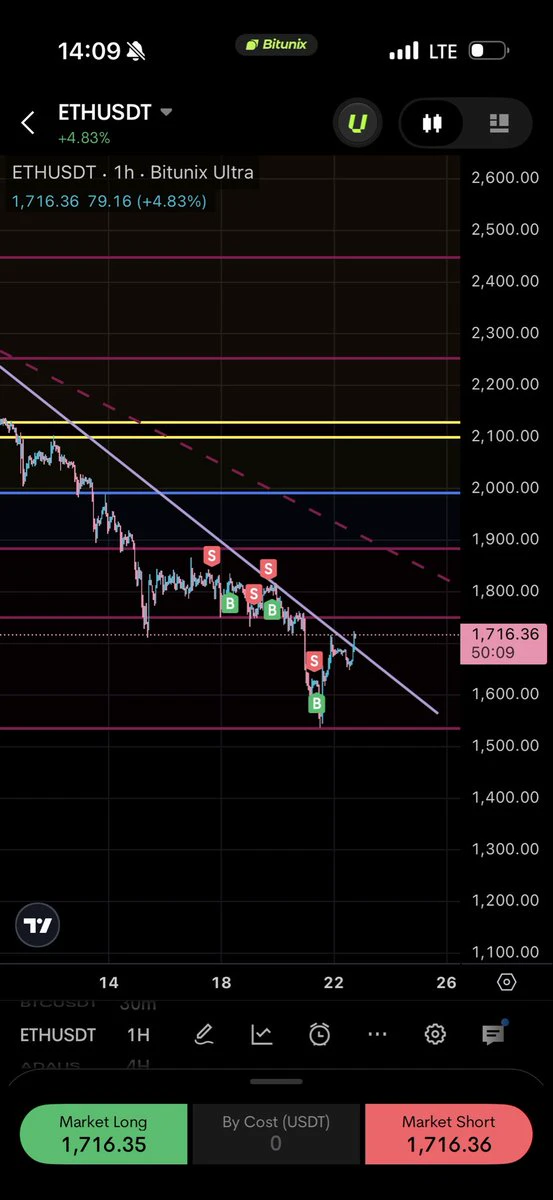
GMM 🫶🏽 just woke up to a potential little pump up to 2k on ETH, just gonna wait for confirmation, this is no entry yet, it might be a fake out we gonna see in a few hours
post-image
ETH-1.26%
$PIEVERSE Set up a big short now—thank me later. Stop-loss: $4.29. Take profit: $3.9. Short $PIEVERSE now 👇
post-image
PIEVERSE+0.58%
  • 6
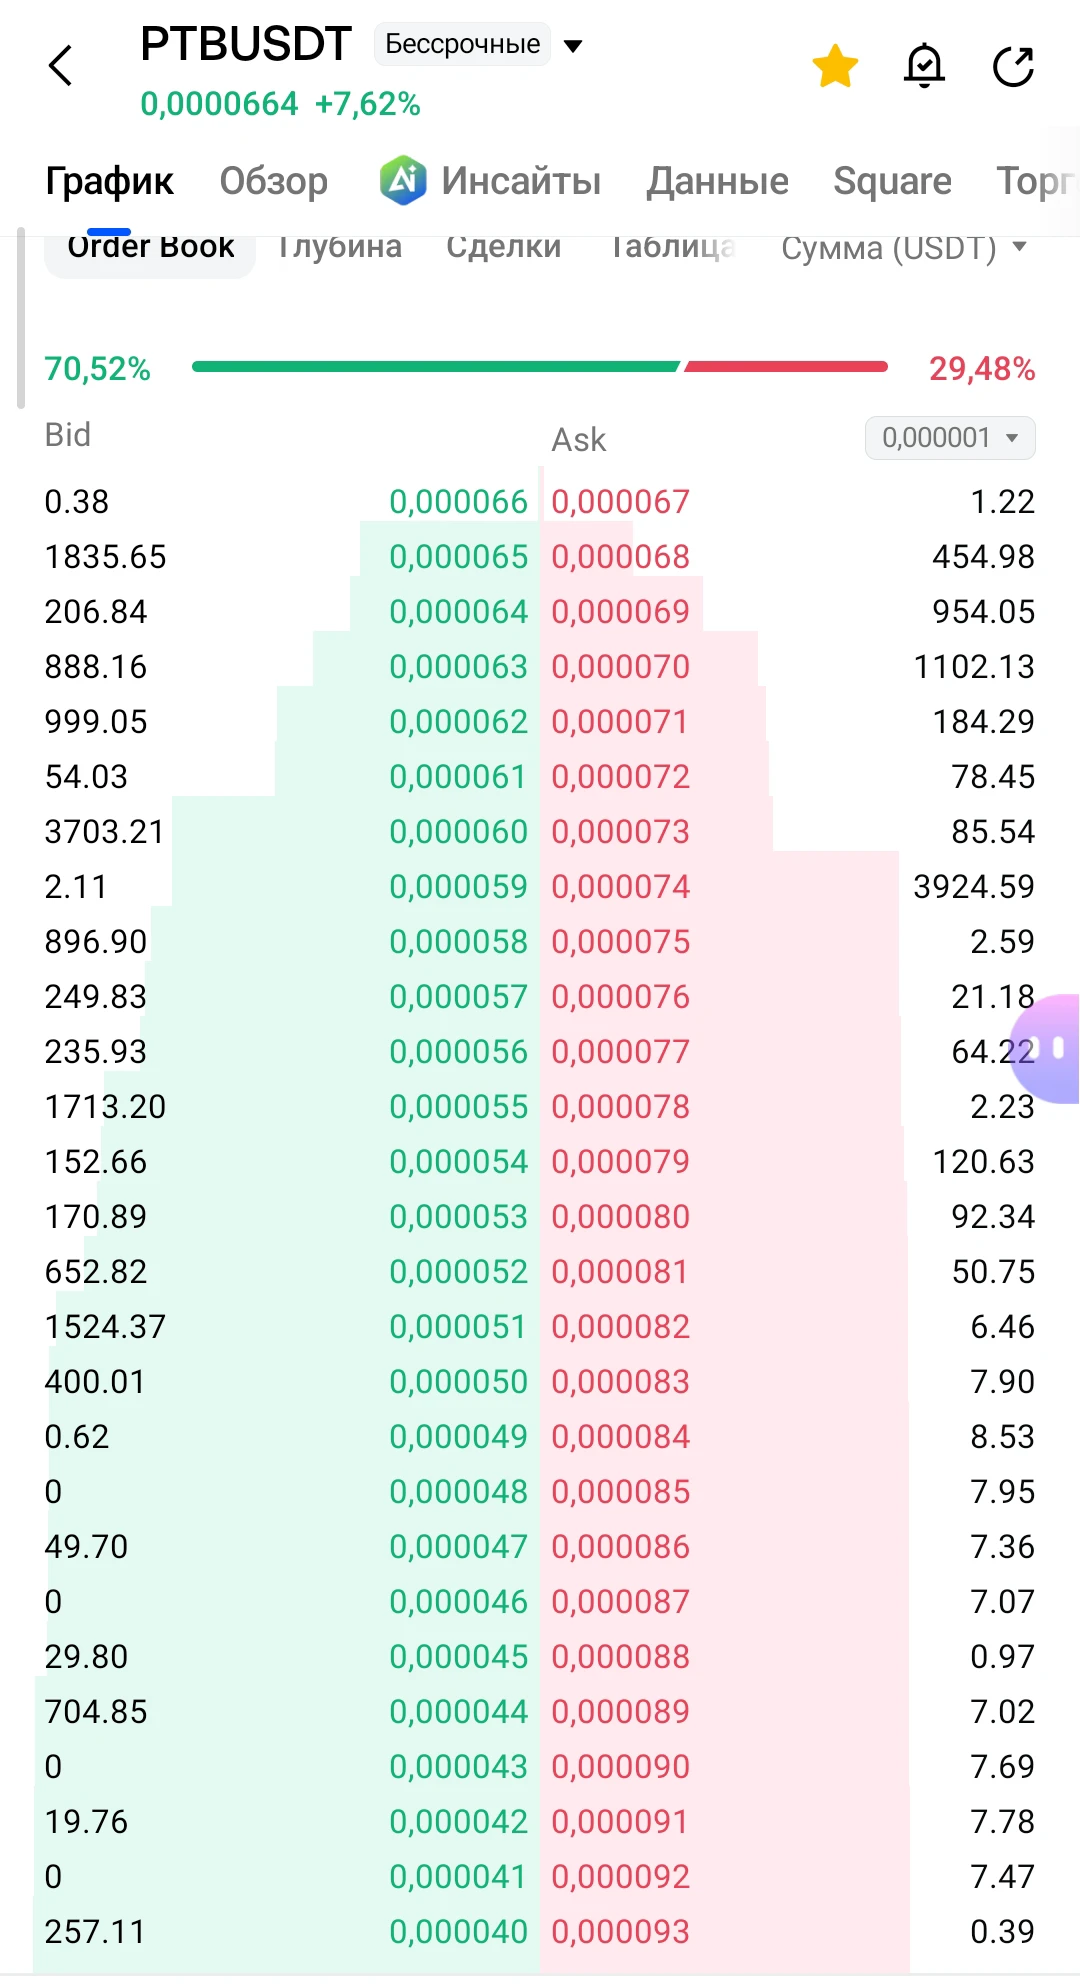
$PTB At 0.000048, there's a buy order with zero; this bot is going crazy during altseason. And at 0.000066 and 67, there's as much as a dollar of liquidity.
post-image
PTB-12.55%
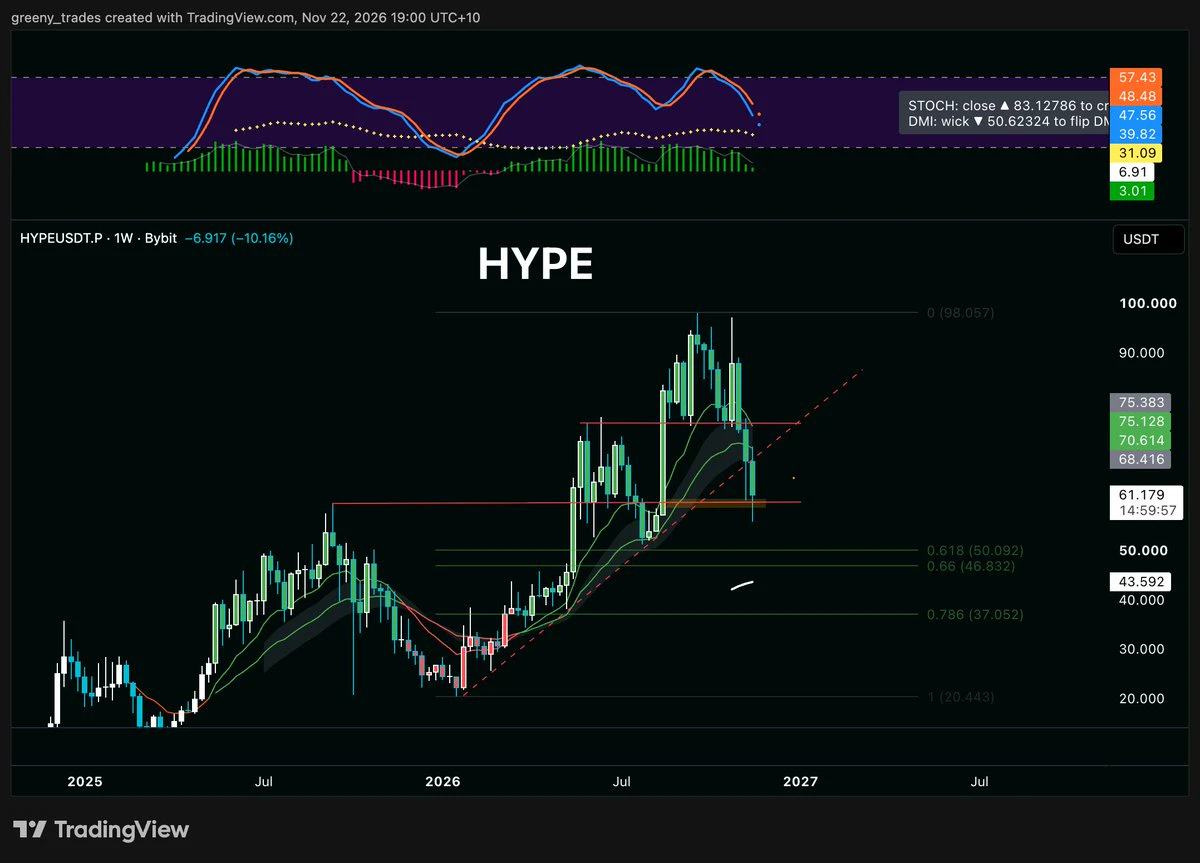
Would you buy this chart?
When I look at $HYPE , I look at a potential structural shift for the first time since late 2025. Whilst we maintain a higher low currently, we have lost support, emas and the larger trend.
They are dominating on chain, they have for years, it's one of the only tokens to truly outperform Bitcoin year on year, but will we see lower before higher?
post-image
HYPE+0.24%
BTC-0.67%
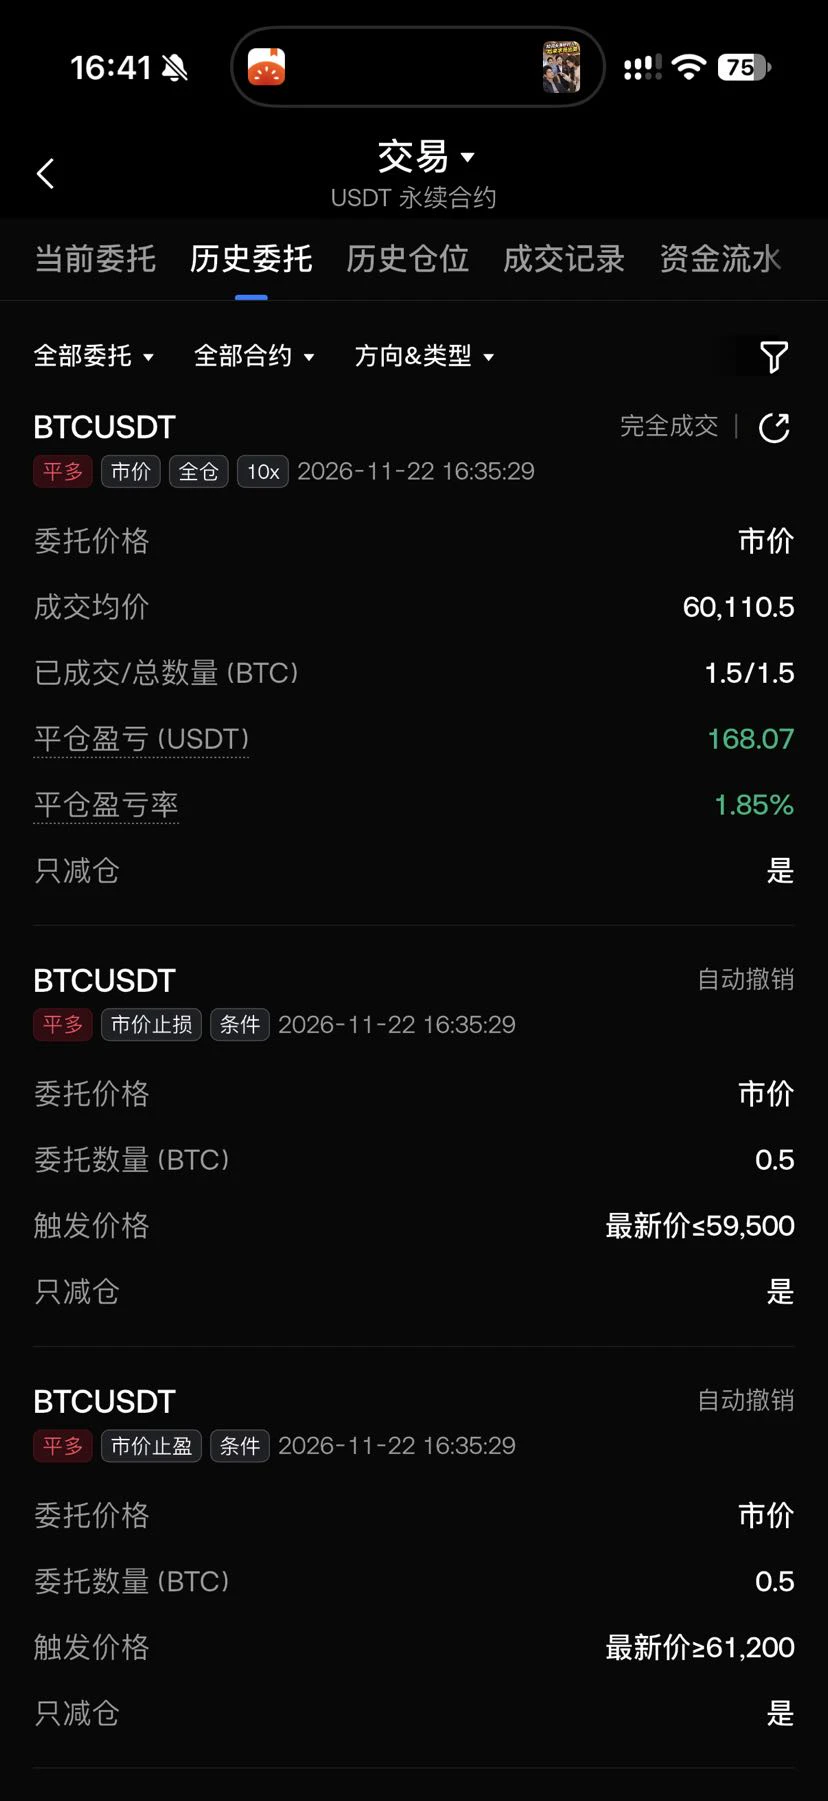
330U Copy Ao Ying Capital | Day 46 · Evening Report

Good evening, one last look at today's results before calling it a day.
These are copied positions, not Ao Ying himself—please use your judgment (^v^)
Starting capital: 330U; return: 211.15%; current capital: 626.80U. (400U has been withdrawn during this period)

Just a quick update today:

Currently holding one BTC long position.
This trade is finally in profit; Ao Ying hasn't exited yet, so let's see how it goes.

📊 Today's recap: capital 614.66U → 626.80U, floating PnL +12.14U

See you tomorrow! 🦅
post-image
BTC-0.65%
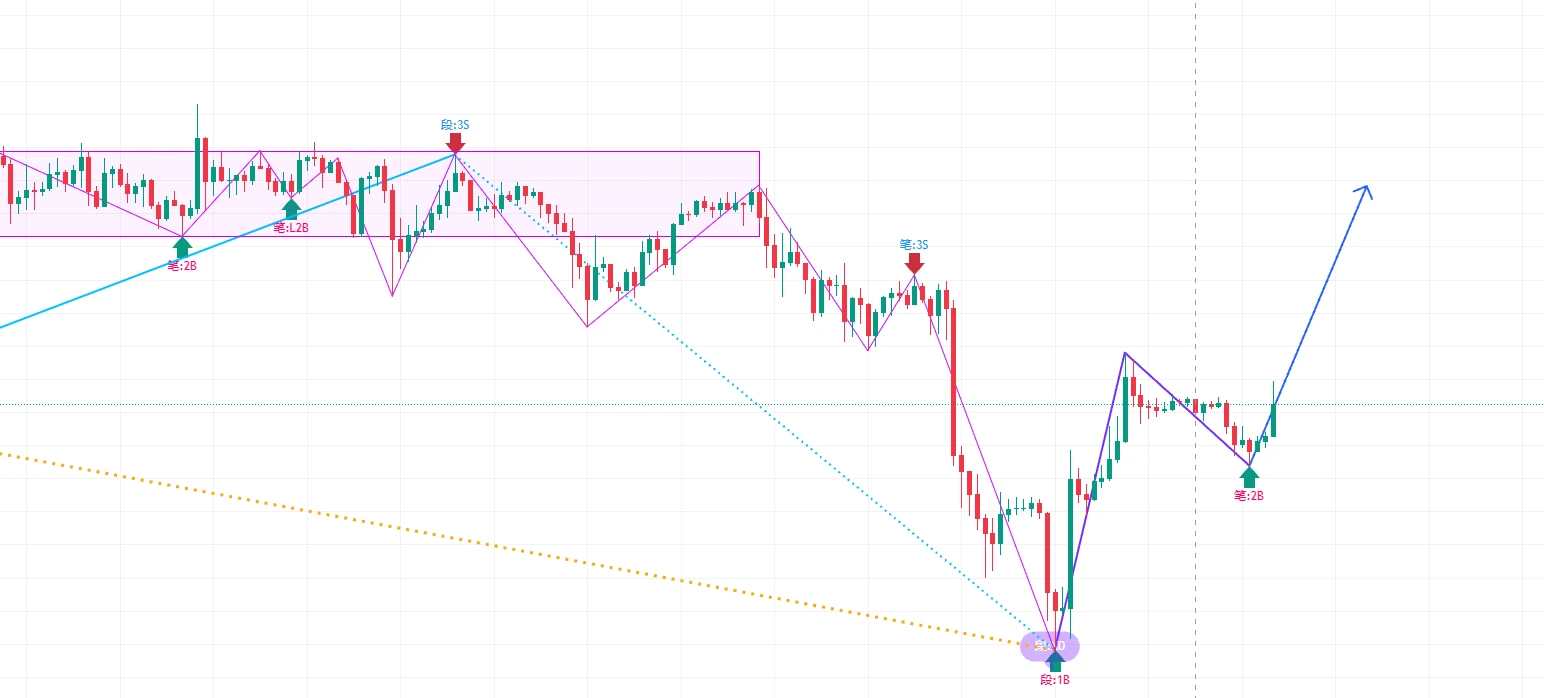
How will the market move from here?
First, let's review the decline in this cycle
1、$BTC This cycle fell from a high of 87,000 to a low of 55,000, a decline of 36.92%
2、$ETH This cycle fell from a high of 2,800 to a low of 1,536, a decline of 45.27%
3、From 80k to 50k, even low-leverage positions couldn't withstand it
4、Liquidity below has also been largely wiped out
Conclusion:
1、A decent rebound is highly likely here
2、You can hold off on going long for now, but be very cautious about shorting—at the very least, don't short now
3、It's highly likely to continue pushing higher and trigger stop
post-image
BTC-0.67%
ETH-1.26%
  • 2
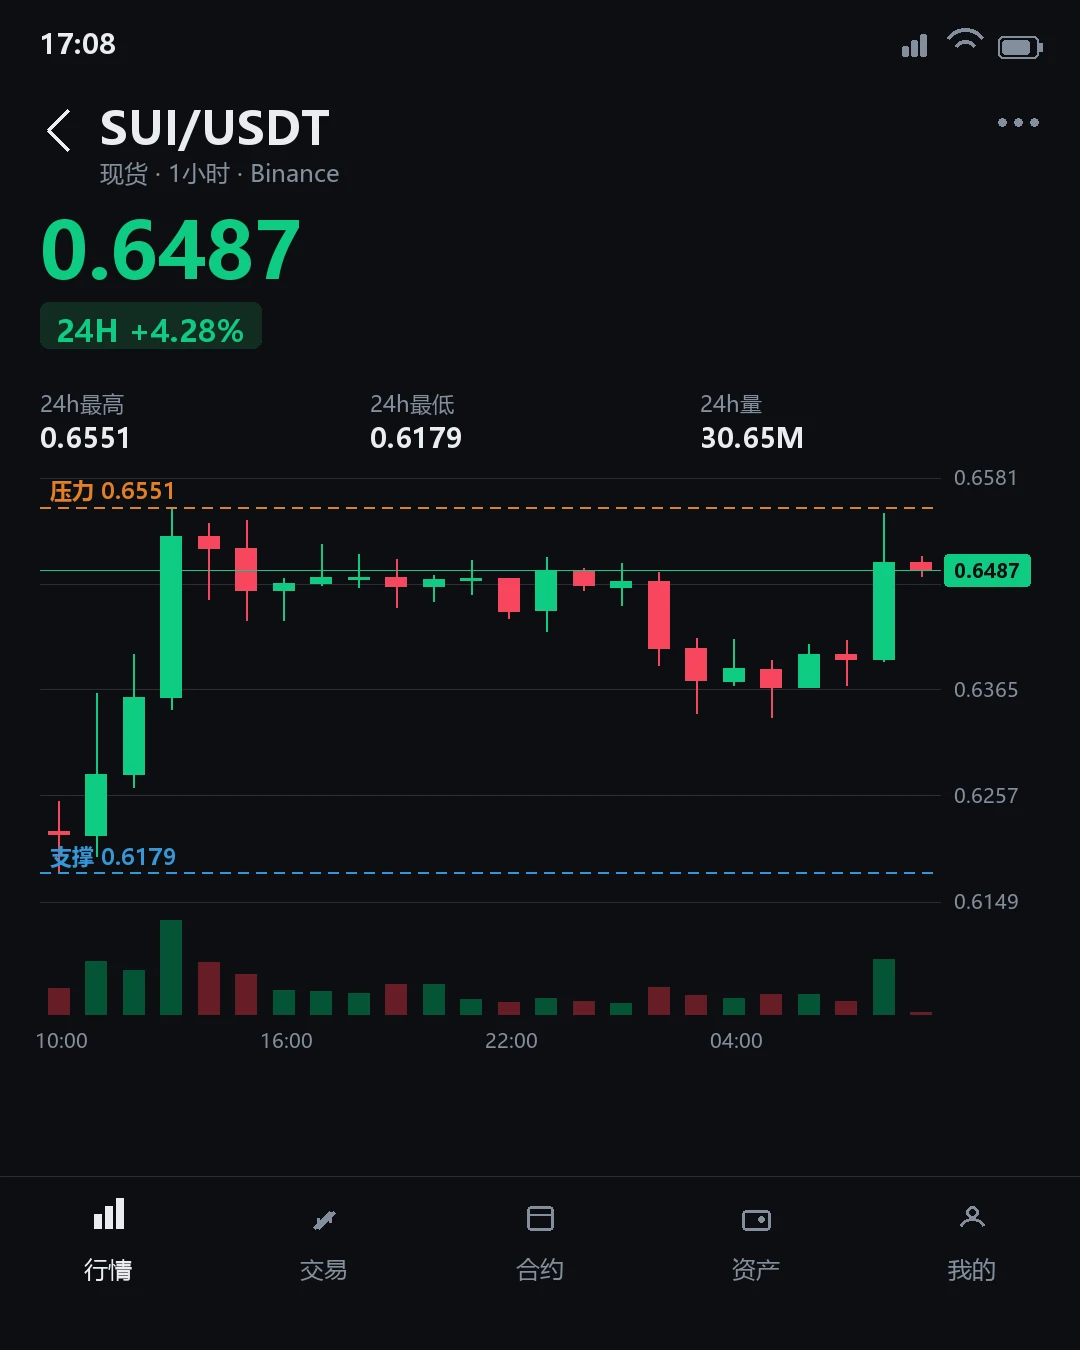
$SUI The current price is 0.6487, up 5.21% over 24 hours. However, the 1-hour timeframe looks strong, while the 4-hour timeframe looks weak, with a clear divergence in direction. The 1-hour RSI is 52.11, while the 4-hour RSI is 35.0, with the two indicators giving different signals. The 1-hour EMA20 is 0.64317957, and the 4-hour EMA20 is 0.6630903; the price is currently between them. This divergence means the price may still be looking for direction. When the 1-hour and 4-hour timeframes align will be a key confirmation point.
I’ll wait here and let the price choose a direction. I’ll follow w
post-image
SUI-1.05%
Load More

Join 40 M users in our growing community

⚡️ Join 40 M users in the crypto craze discussion

💬 Engage with your favorite top creators

👍 See what interests you

Trending Topics

BTCReboundFaces60KTest

2.1M Views30.1K Discussing

BTC rebounded from around $55,300 on November 21, briefly reclaiming $60,000 before pulling back to around $59,300. The $60K level is back in focus as traders assess whether the recovery can last. Is this rebound a sign of stabilization or a short-lived recovery? Would reclaiming and holding $60K be enough, or do you need confirmation from trading volume and fund flows?

PCEAndGDPDataNextWeek

258.8K Views2.6K Discussing

GateDirectIPOPhase3ANTAllocates92100Shares

826.4K Views5K Discussing

View More