
Share your thoughts
placeholder
Article
I want to DCA, but maybe I should wait for now since the Greed index is still at 73.
post-image
#SNDK
SanDisk (SNDK) has just delivered a powerful breakout, closing the latest U.S. session at 1,739.88, up approximately 11.9% in a single day. That means the stock added nearly 185 points from the previous close of 1,555. The session range was 1,582–1,740, and price finished almost exactly at the high, while trading volume was around twice the normal level. This combination of price expansion, volume and a close near the high makes the breakout technically significant.
The bigger picture is even more interesting. SNDK had fallen from its June all-time high near 2,354 and eventually found a
post-image
SNDK+11.88%
  • 6
#Gate事件合约晒单挑战 Continue betting that the Fed will not hike rates in September.
Logic and reasons

Current situation: After Warsh's hawkish Jackson Hole speech on August 28, the probability of a September rate hike briefly surged to 65-68%; after Waller publicly questioned the hawkish tone on September 4, it fell back to 50%; today, August nonfarm payrolls came in at 162k, well above expectations of 55k, and the probability of a rate hike rose again to around 57%. So "betting on no hike" is currently a bet against the market direction—the market has tilted slightly toward a hike, but is far fr
post-image
Politics
Fed Decision in September?
25 bps increase
52%1.92x
No change
49%2.04x
$9.58M 24H+3 more
  • 2
$XAUT Monday Shi Pan Summary
10 trades were placed intraday, with 7 wins and 3 losses, yielding 54 points of room

The market fluctuates constantly, but not every move needs to be traded.
Learning to filter opportunities, knowing when to make trade-offs, and maintaining discipline are the keys to standing firm in the market for the long term! ​​​
post-image
XAUT-0.96%
$ETH — Buyers Are Back 👀🔥
ETH is holding the $2.45K area and this is the level I’m watching right now.
I don’t want to chase the move. If ETH gives a small pullback and buyers defend support, I like the long setup.
🟢 Entry: $2,470 – $2,500
🛑 SL: $2,440
🎯 TP1: $2,525
🎯 TP2: $2,560
🎯 TP3: $2,600
The first target is close because I want to see how price reacts around $2,525.
If ETH breaks $2,525 with volume, the next move toward $2,560–$2,600 could come quickly.
But if $2,440 breaks, I’m out. No forcing the trade.
$2.45K hold = buyers still have the advantage.
$2.56K breakout = momentum g
post-image
ETH-2.07%
  • 4
market overview
live-cover
LIVE551
$PONS — This Move Is Getting Crazy 👀🔥
PONS just printed a fresh ATH around $0.77 and volume has exploded.
But after a move like this, I’m NOT chasing the top.
I want to see how buyers react around the breakout zone.
🟢 Entry: $0.68 – $0.72
🛑 SL: $0.62
🎯 TP1: $0.78
🎯 TP2: $0.85
🎯 TP3: $0.95
The main level for me is $0.77.
If PONS breaks $0.77 again and holds it with strong volume, another expansion could come quickly.
But if the breakout fails and price loses $0.68, I’d rather stay out than chase a falling candle.
This is moving FAST, so don’t let FOMO choose your entry.
$0.77 reclaim =
post-image
PONS-0.41%
  • 4
  • 1
$TSLA SPCX Back to $150: Analysts Call for $280, but 300 Million Shares Unlock on September 9
Oppenheimer raised its target from $250 to $280, with the reasoning quite straightforward: AI-related revenue has more upside than previously expected. Sounds great, right?
But immediately afterward, it will face a much more practical issue—on September 9, approximately 319 million employee lock-up shares will be unlocked.
The next day, September 10, another approximately 59 million shares from a separate tranche will become tradable. On one side, analysts are saying it could “double again”; on the ot
TSLA-5.96%
SPCX-1.19%
  • 3
JUST IN: Circle confirms cirBTC on Ethereum is 1:1 backed by native BTC with segregated custody and on-chain reserve verification, redeemable 1:1 for BTC; arc/mainnet rollout pending. $BTC , $ETH
post-image
CRCL-1.17%
BTC-1.40%
ETH-2.05%
ARC+1.62%
JUST IN: Arbitrum clarifies Robinhood Chain had no outage yesterday; only batch submission delays tied to high Blob activity on the L1 market, with user-initiated txs unaffected. $ARB
post-image
ARB-4.27%
$TENCENT — This Level Is Interesting 👀🔥
Tencent bounced from the HK$440–442 area after recent weakness.
Now I’m watching one simple thing:
Can buyers reclaim HK$450?
If price reclaims the $450 area with volume, momentum could build again.
🟢 Entry: HK$442 – 447
🛑 SL: HK$429
🎯 TP1: HK$460
🎯 TP2: HK$475
🎯 TP3: HK$490
For me, HK$440 is an important level.
As long as buyers are defending this zone, the long setup is interesting.
But if HK$429 breaks decisively, I won’t force the trade.
$450 reclaim → bulls get my attention 🔥
$429 breakdown → setup invalid ❌
No FOMO. No blind entry.
Would y
post-image
TENCENT-0.46%
  • 3
  • 2
ETH nets $46.47M inflow while Robinhood Chain leads $100M+ outflows, signaling a shift back toward mainnet L1 activity as Layer 2s see rebalancing flows. $ETH $SOL
post-image
ETH-2.05%
SOL-1.66%
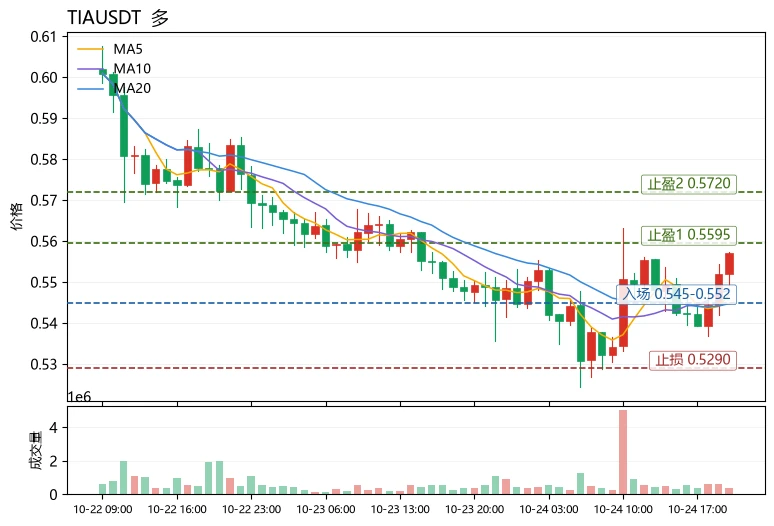
With this price action, I don’t even need to think—the account is throwing its own party 🤣 During the repeated intraday swings, I noticed it fell short every time it pushed higher, with clear resistance above and no buyers stepping in. This wasn’t the market makers being kind; it was an obvious strong whiff of a bull trap. Don’t lose patience grinding through the range, only to try to regain your dignity in a one-way move. At the time, I decisively called for a short position, entering at 0.02485. It has now reached 0.02387, with a return of +76.06%. This profit feels great—the people on boar
post-image
SNDK+12.46%
BTC-1.45%
Crypto Prediction and Trading Insights
live-cover
LIVE1,575
$NVDA Nvidia May Reclaim the “Iron Throne”
Share prices of U.S. tech giants are once again nearing record highs—and this time, Nvidia is clearly the player leading the bull-market charge.
After falling behind other surging semiconductor stocks earlier in 2026, Nvidia has recently been reestablishing its position as the “king of the AI trade.”
On Thursday, the first and largest U.S. ETF tracking the “Magnificent Seven”—the Roundhill Magnificent Seven ETF—surged nearly 2.5% to close at $70.43, just below its record closing high of $70.94 set in May this year. The ETF holds equal positions in the
post-image
ThisIsTranslateContent:
$NVDA Nvidia May Reclaim the “Throne”
US tech giants’ stock prices are once again approaching record highs—and this time, Nvidia is clearly the player leading the bull market charge.
After falling conspicuously behind other surging semiconductor stocks earlier in 2026, Nvidia has recently begun reasserting its position as the “king of the AI trade.”
On Thursday, the first and largest US-listed ETF tracking the “Magnificent Seven”—the Roundhill Magnificent Seven ETF—surged nearly 2.5% to close at $70.43, approaching its record closing high of $70.94 set in May this year. The ETF holds equal-weight positions in the seven tech giants—Microsoft, Apple, Nvidia, Alphabet, Amazon, Meta, and Tesla—and rebalances quarterly.
In recent months, the “Magnificent Seven” stocks have shown clear divergence. Of the seven constituents, Nvidia and Apple are closest to their record highs, with both less than 3% below their all-time highs. Meanwhile, Alphabet, Meta, and Tesla have fallen by double digits from their record highs.
Nvidia’s stock has recently gained strong momentum, boosted by its robust earnings report last week. In its latest earnings report, the company said it expected revenue for the fiscal year ending January 2028 to grow by more than 70%.
Joe Tigay, portfolio manager at Equity Armor Investments, wrote in a report last week that the earnings results showed “the buildout of AI infrastructure remains endless.”
Overnight, Nvidia received its latest piece of good news with the announcement that it would acquire Hugging Face, a popular open-source AI developer platform. In a report on Thursday, Forrester Vice President and Principal Analyst Jeff Pollard said the deal would help the chip giant gain greater control and visibility over the open-source software layer, thereby deepening Nvidia’s AI ecosystem.
Nvidia returns to the spotlight Nvidia’s market leadership once again marks a reversal in the industry landscape from earlier this year. At that time, as semiconductor stocks such as Micron Technology and Advanced Micro Devices (AMD) drove the iShares Semiconductor ETF to a record high, Nvidia was left far behind. Some analysts speculated that Nvidia had become too large, and investors were seeking differentiated semiconductor plays.
Data shows that although the iShares PHLX Semiconductor ETF (SOXX) has risen 67% year to date, the semiconductor sector as a whole has recently significantly underperformed Nvidia as investors recalibrated their expectations for some fast-growing chip stocks. Over the past three months, Nvidia’s stock has risen 7%, while SOXX has fallen 18%.
Despite shifts in market sentiment and competition from rivals, Nvidia has once again demonstrated its irreplaceability in the AI wave through strong earnings expectations and strategic reinforcement of the open-source ecosystem. As hardware infrastructure buildout continues and the software ecosystem matures, whether Nvidia can lead the “Magnificent Seven” to new highs will become a key indicator of the direction of US tech stocks. $NVDA
repost-content-media
NVDA+0.87%
MSFT-2.03%
AAPL-2.51%
AMZN-0.15%
META+0.99%
  • 1
$BICO /USDT
Lying above strong S/R level. RSI is showing a bullish divergence. EMA'S are acting as solid support. Stochastic is giving a buying signal. Expecting a big upward move from here.
Targets: $0.02690 - 0.03580 - 0.05645 - 0.12045
Stop if 1D closes below $0.01755
post-image
BICO+8.01%
A Brief Analysis of BTC’s Short-Term Trend from Dow Theory, Chan Theory, Elliott Wave Theory, Volume-Price Relationships, Order Flow, and Price Action
I. Dow Theory
Primary trend (1-hour timeframe): The primary downtrend from the historical high of 82,814 on May 6 confirmed a trend reversal in mid-August. The price began a strong rebound from the August 14 low of 62,488. After forming a double bottom at 63,979 at 03:00 on August 18, the bulls launched an epic rally. The price surged from 63,979 to the August 28 high of 81,346.95, setting a new high for the current phase, for a cumulative gain
BTC-1.40%
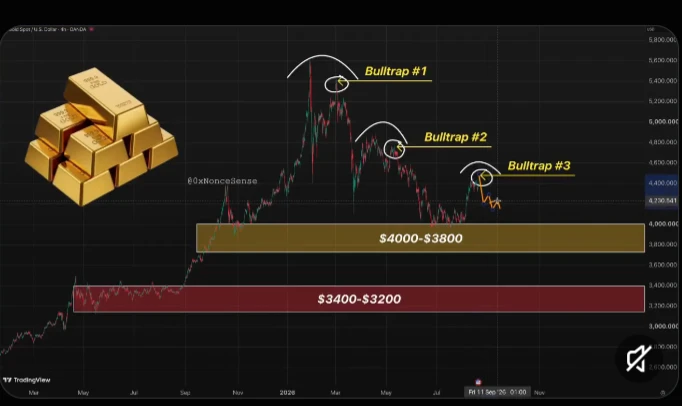
Everyone’s long gold at 4,437 — that’s exactly why I’m watching $XAU /USDT bleed.

$XAU /USDT - SHORT

Trade Plan:
Entry: 4433.16 – 4441.94
SL: 4479.66
TP1: 4405.97
TP2: 4384.91
TP3: 4353.33

Why this setup?
Range-bound 1D tape, RSI(15m) at 53 — zero momentum. 4h SHORT bias (55 conf) targets 4405, then 4384. ATR(1h) at 17.5 means the slide is real but slow. Entry zone 4433–4442 is the last stand before the drop; invalidation sits tight at 4479. Why now? The range top is rejecting, and the clock is ticking on this setup.

Debate:
Are you fading this range top with me, or does $XAU /USDT fak
XAU-0.98%
🔥 I’m watching $AKE /USDT closely right now…
This chart just woke up! 🚀 AKE has exploded out of its consolidation with strong momentum + heavy volume, pushing toward the 0.01752 area. I don’t want to chase the candle blindly I’m watching for a controlled entry/retest.
📍 Entry Zone: 0.01620 – 0.01680
🎯 TP1: 0.01750
🎯 TP2: 0.01820
🎯 TP3: 0.01900
🛑 Stop Loss: 0.01540
The key now is whether buyers can hold above the breakout zone. If the retest holds, another leg higher could be on the table. ⚡📈
Trade smart: don’t FOMO into a vertical candle, manage your risk, and consider taking partial
post-image
AKE+31.87%
No wonder one company shouldn’t dominate—this stingy Claude actually reset my limit after I used 90% of it this week. Well, don’t blame me for going all out with Fable5.1 until next Tuesday.
post-image
Load More

Join 40 M users in our growing community

⚡️ Join 40 M users in the crypto craze discussion

💬 Engage with your favorite top creators

👍 See what interests you

View More