Square
Following
Hot
News
Notifications
Profile
Share your thoughts
placeholder
Article
London Solana Breakpoint ‘26
- Sent from my digicam
SOL-0.77%
ETH Live Scalp & Swing Levels Today | $1,550 Bounce — Ab Kya Karein?
live-cover
LIVE1,342
BTC-0.67%
Trenches
FIONA
F
bade
b
FIONA
B34n...pump
Market Cap
$.
Change
.
24h Vol
$.
Holders
.
PIEVERSE
P
bade
b
PIEVERSE
0x0e...25a9
Market Cap
$.
Change
.
24h Vol
$.
Holders
.
IDOL
I
bade
b
IDOL
0x3b...ab07
Market Cap
$.
Change
.
24h Vol
$.
Holders
.
CLAUDIA
C
bade
b
CLAUDIA
2j5S...W2ZM
Market Cap
$.
Change
.
24h Vol
$.
Holders
.
Singularity
S
bade
b
Singularity
7R4M...pump
Market Cap
$.
Change
.
24h Vol
$.
Holders
.
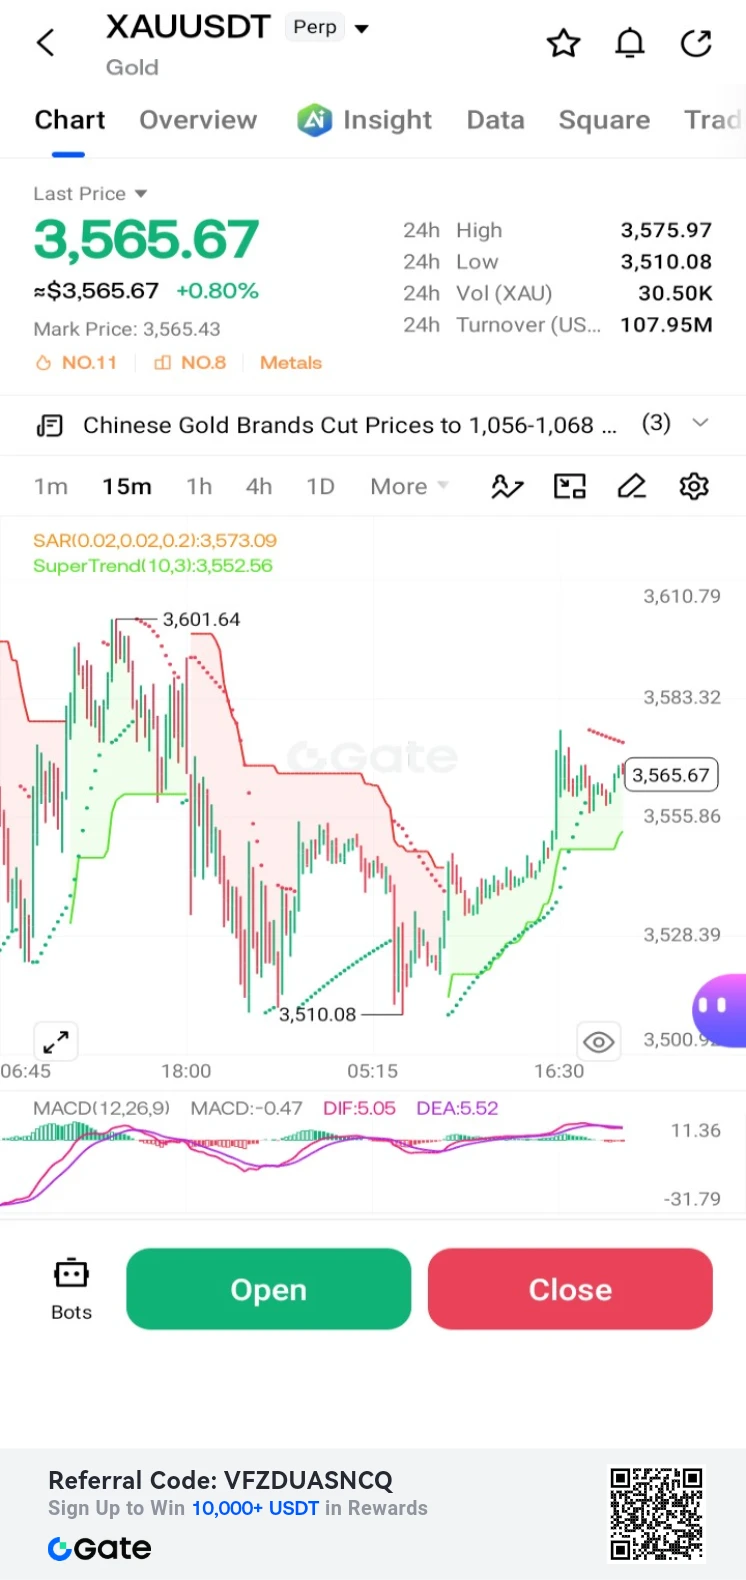
$XAU /USDT Perp – "V-Shape Rebound – Long"**
Trading Plan Long $XAU
Entry: 3,565.67
SL: 3,552.56
TP1: 3,583.32
TP2: 3,601.64
Gold is up +0.80% after a sharp bounce from the 3,510.08 low. MACD is crossing bullish; targeting the 3,583.32 resistance.
post-image
XAU+0.38%
Your Pi is not your Pi until it's migrated. Check migration status now. Comment MIGRATED or NOT YET.
#PiNetwork
#ShareWeekly
#GateSquare
#WCTCS9
post-image
PI-0.60%
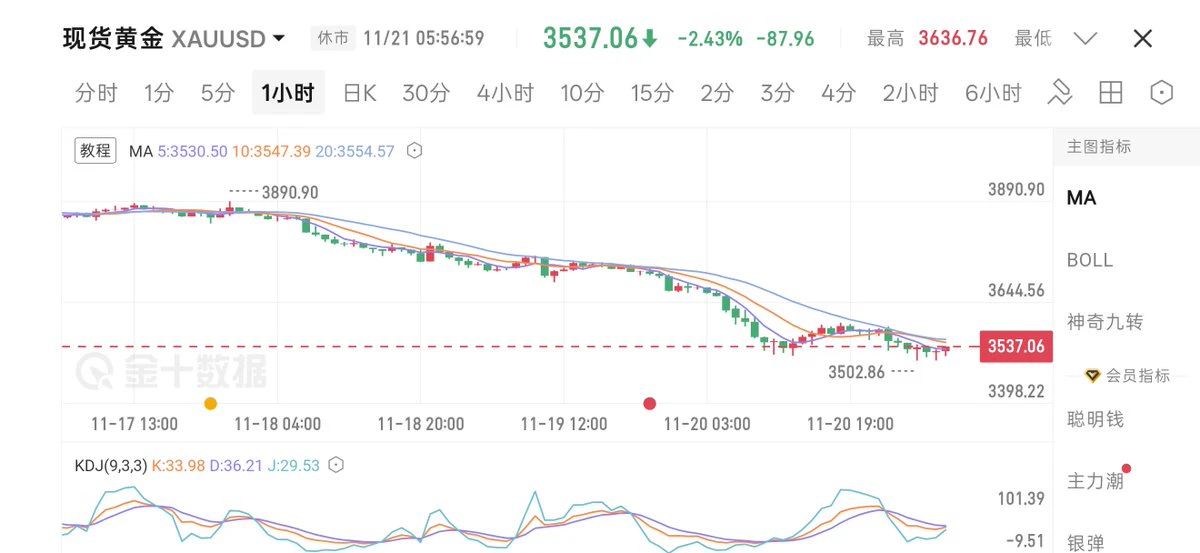
Gold is just over 3,500!!! 😱😱😱, there’s no way to live like this anymore—just destroy everything 🛌
post-image
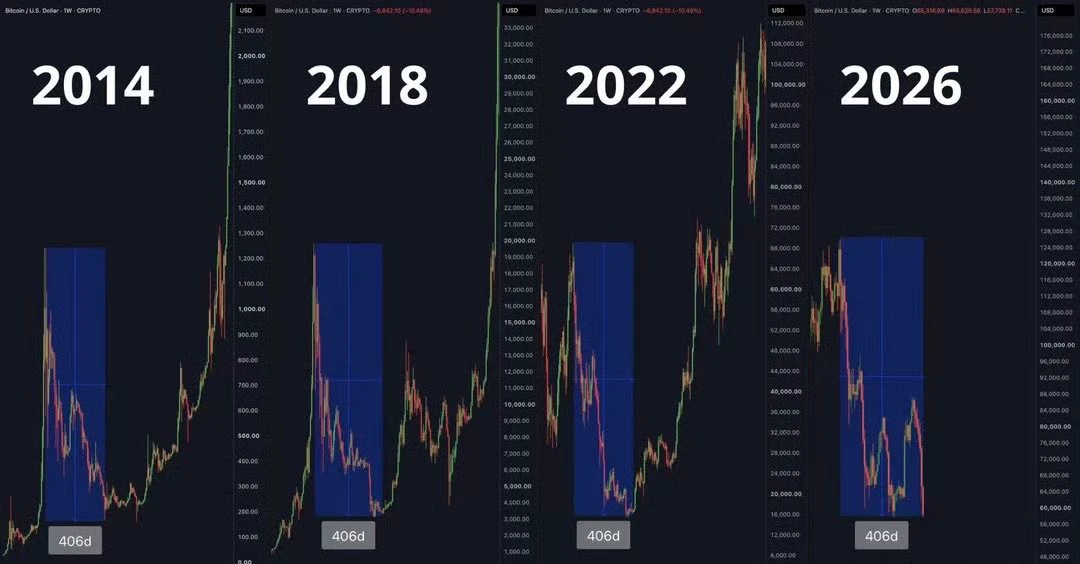
Saw a take that this might be the last week of Bitcoin’s bear market:
2014 bear market: 58 weeks, 406 days
2018 bear market: 58 weeks, 406 days
2022 bear market: 58 weeks, 406 days
2026 bear market: 58 weeks, 406 days
Those trying to apply past cycles to this one have carved a hole right through the boat.
With price action this fucking bad, people are still saying it’s the last week of the bear market? Even the Rainbow Chart has stopped working.
post-image
BTC-0.67%
$PIEVERSE Long setup update:

Entry reference: 3.1231; defense level (stop-loss): 3.0200; first target: 3.1796; second target: 3.2500; third target: 3.3500
Currently, $PIEVERSE is up +16.64%, with clear momentum; any pullback is an opportunity. My personal approach: take profits in batches and use strict stop-losses to avoid giving back profits.
Risk warning: The above is shared solely as my personal trading record and does not constitute investment advice. Contract leverage carries extremely high risk; please manage your position size yourself.
post-image
PIEVERSE+0.50%
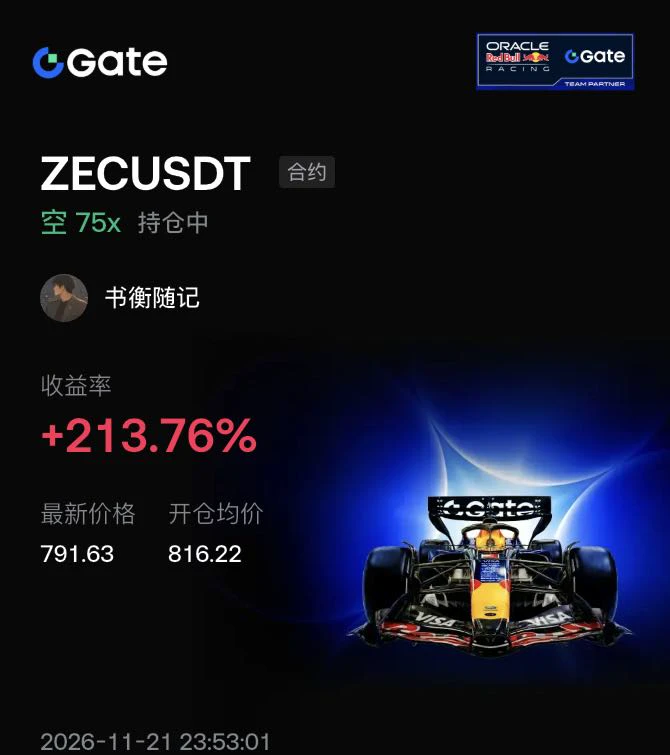
$ZEC The main thing to watch now is the conflict between the short-term rebound and the 4-hour downtrend.

The rebound from around 679 to above 790 has pushed the 1-hour price above the 5-, 10-, and 30-period moving averages, showing a clear short-term recovery.

The 15-minute moving averages are also starting to turn upward, but after rising to around 807, the price has temporarily entered a sideways consolidation, indicating some selling pressure overhead.

On the 4-hour chart, although the price has moved back above the short-term moving averages, the 30-period moving average is still aroun
post-image
ZEC+1.29%
BTC-0.65%
ETH-1.23%
  • 1
#BTC #WCTCS9 #ShareWeekly
BTC Market Analysis: Why the Crash, Where Support Sits, and What Would Signal a Bull Trend

Bitcoin is trading near $59,100 after a sharp sell-off. The Gate spot snapshot shows a 24-hour low of $57,750, a 24-hour high of $62,636, and a 7-day change of about -13.7%. The daily candle that closed on November 20 finished at $58,949.90. Today's candle is still open and was trading near $59,120. Here is my view on what is driving it, the levels I am watching, and what I would need to see before calling a trend reversal.

What is driving the crash

The first driver is force
Barring surprises, remember that today, 1121, will likely officially rank among the 10 largest liquidation events in history.

A slight move tonight will likely push it past the $2.768 billion recorded on 2021.4.16.

Over the past 24 hours, $2.675 billion has been liquidated so far, affecting 350,636 people.
#英伟达单日重挫近14% Barring surprises, remember that today, 1121, will likely officially rank among the 10 largest liquidation events in history.

A slight move tonight will likely push it past the $2.768 billion recorded on 2021.4.16.

Over the past 24 hours, $2.675 billion has been liquidated s
BTC-0.65%
NVDA-13.84%
#BTC跌至9月以来新低 BTC Under Global Liquidity Withdrawal: After Falling Below the 200-Week Moving Average, Is $57.8k the Bottom or Just a Waystation?

The most painful thing about this decline is not how far prices have fallen, but that it offers no chance to catch your breath. U.S. stocks, gold, silver, copper, and crypto assets have almost all fallen. From November 19 to 20, spot gold briefly dropped to around $3,525 per ounce, its lowest level since September 2025, bringing its cumulative decline this quarter to about 15%; silver fell to $41.25, platinum to $1,299, and LME copper lost nearly 9% f
NVDA-13.84%
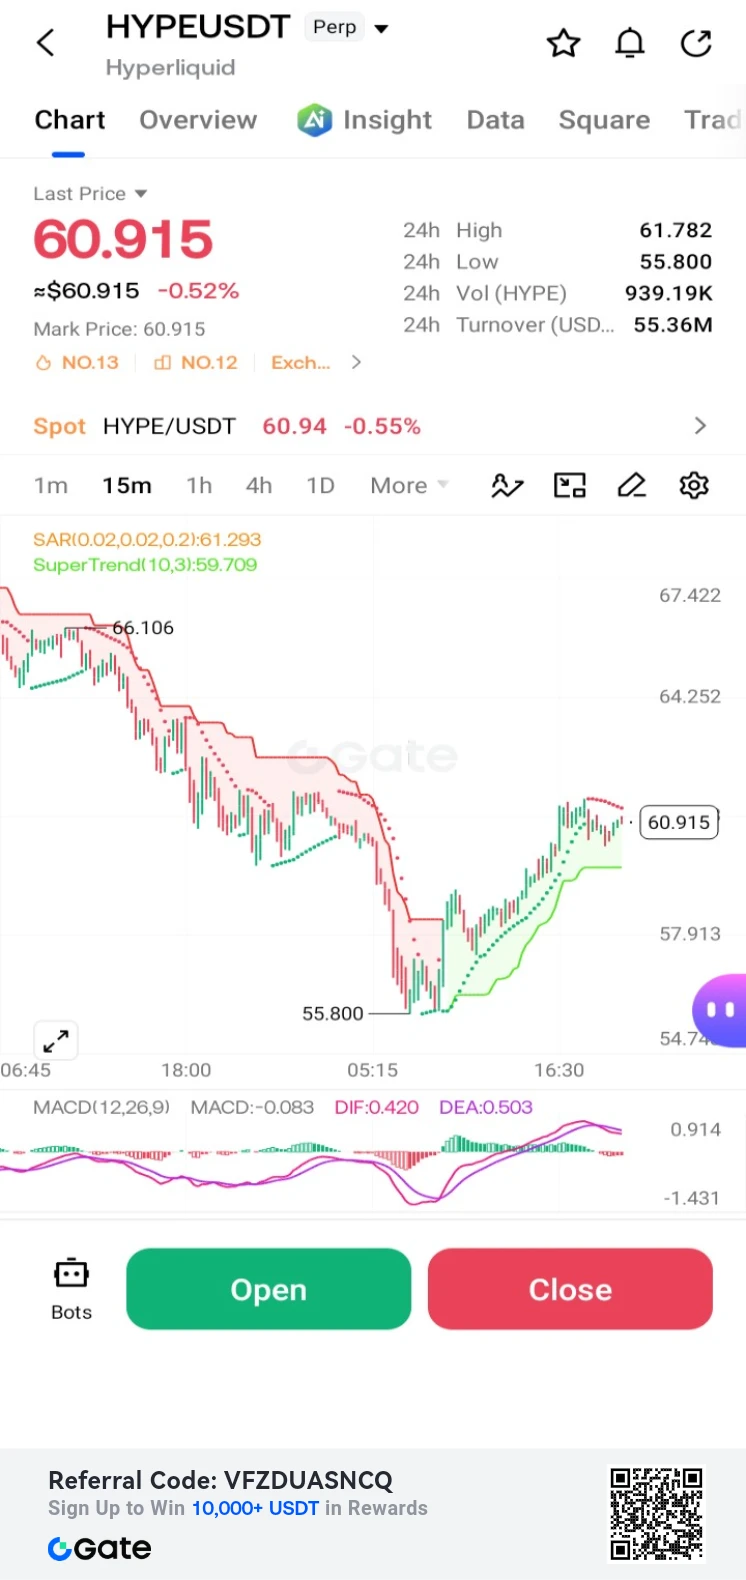
$HYPE /USDT Perp – "Uptrend Recovery – Long"**
Trading Plan Long $HYPE
Entry: 60.915
SL: 59.709
TP1: 61.782
TP2: 64.252
HYPE is down -0.52% but staging a steady recovery from the 55.800 low. MACD is bullish; targeting a retest of the 61.782 local high.
post-image
HYPE+0.33%
The extent of ETF redemptions determines how low $ETH ’s bottom will go—and that’s now playing out.

In the past, spot ETH ETFs saw net outflows on most trading days. Institutional redemptions accelerated noticeably in November, reaching 131 million in a single day on Thursday. Although the on-chain staking queue is long, it still cannot stop spot selling pressure. Combined with macro risk aversion and a breakdown in the broader market, ETH fell about 20% in a month. Yesterday, the Ether reference index plunged 10.5% in a single day, and the rebound in retail demand still couldn’t fill the ins
ETH-1.23%
AKE+6.39%
  • 1
Whale Adds $10.2 Million in Long Silver Positions, Becoming the Largest On-Chain Silver Bull
live-cover
LIVE1,151
ETH-1.26%
BTC-0.67%
USDC+0.01%
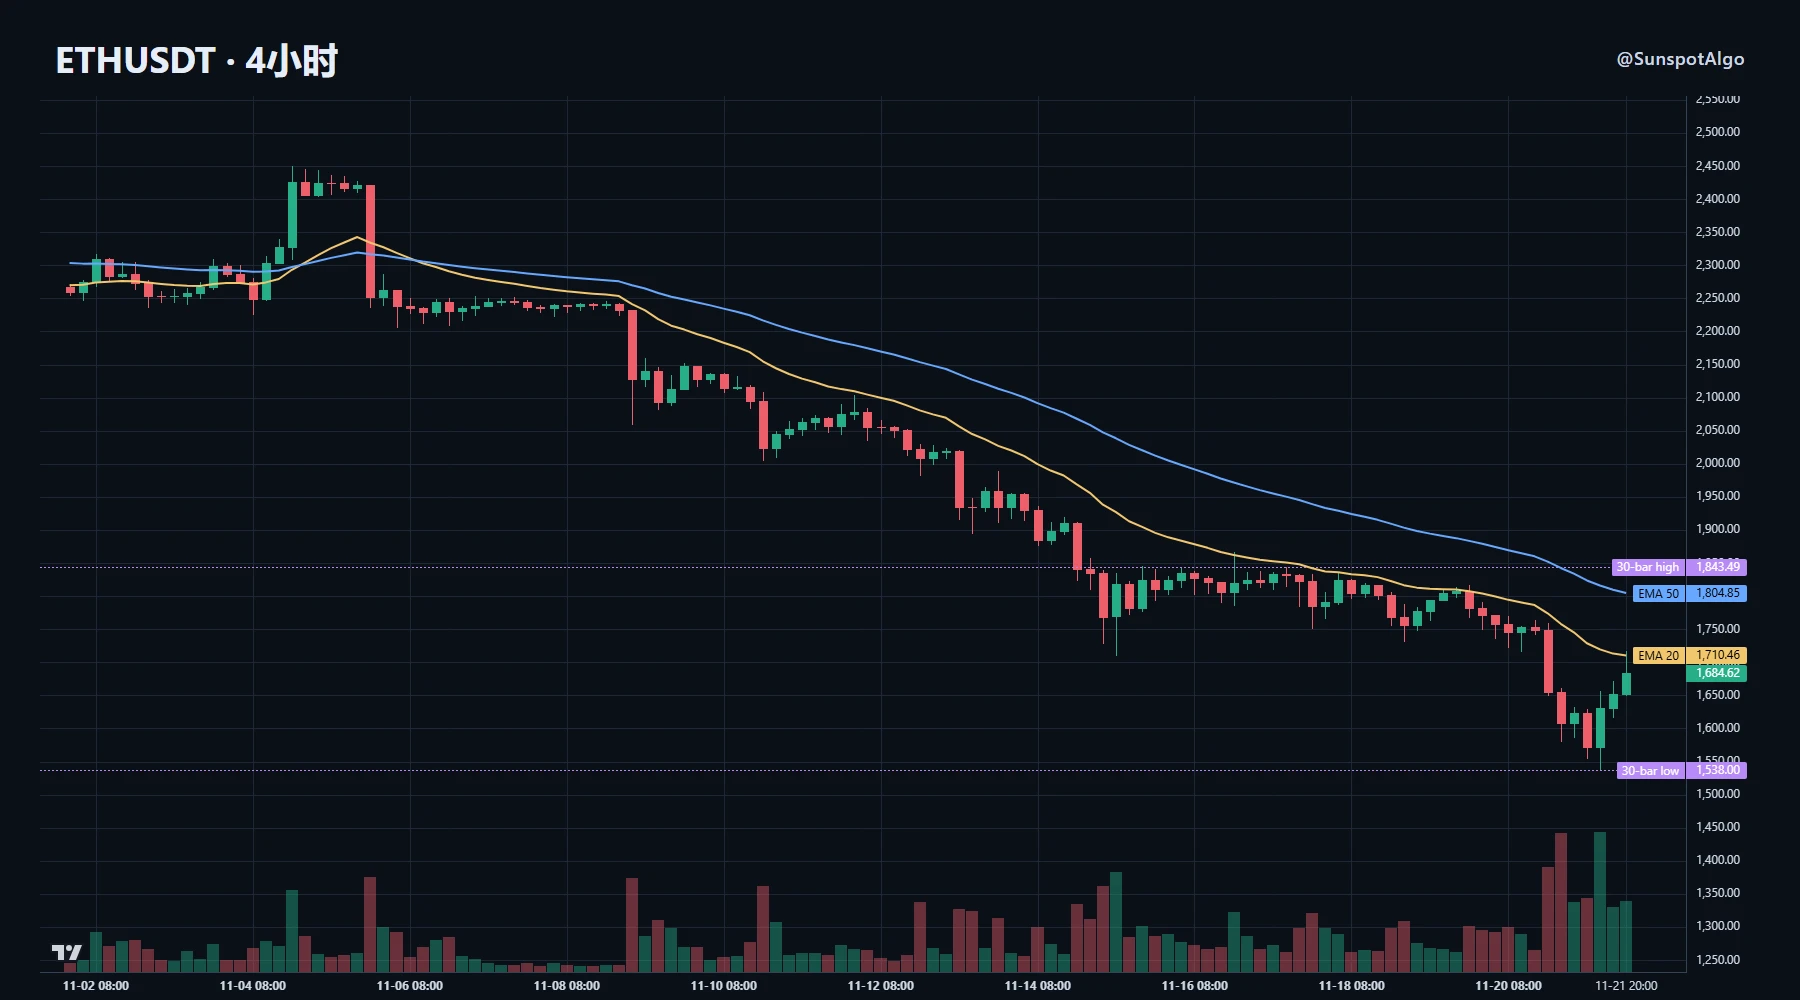
$ETH The current market structure is outlined as follows:

【Lower Defense Zone】- Short-term buffer zone: 1,580 - 1,600 USDT, the core area where buyers and sellers have repeatedly battled recently, with prices finding support there multiple times- Key defense: the 1,500 USDT round-number level, which is both psychological support and an area of concentrated structural demand; a break below it would indicate a marked weakening in market sentiment- Last-resort support: 1,536.59 USDT, corresponding to a previous low on the chart and serving as a reference for the final short-term line of defense
post-image
ETH-1.26%
Ethereum rebounded from around 1,580 to near 1,680. This kind of move is most likely to fool people, because the rally looks pretty convincing while it’s happening.

The details make things clear. The price rose about 1.8% over 24 hours, open interest fell 4%, and the funding rate was nearly neutral at 0.0029%. The price rose while open interest contracted, indicating the move was driven by short covering, with new buying yet to truly kick in. These rebounds tend to come fast and fade just as quickly. Once the short covering runs its course, the price can easily return to where it started if t
post-image
ETH-1.23%
BTC-0.67%
$OPENAI sam is a huge scammer!!!! May your whole family die! What has WLD fallen to!!!!
OPENAI-0.04%
#GateLeadsRWAPerpExpansion
🚀 Gate Leads the Expansion of RWA Perpetual Trading – A New Step for the Crypto Market!

The crypto market is growing every day, and Gate continues to bring new trading opportunities to its global community. One important development is the expansion of Real World Asset (RWA) perpetual trading. This is an exciting step because it connects traditional financial markets with the modern world of cryptocurrency.

RWA means Real World Assets. These assets are connected to real-world markets and financial products. They can include stocks, gold, commodities, and other tr
post-image
XAU+0.38%
BTC-0.65%
ETH-1.23%
  • 3
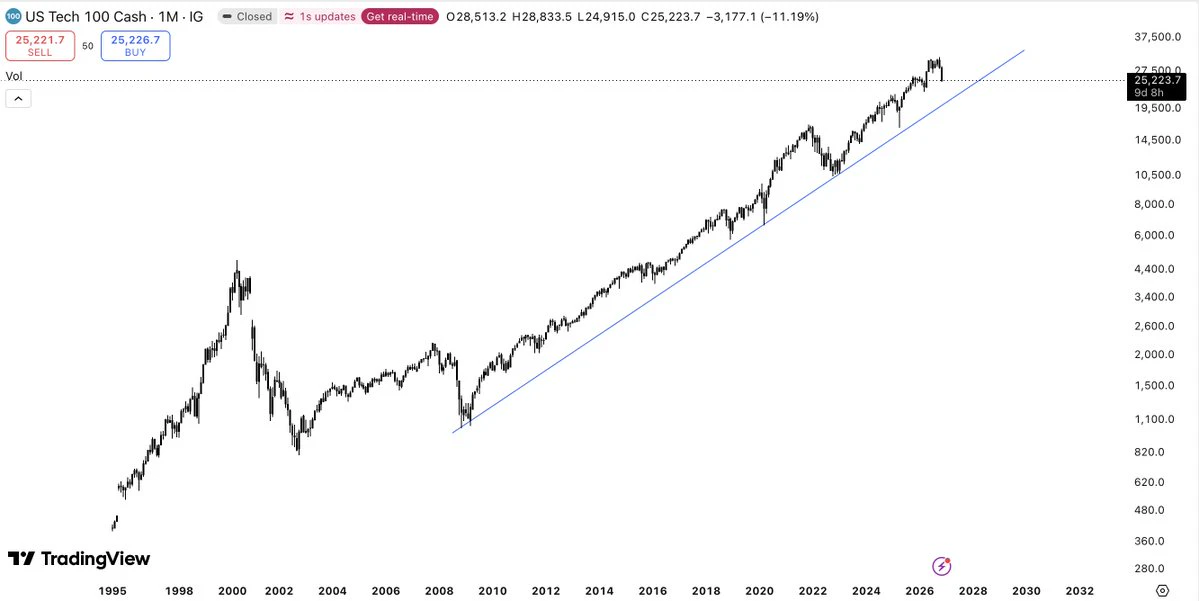
NASDAQ looks like this and the timeline is acting like the world is ending.
we could drop another 20% from here and the multi-decade uptrend would still be fully intact.
if anything, this is a great buying opportunity for anyone with a long time horizon.
just chill ffs.
post-image
NDAQ-0.95%
  • 1
Spending the weekend in the Belgian Ardennes!
So, how are the markets doing? We at 0 yet?
Load More

Join 40 M users in our growing community

⚡️ Join 40 M users in the crypto craze discussion

💬 Engage with your favorite top creators

👍 See what interests you

Trending Topics

BTCBreaksBelow60K

2.1M Views29.9K Discussing

BTC fell below $60,000 on November 20 for the first time since July, alongside a tech stock selloff and broader pressure on risk assets. Will $60K become resistance, or can BTC quickly reclaim it? What price or volume signals would convince you that selling pressure is easing?

GateDirectIPOPhase3ANTAllocates92100Shares

779.2K Views4.9K Discussing

NvidiaDropsNearly14Percent

326.7K Views7.6K Discussing

View More