
Square
Following
Hot
News
Notifications
Profile
Share your thoughts
placeholder
Article
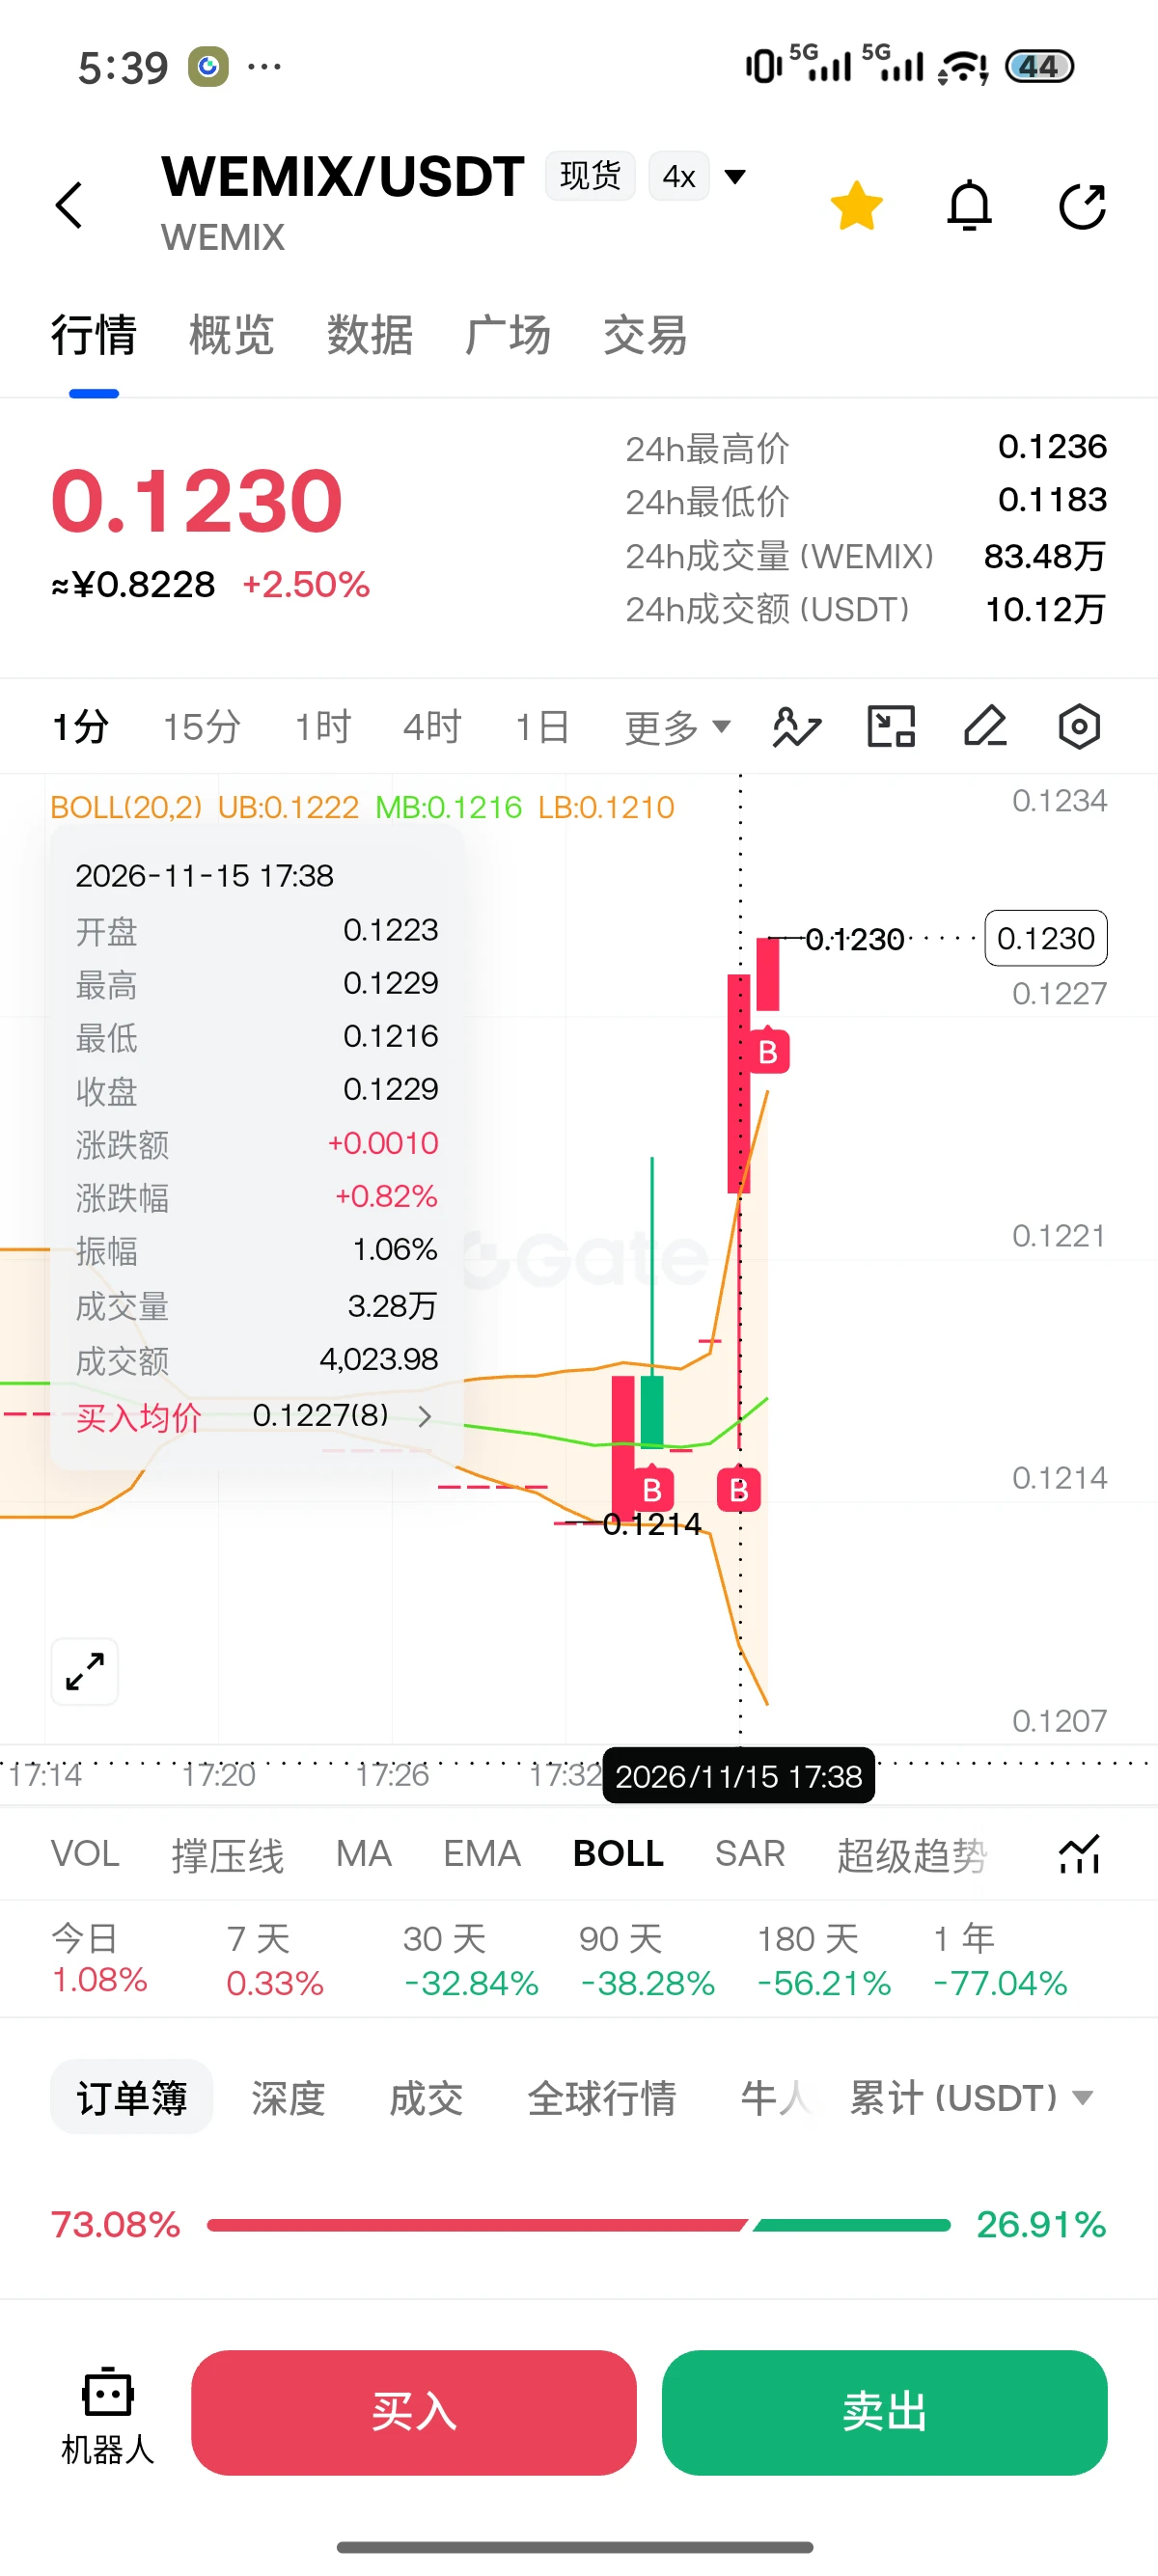
$WEMIX Actually, entering with 50,000–60,000 tokens won’t move the price much at all. It’s just that you don’t know how to place orders, so you incur a lot of slippage. My average price is 0.1222
post-image
WEMIX-5.01%
$INIT This momentum is worth watching closely. The previous TP1 has been successfully banked—congrats to everyone who followed along. My current strategy is to keep going long on $INIT with the trend. At the current price of 0.1268, you can enter directly. The first target is 0.1523, the second is 0.1700, and the stop is at 0.097. Another strategy is to go long on a pullback into the 0.1097–0.1110 range, with take-profit targets at 0.1255 first and then 0.1500, and a stop-loss at 0.090. $INIT It is currently up more than 22%, with solid volume support, but don't chase the price; waiting for
post-image
INIT-2.53%
Trenches
Snoopy
S
bade
b
Snoopy
7mEh...47Cn
Market Cap
$.
Change
.
24h Vol
$.
Holders
.
mihao
m
bade
b
mihao
4Cxj...pump
Market Cap
$.
Change
.
24h Vol
$.
Holders
.
AGT
A
bade
b
AGT
0x5d...e274
Market Cap
$.
Change
.
24h Vol
$.
Holders
.
PIEVERSE
P
bade
b
PIEVERSE
0x0e...25a9
Market Cap
$.
Change
.
24h Vol
$.
Holders
.
GTA$
G
bade
b
GTA$
6Nh9...pump
Market Cap
$.
Change
.
24h Vol
$.
Holders
.
market updates
live-cover
LIVE2,683
Weekend balances are running low, so don’t rush to stare at the charts and guess the direction—first take a look at these smart money positions. Real-money positioning is more honest than any candlestick pattern; retail traders may be left speechless.
$BTC is currently at 65716. On the long side, around 600 whales have an average entry price of 70111, and their unrealized losses have ballooned to over $36 million. On the short side, more than 1,800 traders entered at an average price of 71722, sitting comfortably on $220 million in profits. The nominal long/short ratio is just 22.5%—big money
post-image
BTC-0.67%
ETH-1.26%
ZEC+1.16%
BTC and ETHs updates
live-cover
LIVE1,988
Only 5 of 59 coins are up, $ADA volume ratio 2.671, and I still choose to be bullish
$ADA at 0.1497, 24h -8.216%. Only 5 of 59 coins across the market are in the green, the Fear & Greed Index is 10, and in this defensive period with the whole market getting hammered, I still choose to be bullish on $ADA.

24h trading volume is 42282961 USDT, 2.671 times the 30-day average, expanding—buyers are still stepping in despite this drop. Funding rate is -0.00011437, meaning shorts are paying longs; OI is down 1.78%, and the long/short account ratio is 2.0148. With 7d at -14.6% and 30d at -33.67%, the
ADA-1.48%
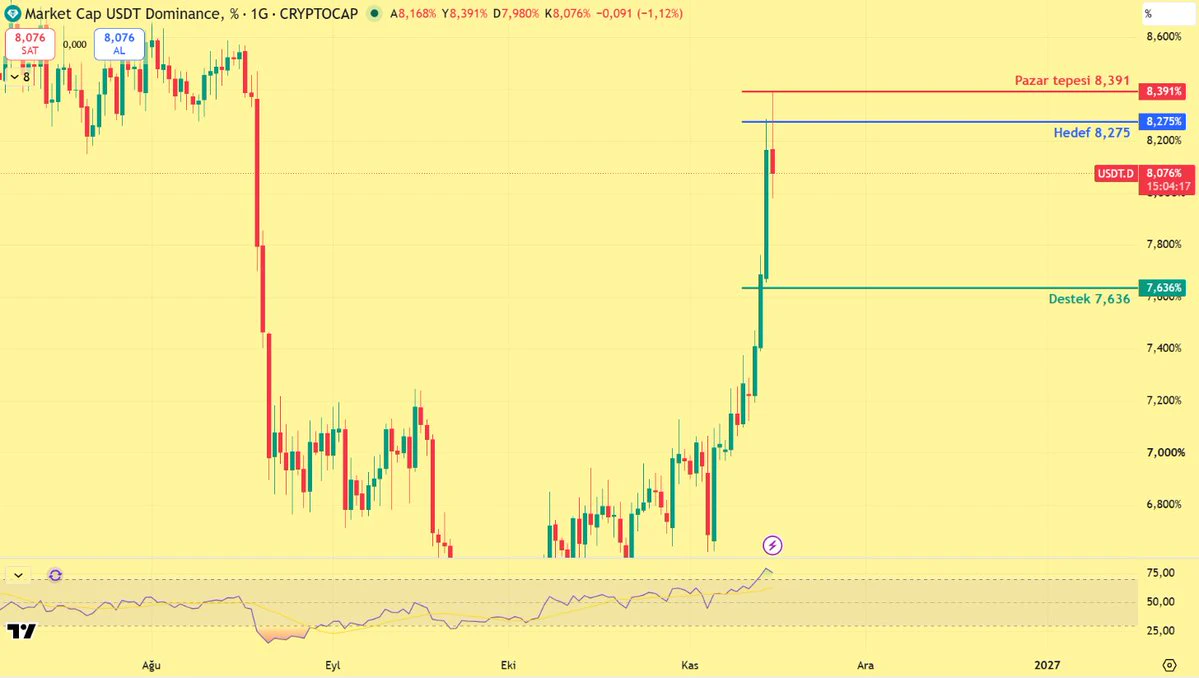
#USDTD
Failed to hold above the target.
Friends, USDT dominance rose to 8.391 today, then pulled back to around 8.07. It failed to hold above the 8.275 target I had set.
I had noted a weekly close above 8.31 as the invalidation condition for the bearish Libra possibility. It moved above that level during the day, but is now below it. The close is tonight.
If the pullback in dominance continues, the 7.636 level indicated on the chart will be the target. This would mean the rebound in crypto continues.
A weekly close above 8.31 would invalidate this possibility.
I’ll keep monitoring.
This is not
post-image
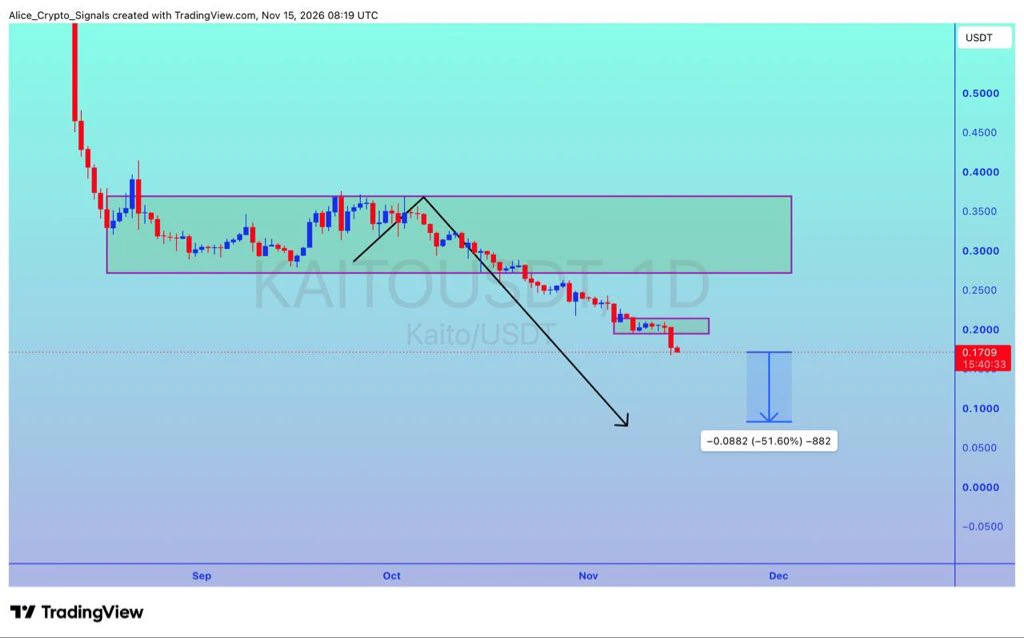
$KAITO
UPDATE
#KAITO already breakout done. We can see 50%+ drop here ✍🏻
post-image
KAITO-0.96%
You can tell there are no little kids in this household
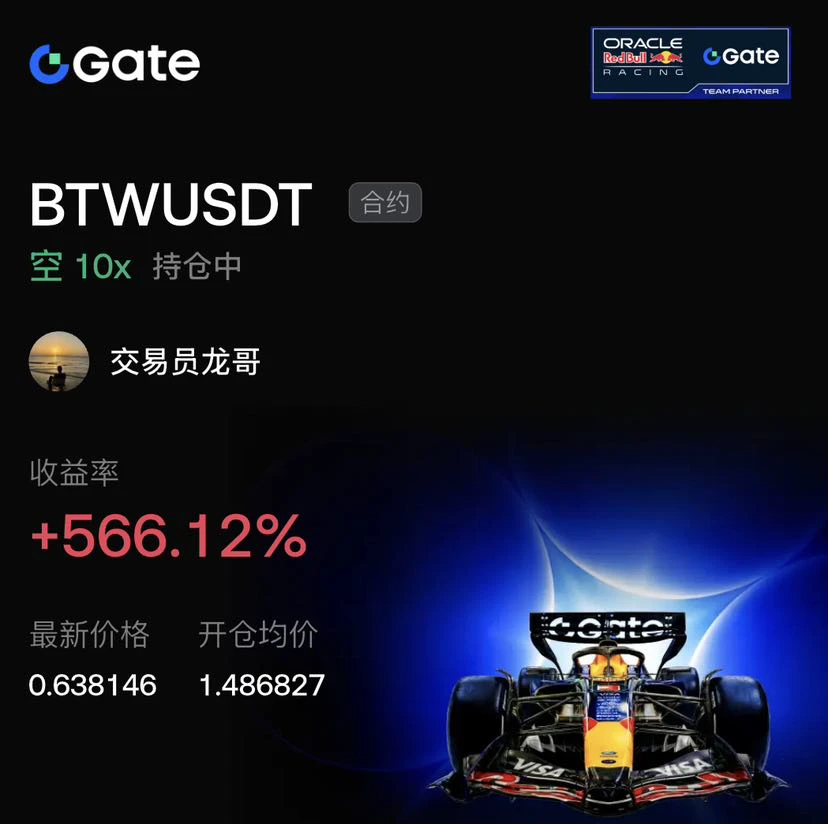
I was supposed to go surfing today, but $BTW the bears crushed everyone! 10x short position, +566.12%; price crashed from 1.486 to 0.638, profits through the roof.

Above 1.48, volume-price divergence emerged and bulls ran out of steam. I went all-in short on the high-volume breakdown, perfectly capturing the main downtrend.

Looking ahead, a break below 0.6 could lead to 0.5; add to shorts if a rebound into 0.65–0.7 meets resistance. The trend remains unchanged—let the profits run! $BTC $ETH
#比特币跌破7万美元
post-image
BTW-7.75%
BTC-0.65%
ETH-1.23%
The dollar index hits a new high, and gold $XAU this correction may not be over yet🤨
DXY has surged to 103.4, its highest level in nearly a year, while gold is taking a hit, with losses exceeding 4% so far this week and prices falling below $3,900
The key driver behind this round of dollar strength is still the Fed:
Strong employment data and inflation pressures have led the market to once again bet on a rate hike in December. Treasury yields have risen accordingly, putting pressure on gold from both the dollar and interest rates
Looking at the charts, gold has struggled to sustain any reboun
USIDX+0.00%
XAUUSD+0.00%
Gate直通IPO第三期Anthropic #Gate股票畅聊季 AI Stock Leadership Is Changing: AMD and Broadcom Rally While Nvidia Faces Its Biggest Leadership Test

As of November 15, 2026, the global semiconductor market is witnessing one of its most dramatic structural shifts since the start of the artificial intelligence boom. For years, Nvidia stood as the undisputed, unchallenged center of gravity in AI computing. This past week changed that narrative. Following the sudden November 12 resignation of longtime co-founder and CEO Jensen Huang after revelations surrounding personal conduct and national security inquirie
post-image
NVDA-1.92%
AMD-8.76%
AVGO-4.86%
MU-2.56%
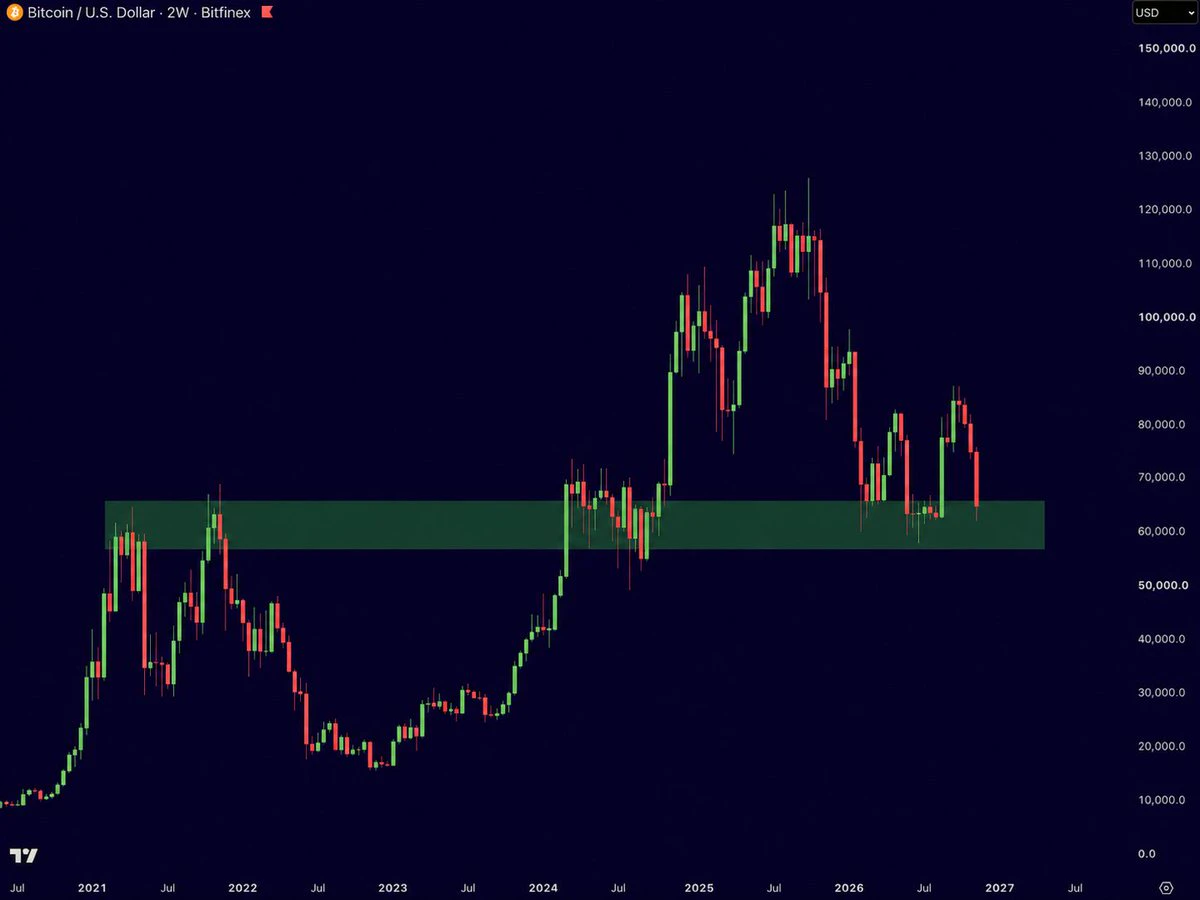
$BTC is testing a major support zone again.
This level has held through multiple market cycles.
If bulls defend it into the weekly close, we could see a strong bounce.
Losing it could bring more selling pressure.
post-image
BTC-0.67%
  • 2
  • 1
Case closed! The reason behind Bitcoin’s plunge has been found—it’s because of this! Will it fall further?
1. No more beating around the bush this time; let’s go straight to the chart. This crash is very likely due to a massive liquidity drain caused by Anthropic’s IPO! The amount drained reached $400 billion! Let’s take a look at the details:
2. According to currently disclosed figures, Ant plans to raise nearly $64.4 billion, while IPO subscriptions have already reached 6 times the offering size, or nearly $400 billion! Retail investors and institutions alike are subscribing to Ant’s IPO, pu
BTC-0.67%
SPCX-0.63%
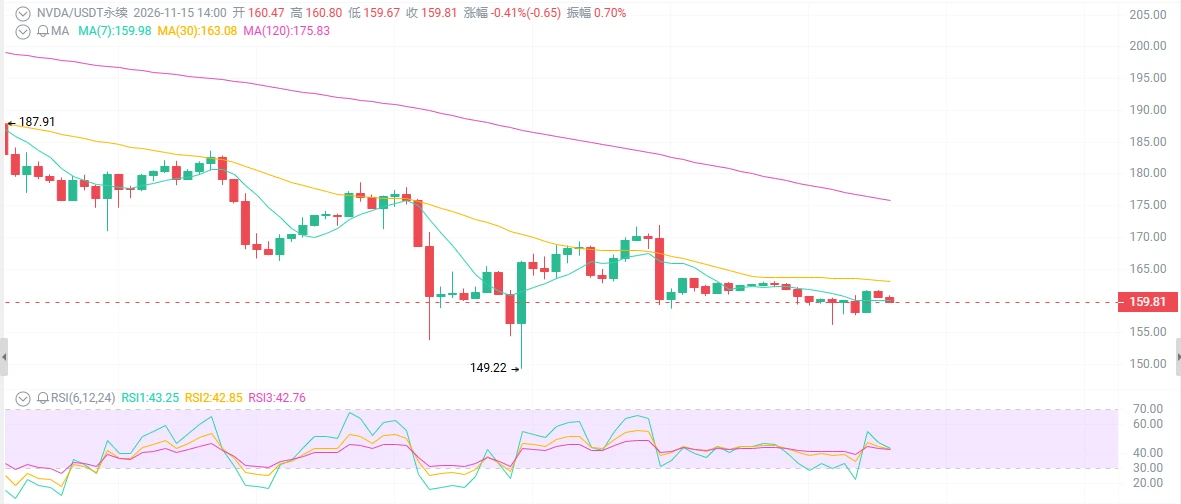
Nvidia at $160—would you catch the falling knife?
Jensen Huang’s scandal has exploded, the board is discussing his future, and the stock has plunged 30% from $243 to $160. But the RSI is only 25, deep in oversold territory, and Tuesday’s earnings report will be a life-or-death verdict—is this a once-in-a-decade golden opportunity, or a bottomless pit?

First, the surface picture: a waterfall-like plunge, but the indicators are already crying “uncle.”

From its early-October high of 243, the stock has plunged to 160, down more than 30%. It has fallen below the 200-day moving average at 204 and
post-image
BTC-0.67%
ETH-1.26%
NVDA-1.92%
AMD-8.76%
MU-2.56%
In #Web3 , there is a quiet irony in how true innovation is built.

You choose an ecosystem as your home, invest your engineering efforts in its infrastructure, and align your vision with its future. Yet when it comes time to lay the first brick, support doesn’t come from the roof over your head.

For @AxisRobotics, the earliest belief in our seed round didn’t come from @Base, the network we’re building.

It came from @PiCoreTeam, an ecosystem that the broader crypto space often ignores or underestimates.

It’s a humbling reminder that true belief isn’t determined by proximity, hype cycles, or
PI-0.60%
A good day to win and make money
post-image
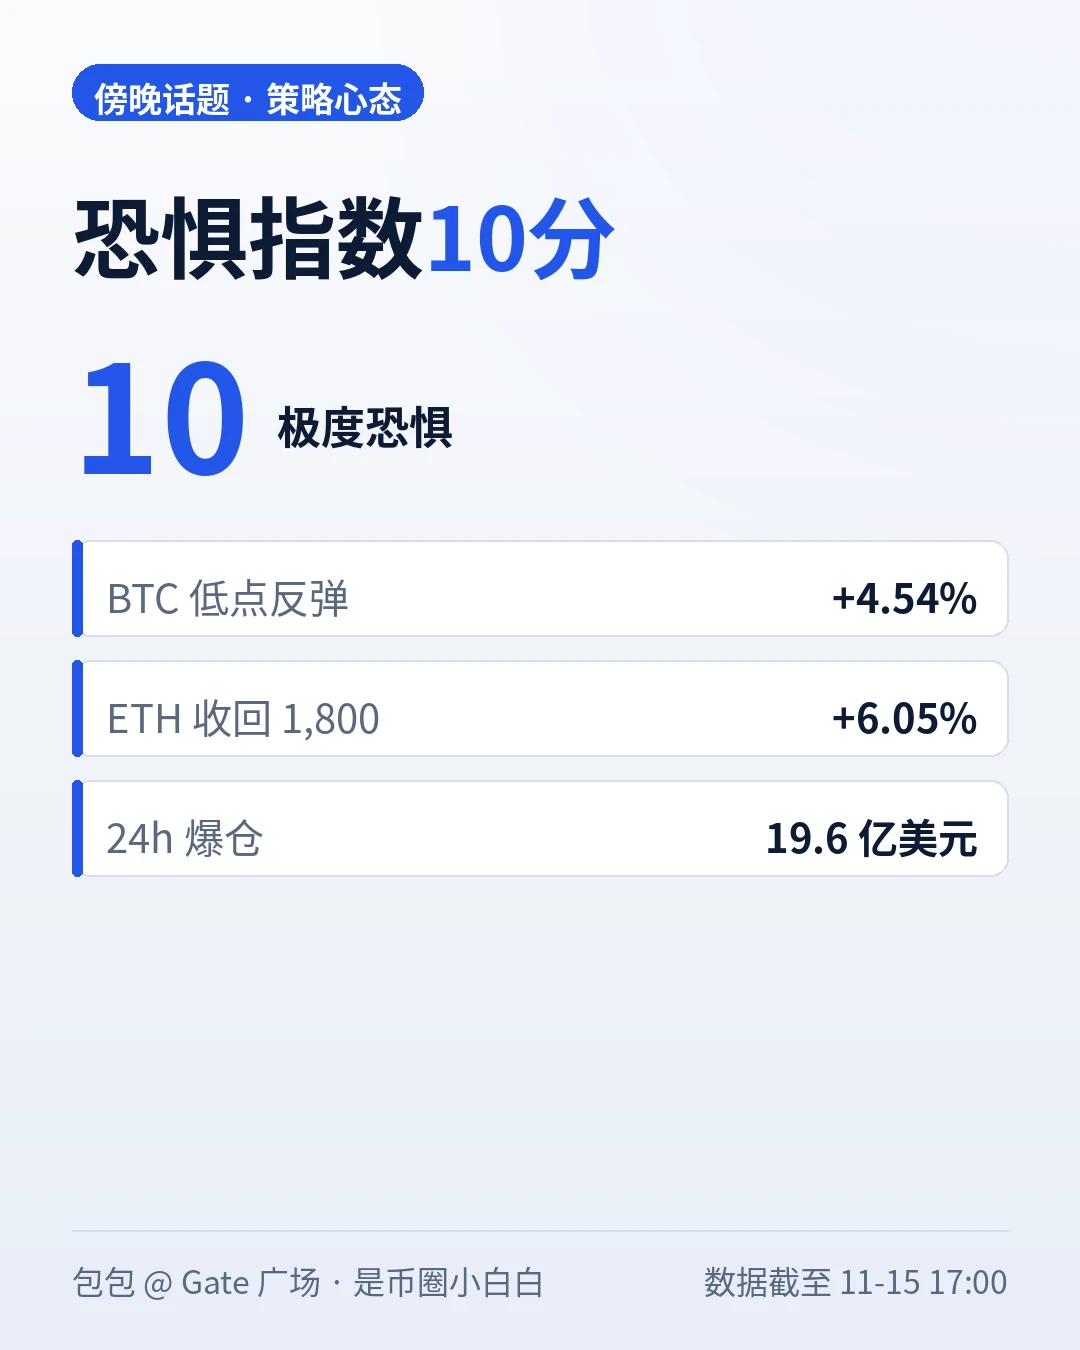
Fear & Greed Index at 10. BTC is down over 14% in 7 days and nearly 50% from its all-time high of 126,080—this time, it’s not the price that’s fallen, but confidence. #比特币跌破7万美元

Today’s price action actually came in two parts: BTC hit a low of 62,081 in the morning, while ETH bottomed at 1,713.65; in the afternoon, they bounced back, with BTC rebounding about 4.5% from its low to around 64,820, and ETH reclaiming 1,800 to trade at 1,814.56, up 6.05% from its low. SOL also bounced to 71.15. But the 24-hour changes are still negative: BTC -4.25%, ETH -5.15%, SOL -6.69%. The bounce is just a br
post-image
BTC-0.67%
ETH-1.26%
SOL-0.77%
NVDA-1.92%
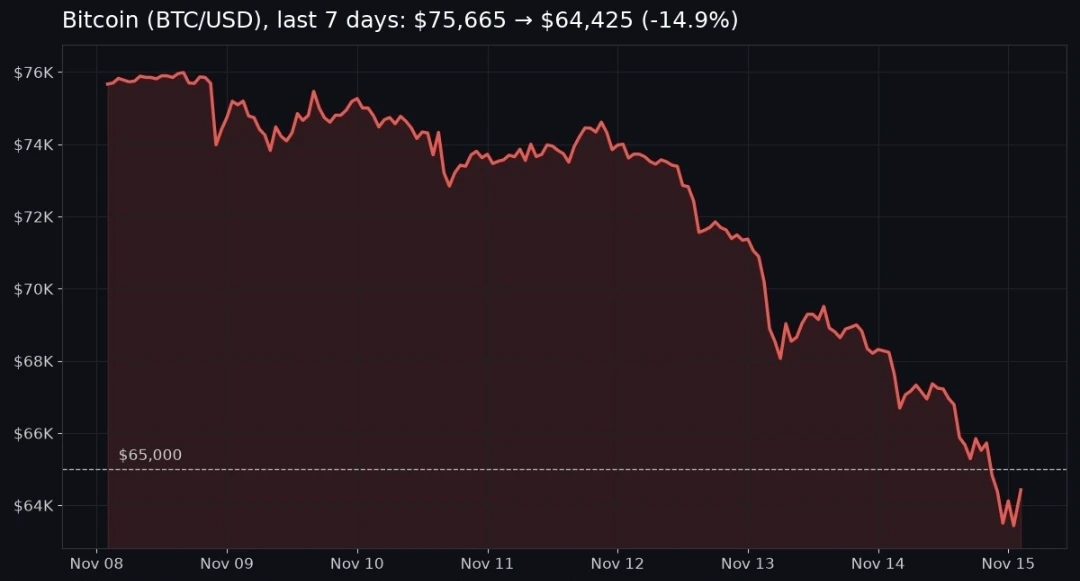
😱🚨 Bitcoin just slipped under $65K for the first time since August. Fear & Greed sits at 10, ~$1.9B in crypto liquidations in 24h, 7 straight days of ETF outflows.

Readings like this split the room: are you sitting out or zooming out?

##ShareWeekly #GateIPOAccessAnthropic

$BTC ‌$ETH ‌
post-image
BTC-0.65%
ETH-1.26%
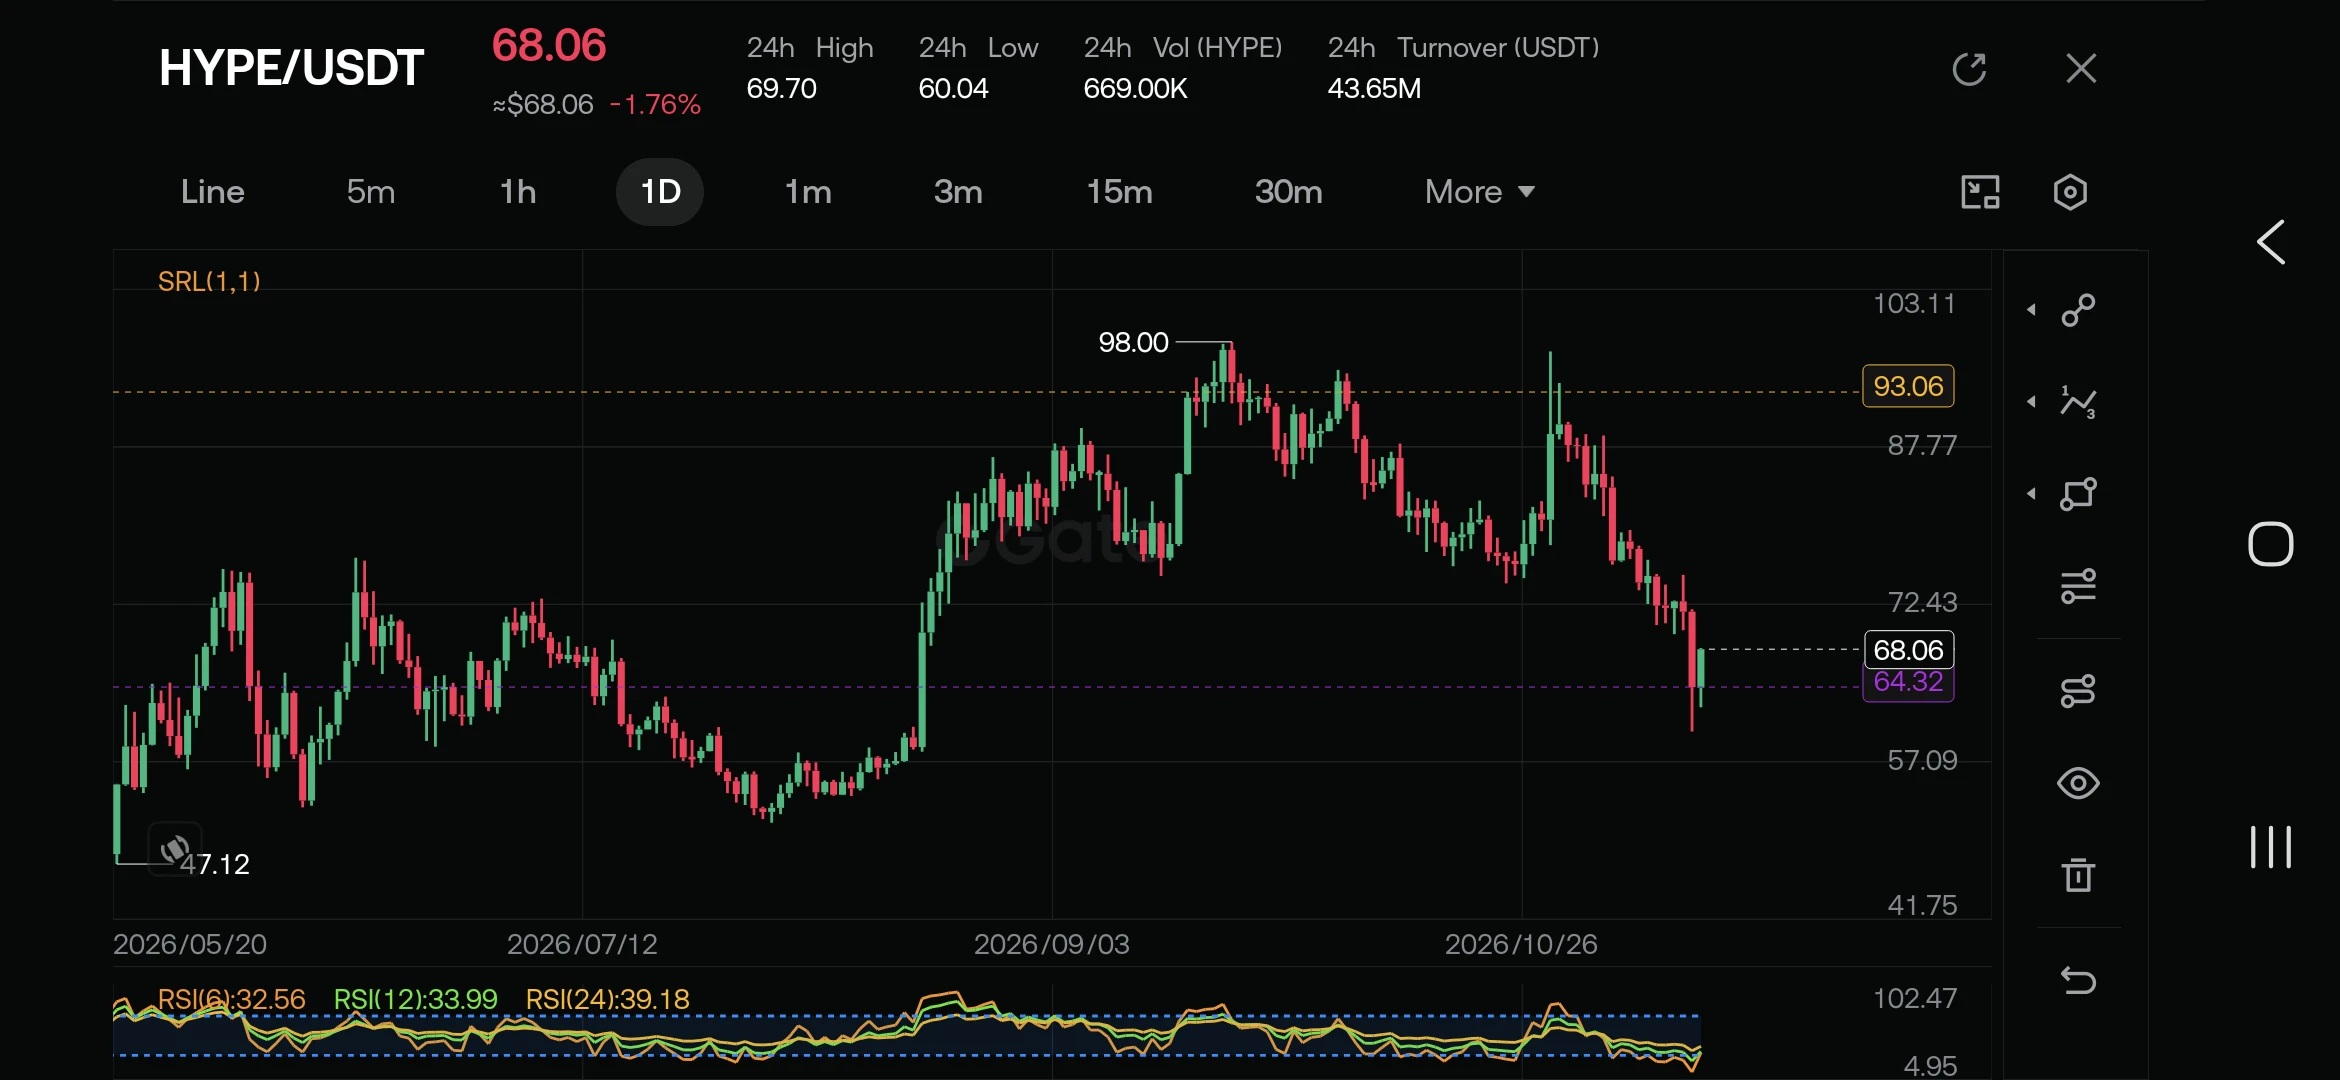
$HYPE /USDT Daily Technical Analysis: Approaching Oversold Territory After Steep Pullback
​The daily chart for $HYPE/USDT shows the asset navigating a sharp corrective phase following its rejection near the $98.00 peak. Currently trading around $68.06 (-1.76% over the last 24 hours), price action has shifted into a distinct short-term downtrend marked by consistent lower highs and heavy red candles.
​Key Price Levels & Structure:
​Immediate Support: The recent daily wick bounced off the $60.04 24-hour low, aligning closely with the broader demand zone around $57.09 – $60.00. Holding above the
post-image
HYPE+0.24%
Load More

Join 40 M users in our growing community

⚡️ Join 40 M users in the crypto craze discussion

💬 Engage with your favorite top creators

👍 See what interests you

Trending Topics

GateIPOAccessAnthropic

346.8K Views2.7K Discussing

Gate IPO Access Phase 3 features Anthropic (ANT), with USDT subscription interest starting from 100 USDT. Successful allocations will be delivered as real shares to Gate Stock Accounts. Indicative price: $70–$78/share Subscription: Nov 12–17 (UTC+8) Allocation is not guaranteed. Please manage risk accordingly.

Dr.HanOxfordUnionSpeech

151.1K Views510 Discussing

USOctoberPPIBelowExpectations

480.3K Views1.4K Discussing

View More