Square
Following
Hot
News
Notifications
Profile
Share your thoughts
placeholder
Article
$SOL The SOL futures positioning structure this time around is, bluntly, a one-sided slaughter.

Whales’ nominal long/short ratio has fallen to 29.2%, with shorts almost universally sitting on hefty profits. By contrast, most long positions are piled up above 105, while retail traders keep adding to their positions and averaging down as prices fall—a classic case of buying more as prices drop and getting more deeply trapped.
There’s no meaningful counterforce in the flow of funds—large players are applying one-way pressure, with positions trapped at higher levels compounded by retail traders s
post-image
SOL-0.74%
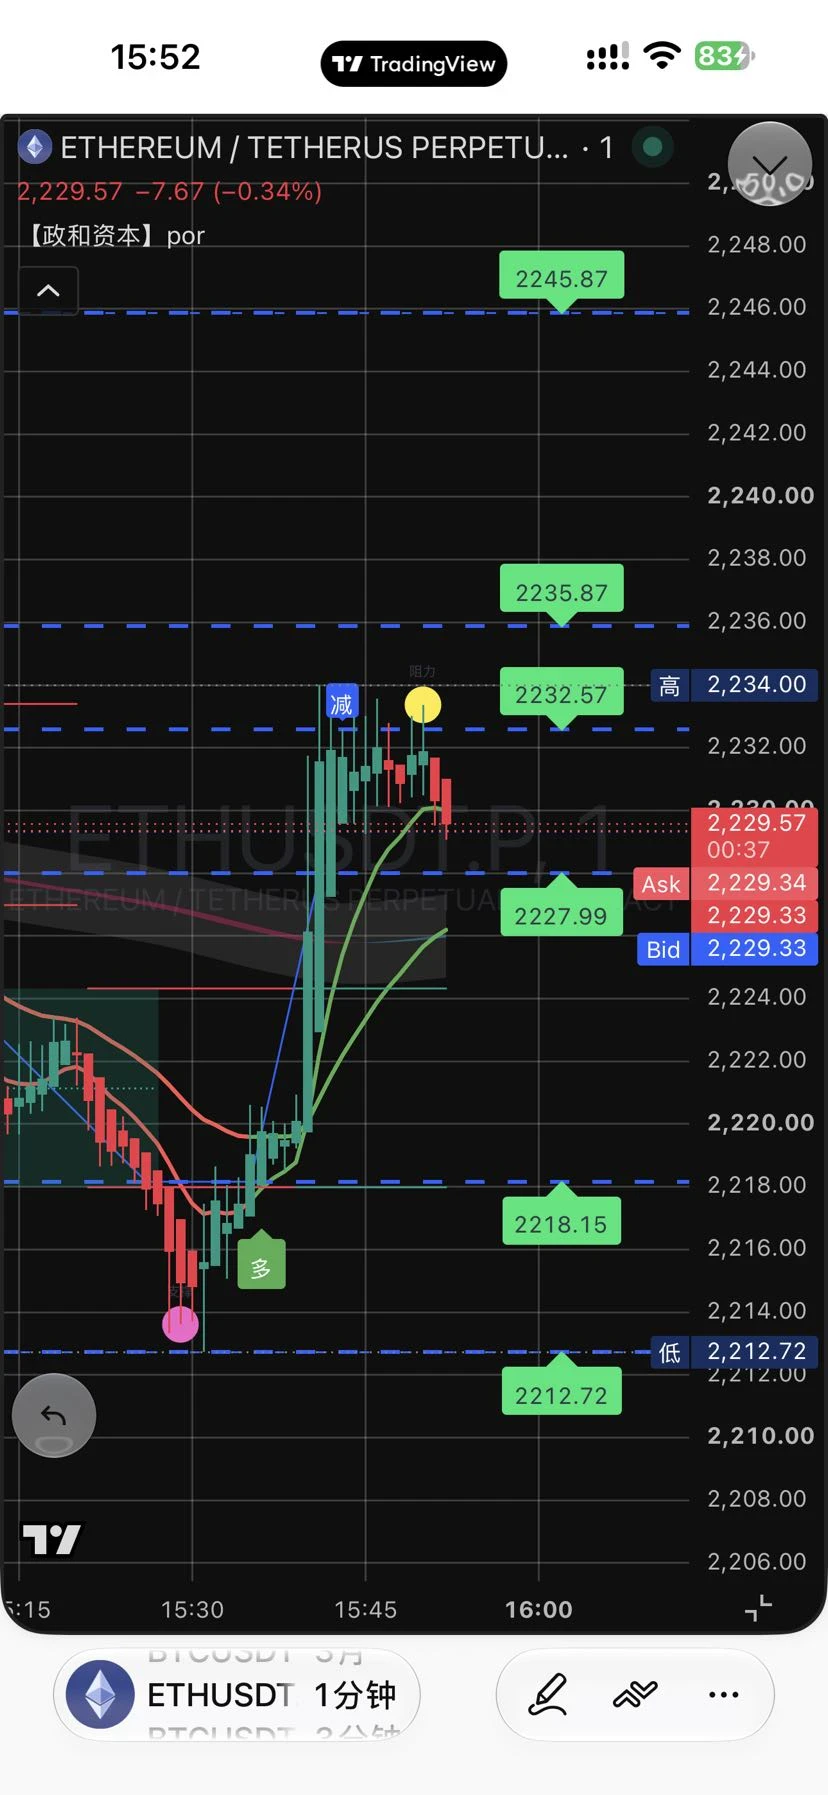
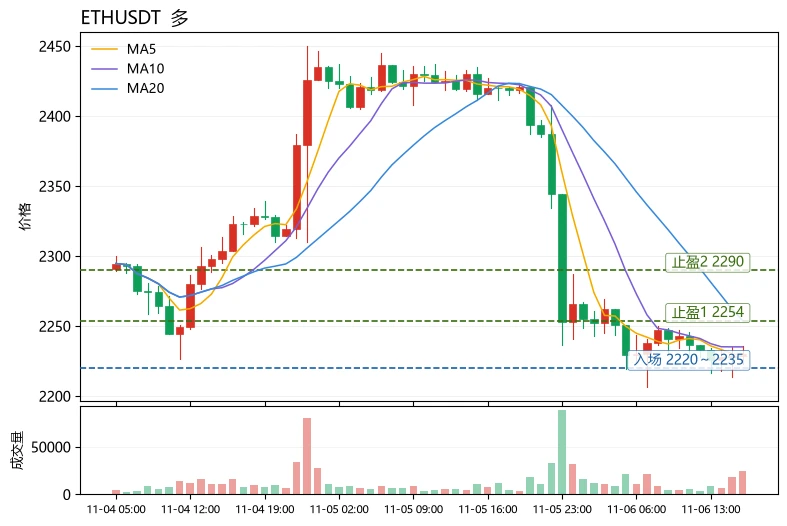
November 6, 2026 (Friday) ETH Futures Strategy for Today (based on the current range of approximately $2,220–$2,230)

Core view (bearish; cautious about rebounds)

ETH has quickly pulled back from around $2,420 to around $2,220, breaking recent support, with weak short-term momentum. Today, prioritize looking for a short if a rebound stalls, or consider going long only after a retest of lower support. Keep positions light.

Specific strategies

1. Shorting a rebound (primary strategy)

• Watch zone: $2,270–$2,320 (or near $2,350)

• Entry reference: Consider a small short if signs of s
post-image
ETH-1.23%
BTC-0.65%
Trenches
BTC
B
bade
b
BTC
C5xp...pump
Market Cap
$.
Change
.
24h Vol
$.
Holders
.
ZIG
Z
bade
b
ZIG
0x8c...1145
Market Cap
$.
Change
.
24h Vol
$.
Holders
.
GM
G
bade
b
GM
0x13...7777
Market Cap
$.
Change
.
24h Vol
$.
Holders
.
STONK
S
bade
b
STONK
6GmA...UNgx
Market Cap
$.
Change
.
24h Vol
$.
Holders
.
DESSA
D
bade
b
DESSA
npz2...pump
Market Cap
$.
Change
.
24h Vol
$.
Holders
.
Why Can You Be Right About the Market Yet Still Fail to Make Money?

One of the most frustrating things for traders in the cryptocurrency market is getting the direction right but still not making money in their account.

You expect Bitcoin to rise, and the price does; you think the market will pull back, and it does. But when you review your account, you find that your returns are disappointing or that you are still at a loss.

The problem may not be your directional call, but every detail of your trade execution.

First, your entry timing may be poor. Even if you correctly predict an upward
post-image
BTC-0.65%
$ICNT BOOM🤑🤑 The screen is about to burst, TP2 has already been hit haha, another big win. Guys, come check out the profit💸💸🙈🙈$UAI $AKE
post-image
ICNT-10.32%
UAI-7.58%
AKE+6.07%
  • 1
The more I read about the government shutdown, the more confused I get. Trump flat-out said that “the people getting laid off are all Democrats,” then added that a shutdown could “get rid of things we don’t want.” This isn’t budget negotiations—it’s using federal employees as bargaining chips. If the government really shuts down, data releases will be delayed and economic readings will go dark, sending market sentiment straight into fear. Retail investors are the ones most likely to get caught in the crossfire when there’s an information vacuum. What do you think?
post-image
  • 7
Global Investors Face Difficult Choices as Technology Shares Lose Their Momentum
live-cover
LIVE1,111
What Is a Trailing Stop? How Can You Protect Existing Profits Without Exiting a Trend Too Early?

In crypto trading, after prices rise, traders often face a dilemma: when should they take profit? Selling too early may mean missing further gains; holding on too long may allow existing profits to gradually evaporate. A trailing stop offers a way to dynamically manage exit levels, but it also has limitations.

First, what is a trailing stop?

A trailing stop is a strategy that adjusts the stop-loss level as the price moves favorably. For a long position, for example, as the price continues to ris
post-image
How Can You Tell When Market Conditions Have Changed? Which Signals Are Worth Watching, and Which Are Just Short-Term Noise?

In the previous article, we discussed a question: Why might a trading strategy that once worked gradually lose its edge?

One important reason is that market conditions have changed.

But the real challenge is this: Markets fluctuate every day. How do we know whether this is normal volatility or whether the market regime has actually changed?

If we react too slowly, we may continue using a strategy that is no longer suited to current market conditions.

If we react too
post-image
Gold has bounced back from the deep hole between 3650 and 3900. It looks like a shakeout, but if it can’t hold this level, it’s a false breakout. The lessons from getting trapped at the top twice are still fresh. For this to be a real breakout, it first has to clear the previous high. If you’ve been stopped out so many times that you’re afraid to set a stop-loss, think it over—what about you?
#Gold
If you’re watching, give it a follow.
post-image
GLDX-0.40%
PAXG+0.37%
XAU+0.38%
  • 4
  • 1
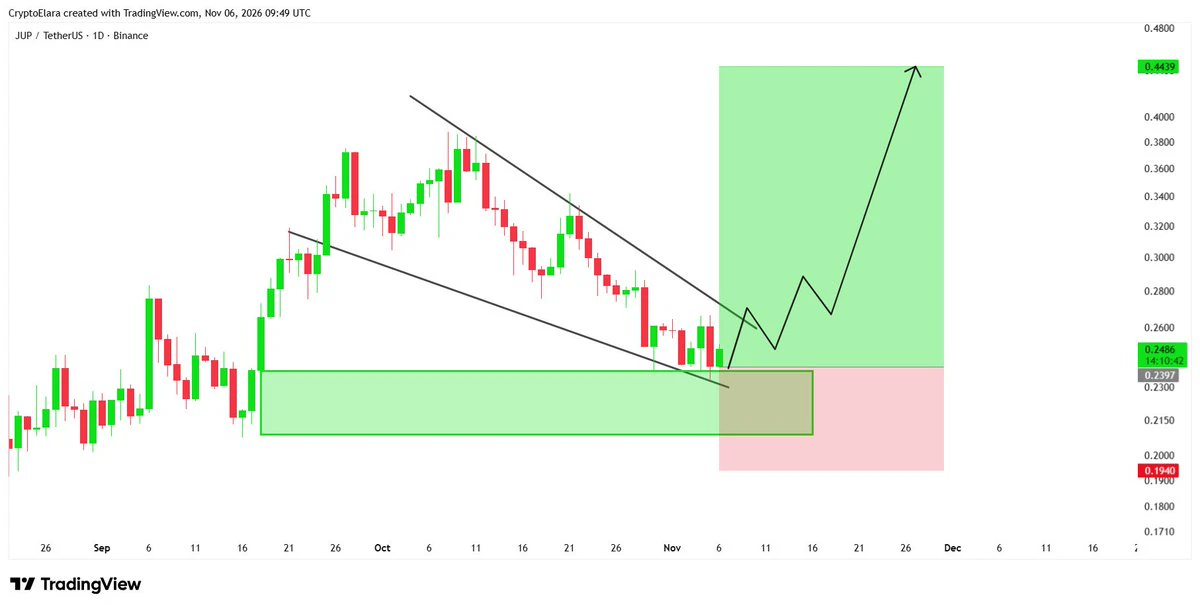
🚀 solana:JUPyiwrYJFskUPiHa7hkeR8VUtAeFoSYbKedZNsDvCN bouncing clean off key daily demand zone; structural breakout setup primed for massive upside expansion. 📈
post-image
SOL-0.77%
11.6BTC
URGENT NOTICE!!
Guys, we’ve got a three-part bullish divergence on the 15-minute chart. This run to 770 should be no problem, okay?
Get in at market price and go long now!!
Exit before the NFP, then short again!! Let’s take out both the longs and the shorts!
No one will help me reach for the clouds—I’ll trudge through the snow to the summit on my own!!
post-image
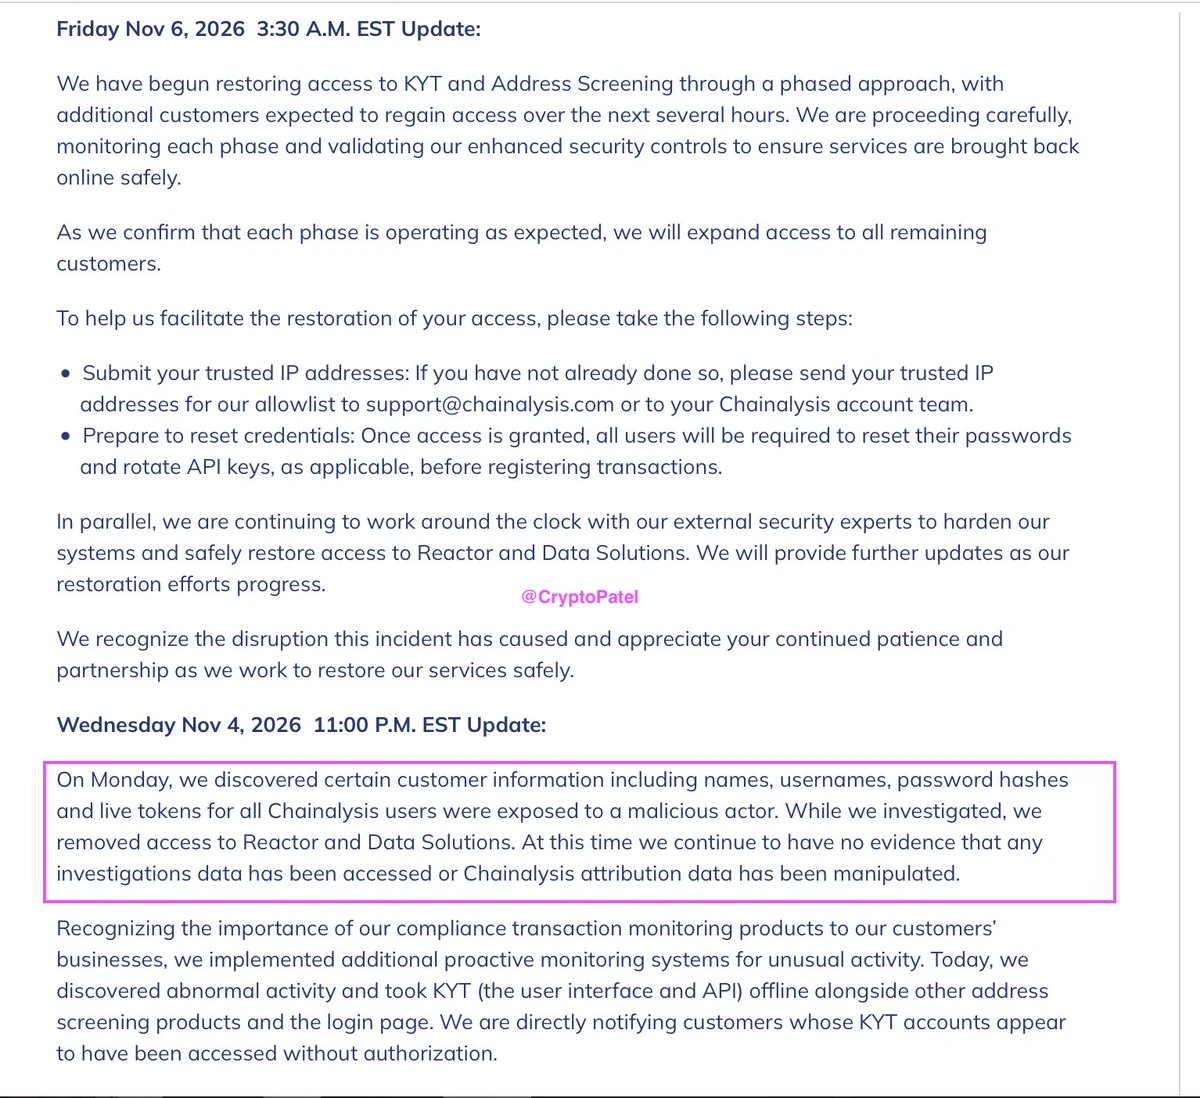
BREAKING: CHAINALYSIS BREACH JUST GOT MUCH WORSE!
One of crypto's leading blockchain intelligence firms has confirmed exposure of password hashes and valid authentication tokens belonging to its users.
👉 Customer names, emails & user IDs exposed.
👉 Password hashes & live authentication tokens compromised.
👉 Actual passwords exposed for a subset of users.
👉 Reactor, Data Solutions & KYT services disrupted.
Chainalysis says there's no evidence investigation data was accessed.
The company is forcing password resets and API key rotations.
A company trusted to investigate crypto crime is now de
post-image
$ETH Current price: 2230.75, down 7.99% in 24h, with a trading volume of 909.4M USDT; RSI at 29.4 has entered oversold territory, and the MACD histogram at +1.265 shows bullish momentum quietly building, but MA5=2229.21 remains below MA20=2254.11, so the trend has not reversed. The funding rate is positive at +0.0049%; with price plunging and the rate not falling, this indicates crowded shorts and longs passively holding losing positions, with funding not yet truly turning around. The Fear and Greed Index is at 28, in the fear zone; sentiment is bearish but nearing an extreme, increasing the
post-image
ETH-1.26%
DOGE-0.22%
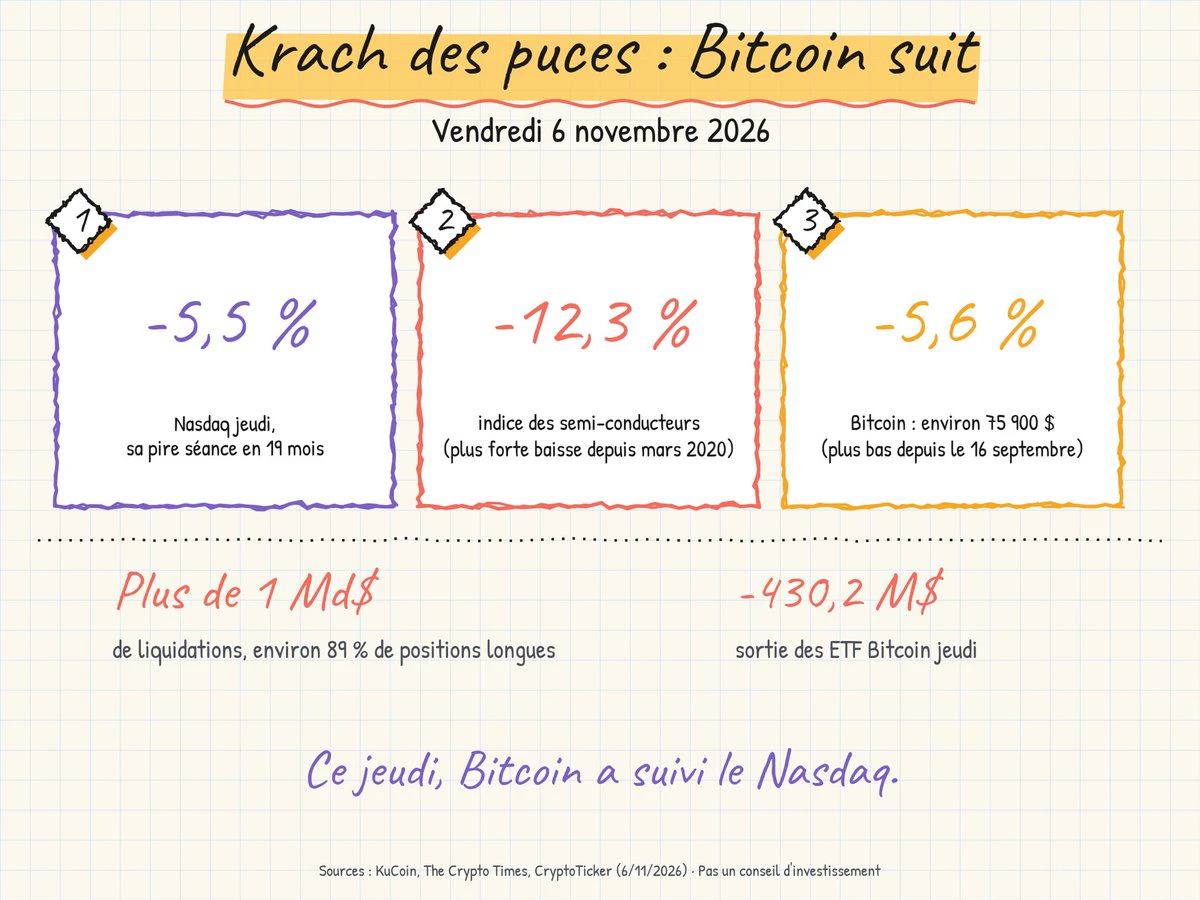
$BTC follows Wall Street’s decline.
→ Nasdaq: -5.5%
→ Semiconductors: -12.3%
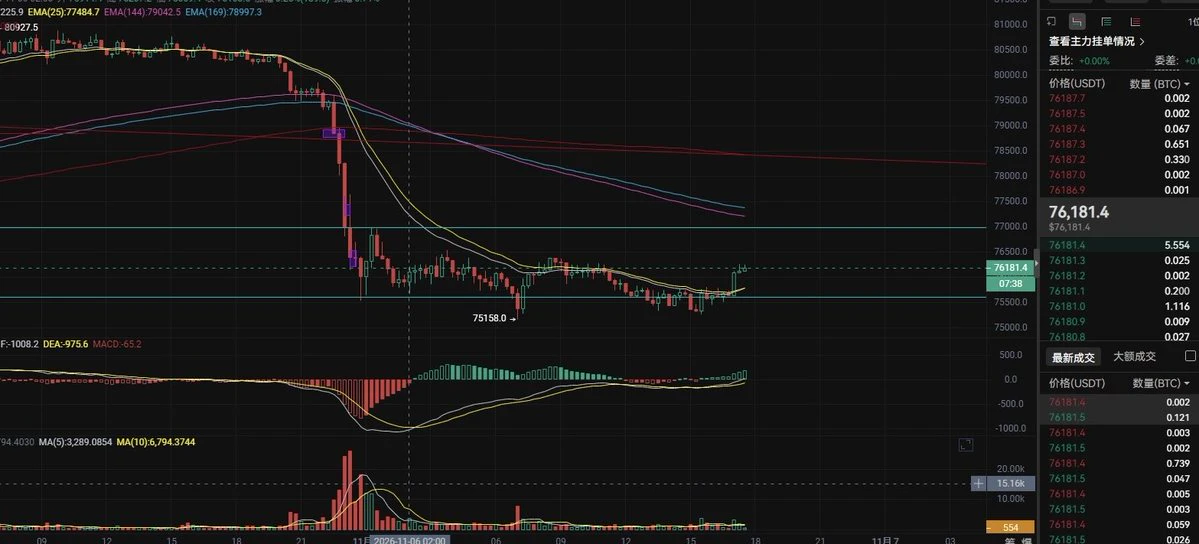
→ Bitcoin: -5.6% to $75,900
→ Liquidations: +$1B, 89% of which were longs
→ Bitcoin ETFs: -$430.2M
My analysis: when tech falters, Bitcoin comes under pressure too.
post-image
BTC-0.67%
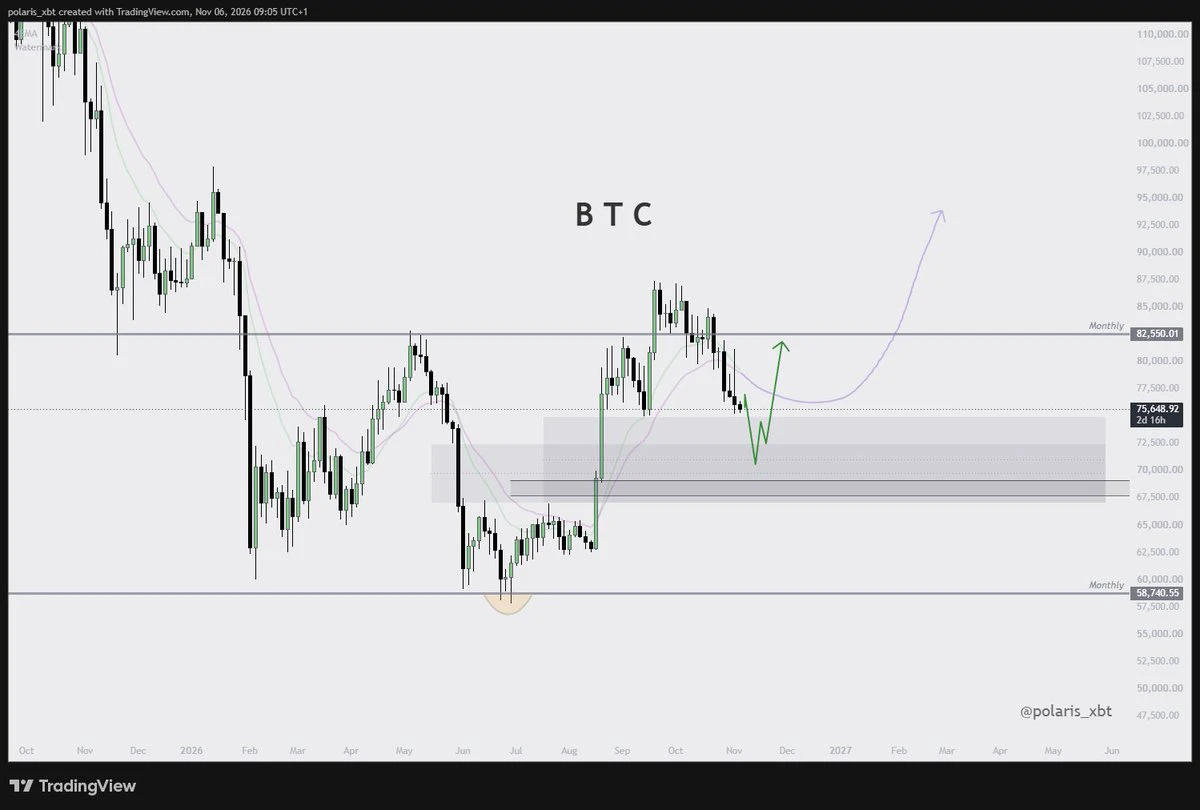
After this major pullback in the US stock market, I personally learned that you should always keep enough bullets on hand. Given the current market, anyone with cash on hand can make money no matter how they trade, and even if they get stuck holding a position, they won’t panic. Next, I’m going to look for a second buy opportunity in BTC and Ether. The daily charts are nearly there. Those of you with funds can start buying some spot. If you don’t have enough funds and trade futures, enter on the second buy with a 10% position. Brothers, don’t give up right before the bull market💰!$BTC #英伟达股价
post-image
BTC-0.65%
  • 1
[NEW STREAMER]MARKET UPDATE
live-cover
LIVE1,427
$BTC
Once people become certain we’re making new lows.
Once open interest has been completely wiped out.
Once we dive deep below the EMAs.
That’s when we start looking for swing longs.
This is a typical characteristic of a wave 2 in a fresh cycle.
The best entries feel the worst. Wave 2 is built to make you quit.
post-image
BTC-0.65%
The shift from green to red numbers on stock market screens is not the real news; the true story lies in the fundamental mental shift behind that red.

What unfolded in the U.S. markets on Thursday was not merely an ordinary sell-off, but a profound rupture in how the "artificial intelligence trade" is valued and how its risks are perceived. As the Nasdaq closed the day down 5.5%, the semiconductor index suffered its worst performance since 2020, plunging as much as 12% in a single session. Nvidia fell 9%, AMD and Micron dropped 17% each, and Qualcomm slid 12%—altogether, approximately $2.5 t
NDAQ-2.63%
NVDA-9.33%
AMD-17.64%
MU-17.23%
QCOM-9.69%
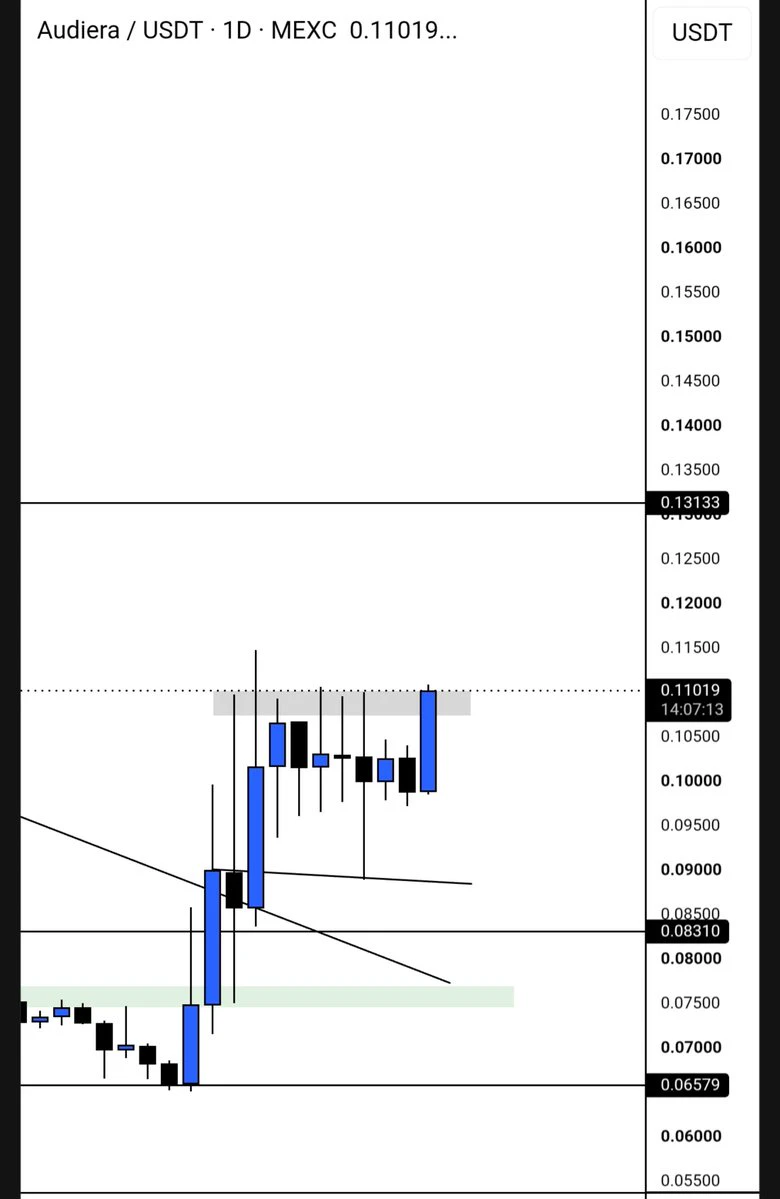
#Beat $Beat usdt Is Trying to break out here tps are 0.13 and 0.19
post-image
BEAT-1.19%
Load More

Join 40 M users in our growing community

⚡️ Join 40 M users in the crypto craze discussion

💬 Engage with your favorite top creators

👍 See what interests you

Trending Topics

USStocksFaceHistoricSelloff

4.79k Views3.65k Discussing

U.S. stocks suffered a sharp selloff on Thursday, with the Nasdaq closing down more than 5% and the Philadelphia Semiconductor Index falling over 12%. AI and chip stocks including $NVDA and $AMD were hit especially hard. Markets are reassessing AI valuations, data-center spending and future returns. Is this just short-term deleveraging, or the start of a deeper correction in the AI trade? Which sectors are you watching next?

GateLaunchesPoSECProofOfSecurity

14.95k Views594 Discussing

USNonfarmPayrolls

13.18k Views4.05k Discussing

View More