#CoinDeskRevealsGateRWAPerpetualsTop3Globally
GATE’S RWA PERPETUALS BREAKOUT: A 158% MONTHLY SURGE IS HARD TO IGNORE
The most interesting development in the latest RWA derivatives data is not simply that Gate is growing. It is how quickly Gate is gaining market share while the broader market remains relatively calm.
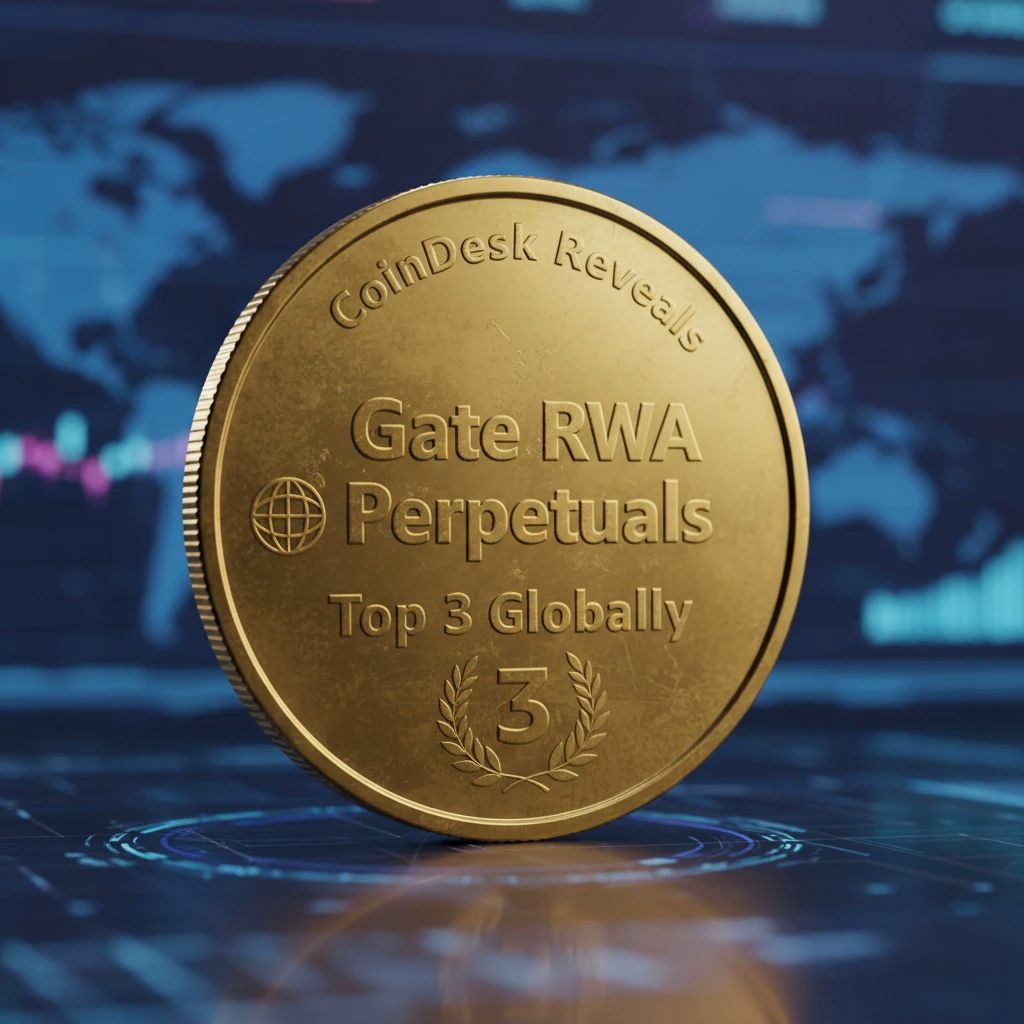
According to CoinDesk’s August exchange review, Gate’s RWA perpetuals volume reached approximately $64.7 billion, representing a remarkable 158% increase from the previous month.
At the same time, Gate’s market share climbed to 12.6%, more than doubling and pushing the exchange into the global top three for RWA perpetuals.
That is a significant shift.
What makes the numbers even more interesting is the contrast with the overall market. The broader RWA perpetuals sector grew only modestly during August, while Gate’s volume expanded dramatically. In other words, Gate was not simply benefiting from a rapidly expanding market. It was capturing a larger portion of the existing flow.
Why Does This Matter?
RWA perpetuals sit at an important intersection between traditional markets and crypto-native trading.
Instead of limiting traders to traditional crypto assets, RWA perpetuals can provide exposure to instruments linked to areas such as equities and commodities through a perpetual trading structure.
This creates a completely different opportunity set for active traders.
When major traditional-market names experience large price movements, traders increasingly want the ability to react quickly, manage positions efficiently and access markets from the same trading environment they already understand.
This is where liquidity becomes extremely important.
A platform can list hundreds of markets, but listings alone do not guarantee success. Traders ultimately care about execution, liquidity, spreads, depth and the ability to enter or exit positions during volatile conditions.
Gate’s August numbers suggest that its RWA offering is attracting meaningful trading activity on that front.
The Bigger Derivatives Picture
The RWA performance also becomes more significant when viewed alongside Gate’s broader derivatives business.
During August, Gate reportedly processed around $287 billion in total derivatives volume, placing it fourth globally.
That tells me the RWA growth should not necessarily be viewed as an isolated product story.
Instead, it appears to be developing within a much larger derivatives ecosystem.
There is also a natural network effect in derivatives markets.
More traders create more liquidity. More liquidity can improve execution. Better execution can attract additional traders. That cycle can gradually strengthen a trading venue’s position.
Why RWA Could Become Bigger
The tokenization of traditional assets is no longer just a theoretical concept.
As blockchain infrastructure develops, the boundary between traditional financial markets and digital-asset markets continues to become less rigid.
Equities, commodities and other real-world exposures can increasingly become part of the same broader trading conversation as Bitcoin, Ethereum and other crypto assets.
That creates a potentially powerful long-term market.
However, one month of exceptional growth does not guarantee that Gate will permanently remain in the top three.
Competition will remain intense, new products will launch and market conditions can change quickly.
For me, the most important numbers to watch next are RWA open interest, trading volume, market share and liquidity consistency.
If Gate can maintain a meaningful share after such a dramatic August expansion, then the 158% monthly increase could prove to be more than a temporary spike.
It could be evidence of a much larger shift:
RWA trading is becoming a serious part of the global derivatives market, and Gate appears to be positioning itself directly in the middle of that transition.
#weeklyshare @Gate_Square #GateSquare #ShareWeekly #每周来晒
GATE’S RWA PERPETUALS BREAKOUT: A 158% MONTHLY SURGE IS HARD TO IGNORE
The most interesting development in the latest RWA derivatives data is not simply that Gate is growing. It is how quickly Gate is gaining market share while the broader market remains relatively calm.
According to CoinDesk’s August exchange review, Gate’s RWA perpetuals volume reached approximately $64.7 billion, representing a remarkable 158% increase from the previous month.
At the same time, Gate’s market share climbed to 12.6%, more than doubling and pushing the exchange into the global top three for RWA perpetuals.
That is a significant shift.
What makes the numbers even more interesting is the contrast with the overall market. The broader RWA perpetuals sector grew only modestly during August, while Gate’s volume expanded dramatically. In other words, Gate was not simply benefiting from a rapidly expanding market. It was capturing a larger portion of the existing flow.
Why Does This Matter?
RWA perpetuals sit at an important intersection between traditional markets and crypto-native trading.
Instead of limiting traders to traditional crypto assets, RWA perpetuals can provide exposure to instruments linked to areas such as equities and commodities through a perpetual trading structure.
This creates a completely different opportunity set for active traders.
When major traditional-market names experience large price movements, traders increasingly want the ability to react quickly, manage positions efficiently and access markets from the same trading environment they already understand.
This is where liquidity becomes extremely important.
A platform can list hundreds of markets, but listings alone do not guarantee success. Traders ultimately care about execution, liquidity, spreads, depth and the ability to enter or exit positions during volatile conditions.
Gate’s August numbers suggest that its RWA offering is attracting meaningful trading activity on that front.
The Bigger Derivatives Picture
The RWA performance also becomes more significant when viewed alongside Gate’s broader derivatives business.
During August, Gate reportedly processed around $287 billion in total derivatives volume, placing it fourth globally.
That tells me the RWA growth should not necessarily be viewed as an isolated product story.
Instead, it appears to be developing within a much larger derivatives ecosystem.
There is also a natural network effect in derivatives markets.
More traders create more liquidity. More liquidity can improve execution. Better execution can attract additional traders. That cycle can gradually strengthen a trading venue’s position.
Why RWA Could Become Bigger
The tokenization of traditional assets is no longer just a theoretical concept.
As blockchain infrastructure develops, the boundary between traditional financial markets and digital-asset markets continues to become less rigid.
Equities, commodities and other real-world exposures can increasingly become part of the same broader trading conversation as Bitcoin, Ethereum and other crypto assets.
That creates a potentially powerful long-term market.
However, one month of exceptional growth does not guarantee that Gate will permanently remain in the top three.
Competition will remain intense, new products will launch and market conditions can change quickly.
For me, the most important numbers to watch next are RWA open interest, trading volume, market share and liquidity consistency.
If Gate can maintain a meaningful share after such a dramatic August expansion, then the 158% monthly increase could prove to be more than a temporary spike.
It could be evidence of a much larger shift:
RWA trading is becoming a serious part of the global derivatives market, and Gate appears to be positioning itself directly in the middle of that transition.
#weeklyshare @Gate_Square #GateSquare #ShareWeekly #每周来晒