Square
Following
Hot
News
Notifications
Profile
Share your thoughts
placeholder
Article
$VVV is showing a clear recovery, with short-term buying becoming active again.
My long setup: entry range at .1206–$24.3940, target at $25.7609, stop at 23.0271
From the chart, as long as $VVV holds 23.7110, the bullish structure will remain intact; a break above 24.5190 could open the way for a further move toward 27.1278.
$VVV SOL AKE
Risk warning: The above reflects only my personal market view and is not investment advice. Contract trading is highly volatile, so be sure to manage position sizes and stop losses.
post-image
24
2424
Pump.Fun
MC:$3.14KHolders:2
26.19%
VVV+0.37%
$XCU ‌
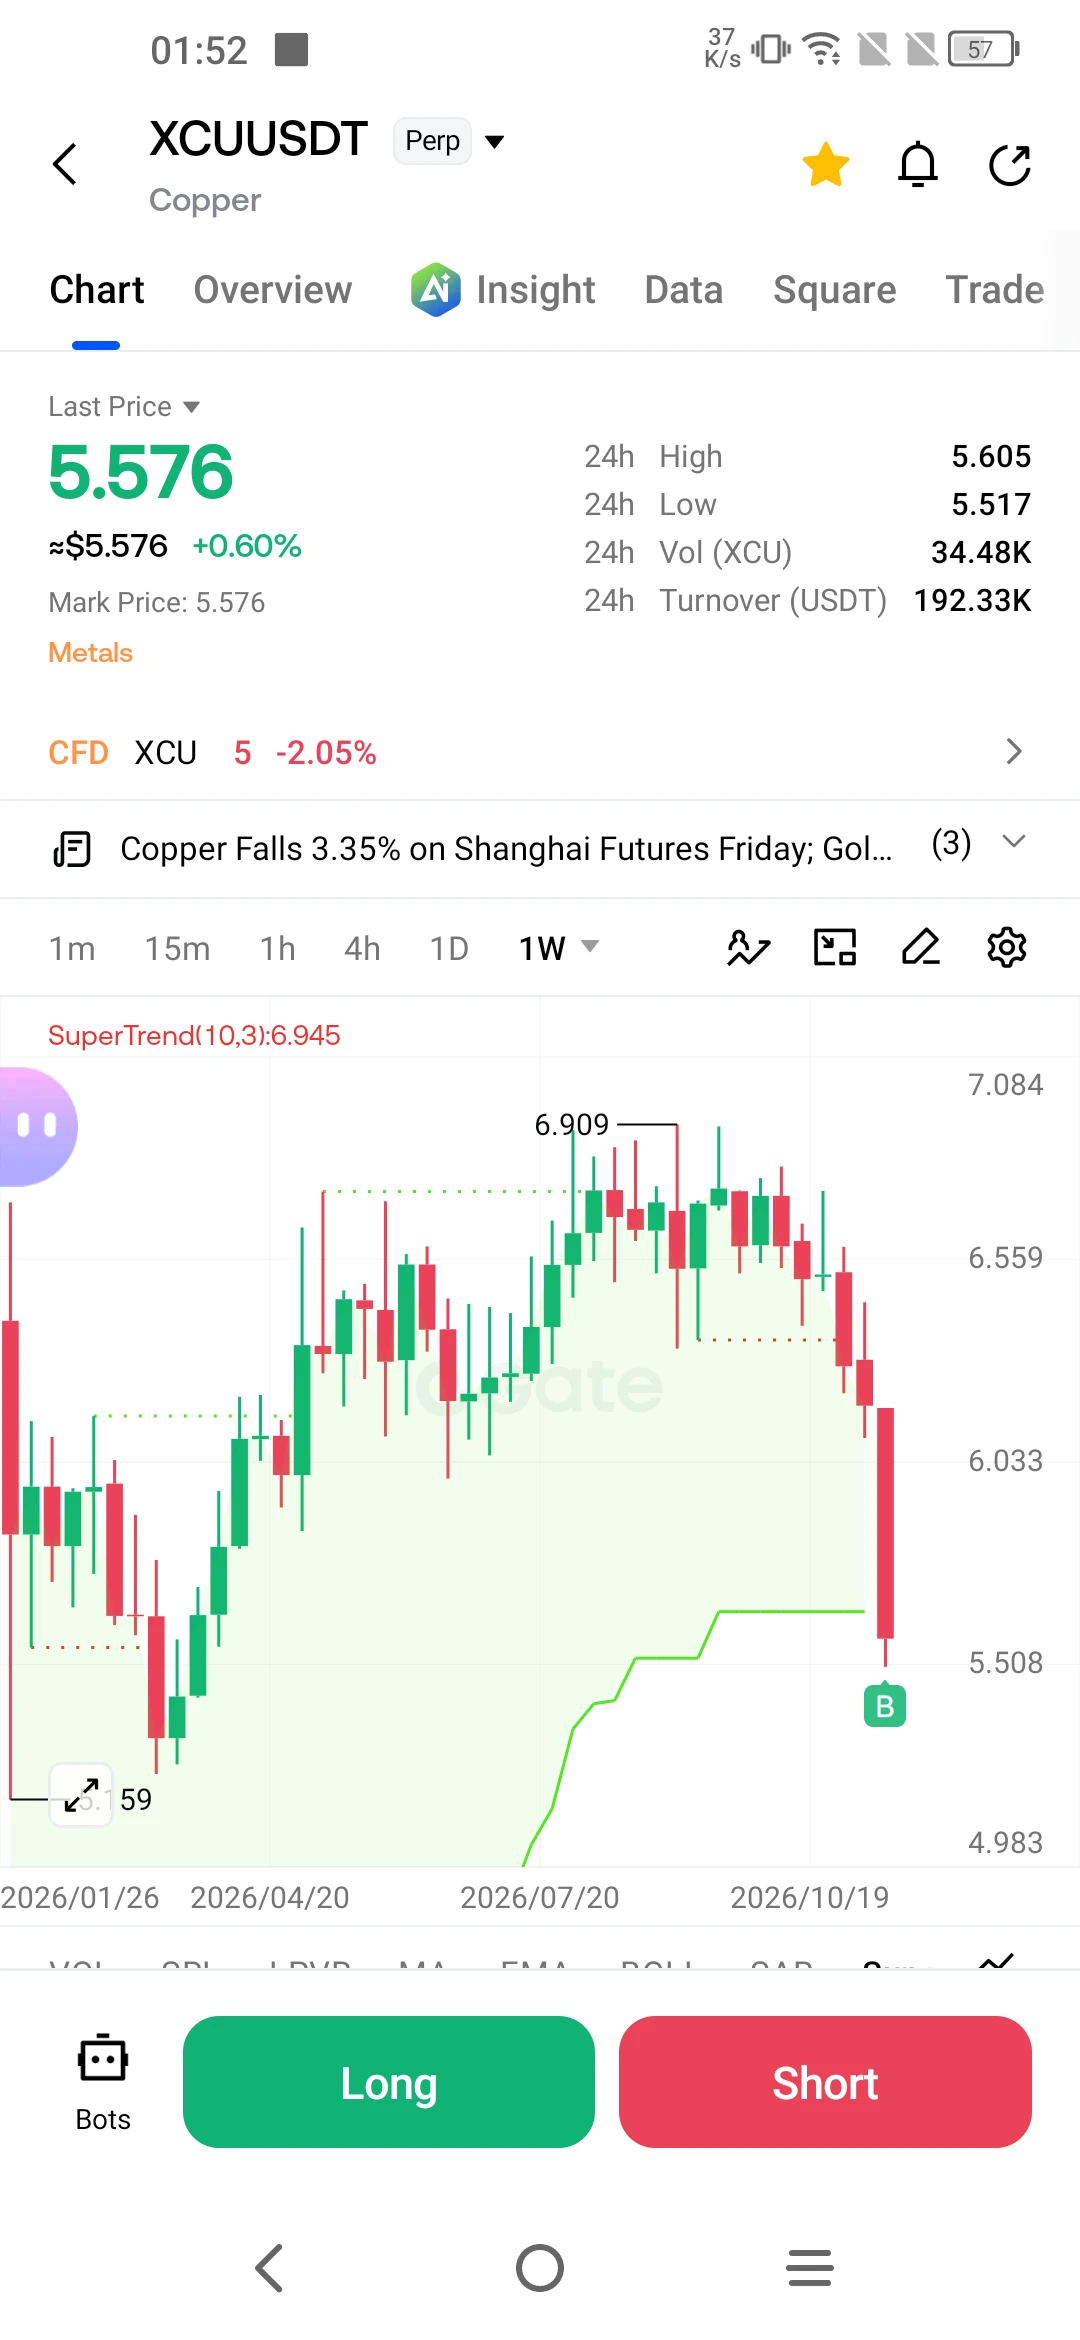
The copper market is being shaken with a speed and intensity not seen in a long time. Futures have shed more than 9% this week, marking their worst weekly performance since 2026. As clearly illustrated on the chart, prices have retreated from a peak of $6,909 to the $5,500 range. Having hit record highs in September—driven by expectations of massive demand for cabling for artificial intelligence (AI) data centers—prices are now under severe pressure as that same narrative unravels.

So, what lies behind this sudden collapse? In essence, the market is repricing the AI story, with overly
post-image
XCU+0.20%
  • 4
  • 1
Trenches
IDOL
I
bade
b
IDOL
0x3b...ab07
Market Cap
$.
Change
.
24h Vol
$.
Holders
.
PIEVERSE
P
bade
b
PIEVERSE
0x0e...25a9
Market Cap
$.
Change
.
24h Vol
$.
Holders
.
FIONA
F
bade
b
FIONA
B34n...pump
Market Cap
$.
Change
.
24h Vol
$.
Holders
.
Singularity
S
bade
b
Singularity
7R4M...pump
Market Cap
$.
Change
.
24h Vol
$.
Holders
.
CLAUDIA
C
bade
b
CLAUDIA
2j5S...W2ZM
Market Cap
$.
Change
.
24h Vol
$.
Holders
.
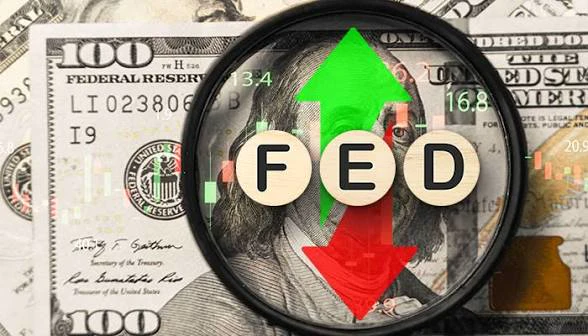
Last Friday, November 20, Fed Governor Lisa Cook delivered a clear message to the market: "I do not see sufficient evidence that inflation is returning to the target, and we do not have the luxury of waiting." Cook, who was one of two officials to vote for a rate hike at the October meeting—arguing that the 25-basis-point increase in September was insufficient—has now raised the prospect of a "more aggressive tightening cycle," going beyond the rate hike the market already considers a certainty for December.

Persistence Beyond Expectations

The most striking point in Cook’s remarks is that in
post-image
BTC-0.67%
GT-2.41%
ETH-1.26%
ZEC+1.16%
PEPE+0.97%
  • 4
  • 3
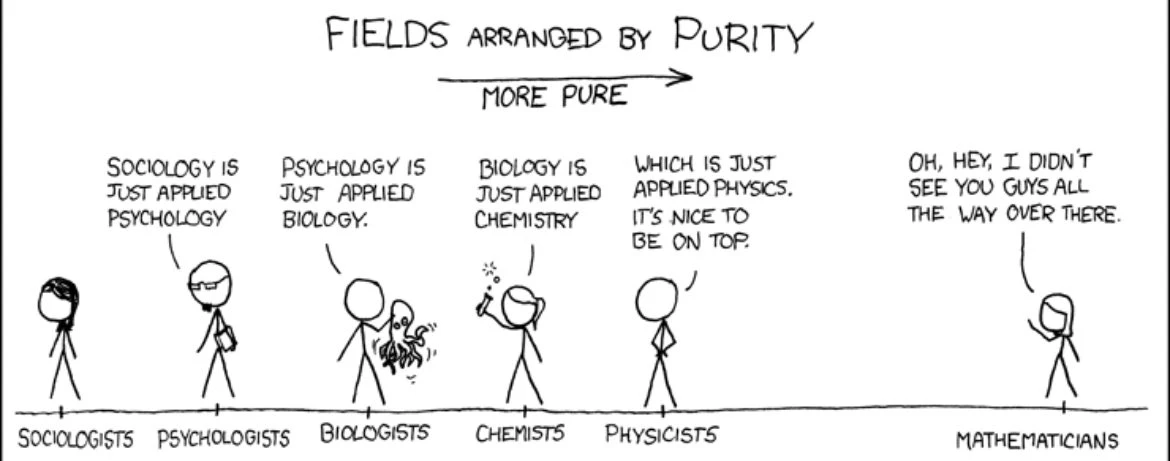
Mathematicians getting dropped a peg or two😂😂😂
post-image
$IDOL This rally looks like luck, but it was really an opportunity that had been lying in wait for a long time. The name is clever, and the price action delivered too, hitting 0.048 with pinpoint accuracy, like a tailor-made starting point. It surged +50.13%, leaving little time for anyone to hesitate.
$IDOL The contract tag is still there; the story has only just begun.
Risk warning: The above reflects personal views only and does not constitute investment advice. The crypto market is highly volatile, so please be sure to manage risk.
post-image
IDOL-6.71%
EVAA | Long 🟢 | Bullish | 15m24h: +7.97% | Volume: 322.3M USDTLong rationale: Price above EMA200; EMA20/50/200 in bullish alignment; RSI14 at 60.6; MACD histogram positive; ADX14 at 18.5; volume at 0.69x the 20-candle average; trend pullback/continuation. Entry: 6.4238Stop loss: 6.26472Take profit 1: 6.62265 | Take profit 2: 6.74197 | Take profit 3: 6.90105For reference only; do not chase price. This strategy is invalidated if the stop-loss level is hit. Technical analysis strategy only, not investment advice.$EVAA
post-image
EVAA-0.49%
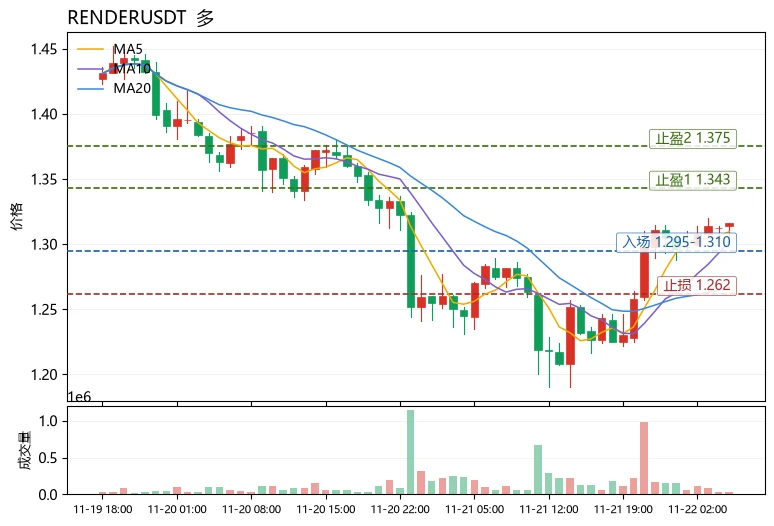
Fear and Greed Index is only 12, and the market is in the extreme fear zone, yet $RENDER bucked the trend and rose 3.62%—this divergence is the most unusual detail in today's market. Funds are not pulling out amid fear, suggesting bulls are quietly accumulating.
Technically, $RENDER is currently at 1.316, with MA5=1.3096 above MA20=1.2666, indicating a bullish short-term moving average alignment; RSI=59.0 is strong but not overbought, while the MACD histogram at +0.009781 maintains bullish momentum. The upper Bollinger Band at 1.34351 is the immediate resistance, and the price is trading near
post-image
RENDER+0.47%
DODO+11.43%
RARE-0.89%
$XRP The current 1-hour and 4-hour trends are showing a clear divergence. The 1-hour timeframe is bullish, with the RSI as high as 74.12, while the 4-hour timeframe is bearish, with the RSI at just 39.37. Short-term traders may see a strong uptrend, while investors focused on longer timeframes may think the market remains under downward pressure. This divergence makes the current trend difficult to assess, especially with the price already nearing the 1-hour resistance level of 0.9389.
I would choose to wait at this level, as chasing a long position carries significant risk. The current price
post-image
XRP-1.15%
Towards the end of the week, something interesting unfolded in the markets. While stocks faced a sharp sell-off, the bond market moved in the opposite direction. The yield on the 10-year U.S. Treasury note fell by more than 10 basis points to 4.948%, while the 2-year Treasury yield dropped by over 13 basis points to 4.647%. In short, capital fleeing the stock market sought a "safe haven"—and it found one in bonds.

Why is this surprising? Because, typically, the expectation of a Federal Reserve interest rate hike pushes bond yields higher. Indeed, the market still views a rate hike in December
BTC-0.67%
GT-2.41%
SOL-0.77%
IDOL-6.71%
4STOCK-3.94%
  • 2
  • 1
#CookBacksFurtherRateHikes
The Fed's Hawkish Warning Could Change the Entire Market Outlook: Bitcoin, Tech Stocks and Gold Face a New Challenge

The Federal Reserve's inflation battle is entering another critical phase, and the latest comments from Governor Lisa Cook have introduced a fresh source of uncertainty across global financial markets.

On November 20, Cook questioned whether September's 25-basis-point rate increase would be sufficient to bring inflation under control. Her warning was particularly important because she highlighted the potential consequences of delaying further action
post-image
BTC-0.65%
MU-13.88%
ANT-8.68%
  • 3
  • 1
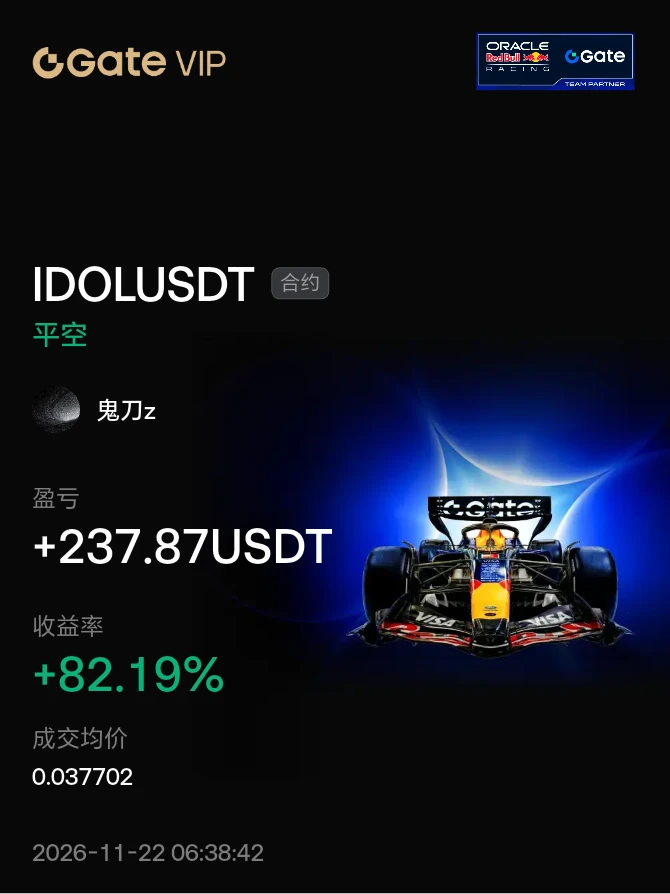
#晒出我的合约收益
Take a small bite of IDOL
Seize the opportunity$ANT #IDOL
post-image
ANT-8.68%
  • 4
  • 1
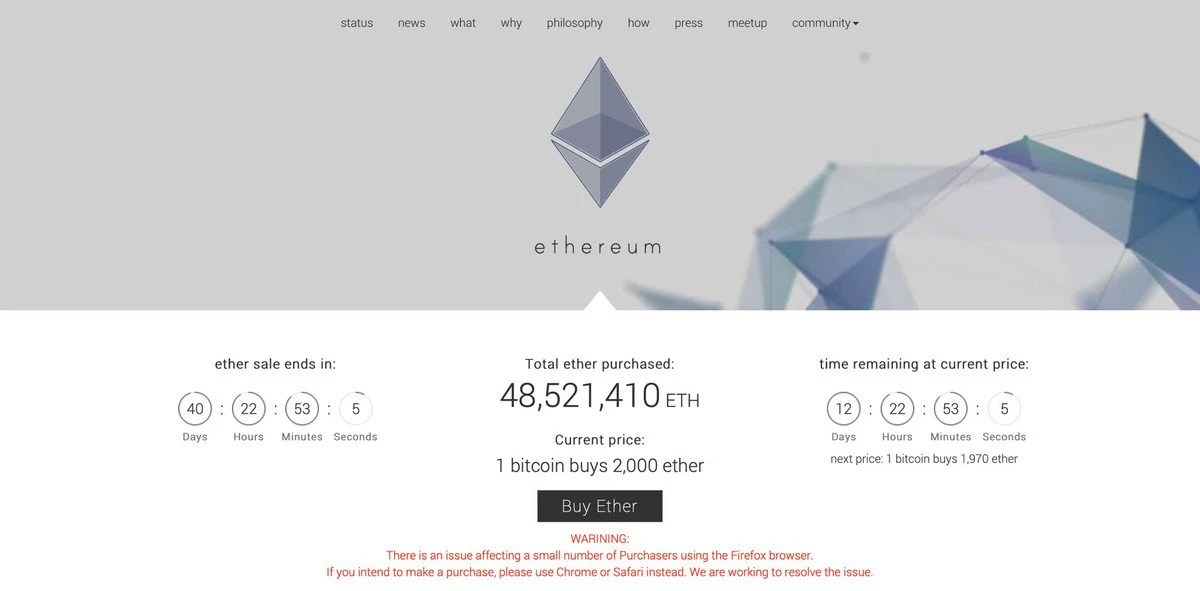
POV:
It’s 2014.
Ethereum is holding its ICO at $0.31 per ETH.
You can purchase up to 2,000 ETH.
post-image
ETH-1.26%
#NvidiaDropsNearly14Percent #ShareWeekly
Nvidia has attracted significant attention across global financial markets following a nearly 14% decline in its share price. As one of the most influential companies in the artificial intelligence industry, Nvidia plays a central role in the development of advanced computing, data centers, and AI infrastructure. Its recent decline has raised important questions about investor confidence, technology stock valuations, and the sustainability of the AI investment boom. Because Nvidia is widely viewed as a leading indicator of the broader AI sector, weaknes
NVDA-13.84%
AMD-13.27%
NDAQ-0.95%
#黄金逼近3500美元关口
Gold at $3,538: The $3,500 Support Battle Could Decide the Next Major Move

Gold is approaching a critical turning point after an aggressive selloff pushed prices toward $3,500. The latest available spot-market quote stands near $3,537.90 per ounce, following a session decline of approximately 2.38%. The metal traded as low as $3,502, bringing the market dangerously close to breaking an important psychological threshold.

What makes this decline particularly significant is that gold is experiencing selling pressure despite broader financial market uncertainty. This reflects a ma
XAU+0.38%
  • 1
  • 1
Nvidia intetim ceo colltte kres faces a ......
live-cover
LIVE32
ETH-1.26%
BTC-0.67%
SOL-0.77%
USDC+0.01%
$FET — Short entry: 0.1100 Take-profit 1: 0.1089 Take-profit 2: 0.1078 Stop-loss: 0.1144 FET is slowly trending lower, while overall market trading remains notably subdued. Without higher volume driving the decline, the slow slide could easily level off here.
post-image
FET-1.52%
Real and strong communities will be fine, I'm not worried bout them
Fear your fake coins...
Zero
post-image
$ENA Cycle Divergence: 1-Hour Strength, 4-Hour Weakness—Which Will Shift First?
Currently, $ENA is at 0.0989 USDT, down 0.60% over 24 hours, with a range of 0.0897–0.1002. The 1-hour trend is bullish, with support at 0.0897 and resistance at 0.1; the 4-hour trend is bearish, with support also at 0.0897 and resistance at 0.1181. The two timeframes give opposing signals, and the direction is still being contested.
The 1-hour RSI is 75.6, already in overbought territory, and EMA20 at 0.09770221 is below the price; the 4-hour RSI is 37.8, indicating weakness, and EMA20 at 0.10242771 is above the
post-image
ENA+8.04%
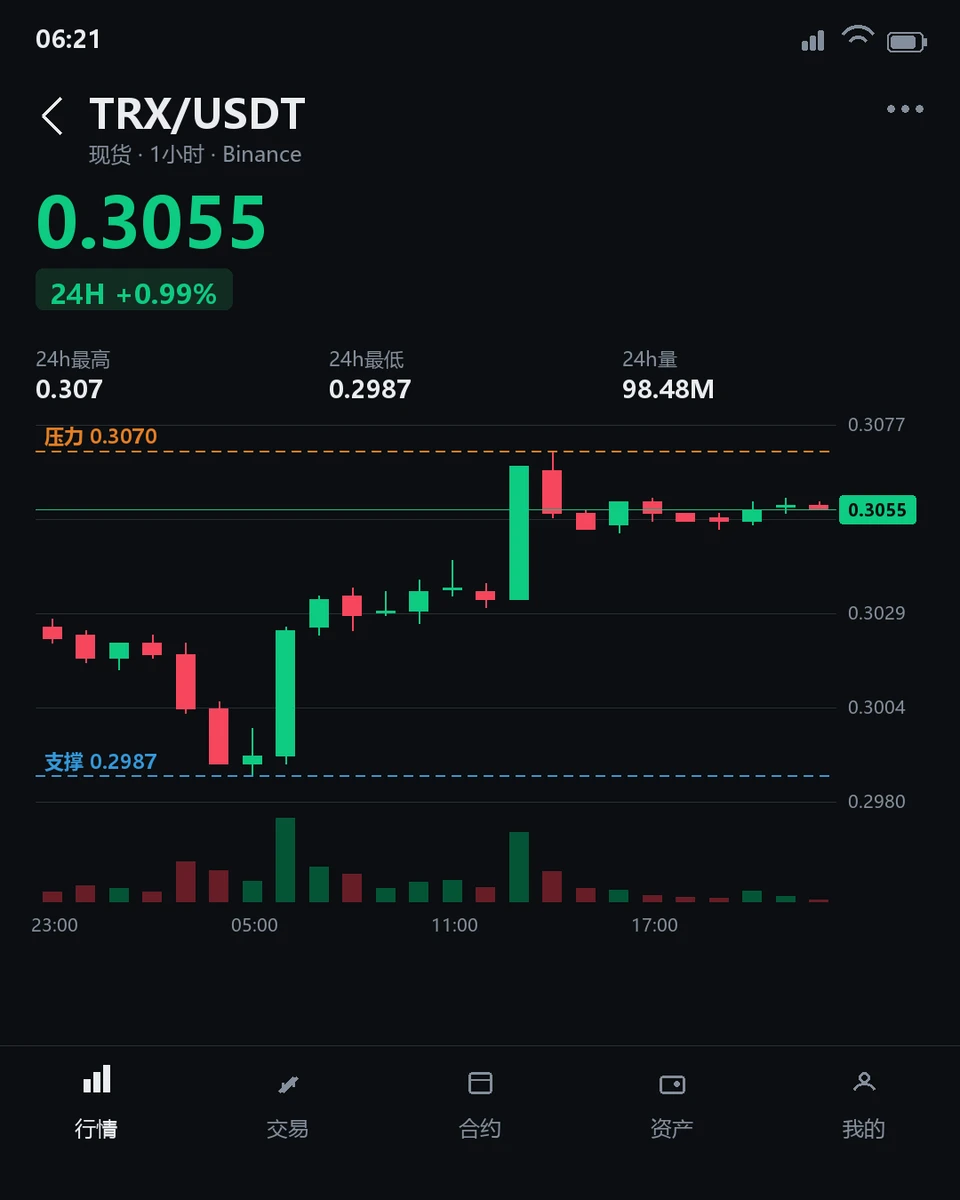
$TRX Is Strong in the Short Term but Weak on the 4-Hour Chart—Which Will Turn First?
$TRX is currently trading at 0.3055, up 0.958% over the past 24 hours, with an intraday range of 0.2987–0.307. The 1-hour chart shows strength, with the price above the EMA20 at 0.30456. The RSI14 is 67.53, in neutral-to-bullish territory, but the volume ratio is just 0.21, far below average, indicating limited participation from short-term buyers. The 4-hour chart remains weak: the price is still below the EMA20 at 0.30594, and the RSI14 at 37.21 has yet to recover from weak territory. Resistance is far above
post-image
TRX+0.42%
Load More

Join 40 M users in our growing community

⚡️ Join 40 M users in the crypto craze discussion

💬 Engage with your favorite top creators

👍 See what interests you

Trending Topics

BTCBreaksBelow60K

2.1M Views30K Discussing

BTC fell below $60,000 on November 20 for the first time since July, alongside a tech stock selloff and broader pressure on risk assets. Will $60K become resistance, or can BTC quickly reclaim it? What price or volume signals would convince you that selling pressure is easing?

GateDirectIPOPhase3ANTAllocates92100Shares

797.2K Views4.9K Discussing

NvidiaDropsNearly14Percent

333.9K Views7.6K Discussing

View More