

Share your thoughts
placeholder
Article
For ZEC, shorting around 1200-1230 seems more suitable—a particularly slick altcoin.
post-image
ZEC+2.62%
Live Crypto Market Watch | BTC, ETH & Altcoins
live-cover
LIVE1,278
As liquidity rotates heavily across the Solana and multi-chain meme sectors during the **#GateMeme** event, **Pudgy Penguins ($PENGU )** stands out as a prime, high-utility contender. Backed by a globally recognized Web3 consumer brand with major retail presence, $PENGU bridges real-world culture with explosive meme market dynamics.
📊 𝐊𝐞𝐲 𝐌𝐞𝐭𝐫𝐢𝐜𝐬
• Current Price: ~$0.00728
• Market Capitalization: ~$450 Million
• 24H Trading Volume: ~$94.0 Million
• Circulating Supply: ~62.86 Billion PENGU
• Primary Chain: Solana (Multi-chain cross-liquidity)
• Market Bias: Neutral-Bullish / Base Ac
post-image
PENGU-0.75%
#AMD$AMD
AMD's Two Trillion Dollar Bet: The Quiet Architecture of the AI Economy
There is a particular kind of ambition that reveals itself not in a single announcement, but in the steady accumulation of agreements that, taken together, describe a different future. Over the past twelve months, Advanced Micro Devices has assembled exactly that kind of portfolio. The company has secured multi-gigawatt commitments from three of the most consequential names in artificial intelligence: OpenAI, Meta, and Anthropic. And at a conference in New York earlier this month, its chief financial officer, Jean
User_any
#AMD$2TAI2030
AMD's Two Trillion Dollar Bet: The Quiet Architecture of the AI Economy
There is a particular kind of ambition that reveals itself not in a single announcement, but in the steady accumulation of agreements that, taken together, describe a different future. Over the past twelve months, Advanced Micro Devices has assembled exactly that kind of portfolio. The company has secured multi-gigawatt commitments from three of the most consequential names in artificial intelligence: OpenAI, Meta, and Anthropic. And at a conference in New York earlier this month, its chief financial officer, Jean Hu, placed a number on what that portfolio might ultimately be worth: a total addressable market of between two and three trillion dollars by 2030.
That figure deserves to be read carefully. It is not a revenue forecast. It is an estimate of the size of the opportunity AMD believes it can address. But the distinction matters less than the trajectory it describes. In July, AMD estimated its addressable market would reach roughly two trillion dollars by the end of the decade. Two months later, it raised the upper bound to three trillion. When a company revises its view of its own opportunity upward by fifty percent in a single quarter, it is telling you something about the pace at which the ground beneath it is shifting.
The numbers behind the business are already moving quickly. In the second quarter of 2026, AMD reported total revenue of 11.5 billion dollars. Data center revenue alone reached 6.72 billion dollars, more than double the 3.2 billion dollars generated in the same period a year earlier, and up from 5.8 billion dollars in the prior quarter. That segment now accounts for fifty-eight percent of total revenue, and it is growing at a pace that has made it the largest and fastest-moving part of the company. The demand is coming from two sources: EPYC processors for server CPUs and Instinct accelerators for AI training and inference. Both are benefiting from the same underlying trend, which is the relentless expansion of computing infrastructure required to train and run increasingly capable models.
The customer agreements tell the story more vividly than the revenue figures alone. OpenAI has signed a six-gigawatt commitment, with the first gigawatt of MI450 GPUs scheduled for deployment in the second half of 2026. Meta has signed a comparable six-gigawatt agreement, covering multiple generations of Instinct accelerators. Anthropic has committed to deploying up to two gigawatts of MI450 GPUs through AMD's Helios rack-scale systems, and AMD is investing up to five billion dollars into the company as part of the arrangement. Taken together, these agreements represent twelve gigawatts of committed GPU capacity, a figure that would have been difficult to imagine for AMD's accelerator business even two years ago.
The strategic significance of these deals extends beyond the revenue they represent. For years, the AI accelerator market has been effectively a single-vendor market, with Nvidia capturing the overwhelming majority of spending. The emergence of a credible second source is consequential for every company that depends on AI infrastructure, because it introduces competition into a supply chain that has been characterized by allocation constraints and pricing power concentrated in one firm. AMD's ability to win these commitments suggests that the largest AI developers are willing to invest in a second platform, not necessarily to replace the incumbent, but to ensure that they are not entirely dependent on it. The motivation is partly commercial and partly strategic, and both are rational.
The Helios platform is central to this effort. Announced at AMD's Advancing AI conference in July, Helios is a rack-scale system designed to compete directly with Nvidia's rack-scale offerings. It integrates AMD's Instinct GPUs, EPYC CPUs, and networking components into a single architecture, and it is scheduled to begin shipping in the second half of 2026, with volumes increasing into 2027. The importance of a rack-scale approach is that it allows customers to deploy AI infrastructure more efficiently, with fewer integration challenges and better performance per unit of power and space. For a company like Anthropic, which is building out server infrastructure at a rapid pace, the appeal of a pre-integrated system is straightforward.
The financial implications of this buildout are beginning to show in AMD's guidance. The company has said it expects data center revenue to reach approximately seventy billion dollars in 2027, a figure that would represent a substantial step up from current levels. It has also raised its forecast for the server CPU market to 220 billion dollars by 2030, up from a prior estimate of about sixty billion. These are not modest revisions. They reflect a view that the demand for computing infrastructure is not a cyclical phenomenon but a structural shift, driven by the recognition across every major industry that AI capabilities will be foundational to competitive advantage.
Yet it would be incomplete to describe this story without acknowledging the risks. The commitments from OpenAI, Meta, and Anthropic are large, but they are also concentrated. If any of these customers were to slow their spending, whether because of funding constraints, strategic shifts, or a broader recalibration of AI investment, the impact on AMD's outlook would be significant. The company is also competing against an incumbent that has spent years building not just hardware but an entire software ecosystem around its platform. AMD's software stack, ROCm, has improved considerably, but it remains a work in progress relative to the maturity of the alternative. Finally, the capital intensity of this buildout is substantial. AMD is investing billions into Anthropic and into its own manufacturing and research capacity, and those investments will weigh on near-term profitability even as they lay the groundwork for future growth.
For those who follow digital asset markets, the AMD story offers a useful lens. The AI infrastructure cycle is one of the most powerful forces in the global economy right now, and it is shaping capital flows, energy demand, and corporate strategy in ways that extend far beyond the technology sector. The same data centers that train large language models are being designed to accommodate tokenized financial infrastructure, and the same institutional investors funding AI buildouts are the ones allocating capital to digital assets. The two worlds are becoming harder to separate, and AMD sits at the intersection of them.
What should a careful observer watch in the coming quarters? First, the delivery timeline for Helios. The first deployments are expected in the second half of 2026, and execution on that schedule will determine whether the commitments convert into revenue on the expected timeline. Second, the trajectory of data center revenue. The seventy billion dollar target for 2027 is ambitious, and quarterly progress toward it will be the clearest signal of whether the demand is as durable as the agreements suggest. Third, the broader AI investment environment. The same macroeconomic pressures that weigh on every risk asset, including the Federal Reserve's rate path and the cost of capital, will influence how aggressively AMD's customers deploy their committed capacity.
The deeper truth is that AMD is no longer simply a semiconductor company competing for share in a mature market. It is a participant in the construction of an entirely new layer of economic infrastructure, one that will determine how intelligence is produced, distributed, and consumed for decades to come. The two trillion dollar figure is a measure of how large that infrastructure might become. Whether AMD captures a meaningful share of it will depend on execution, competition, and the willingness of its customers to follow through on the commitments they have made. The rest of us can only watch, calculate, and prepare.
$AMD
$META#ShareWeekly #Gate #STOCKS
repost-content-media
$ARK Up 28% in one day with a trading volume of 158 million, this kind of volume in the 18th month after the first three halvings has always been a hallmark of the start of the main uptrend. Currently at 0.2026, with a 24-hour low of 0.1295 and a swing of over 60%, this is a typical volume surge after a shakeout.
Historical comparison: After ARK rose 30% in a single day in February 2021, it retested the 20-day moving average within a week before doubling; a similar pattern occurred in December 2017, when it continued rising after a 15% pullback. I haven't seen any signs of whale selling in the
ARK+8.06%
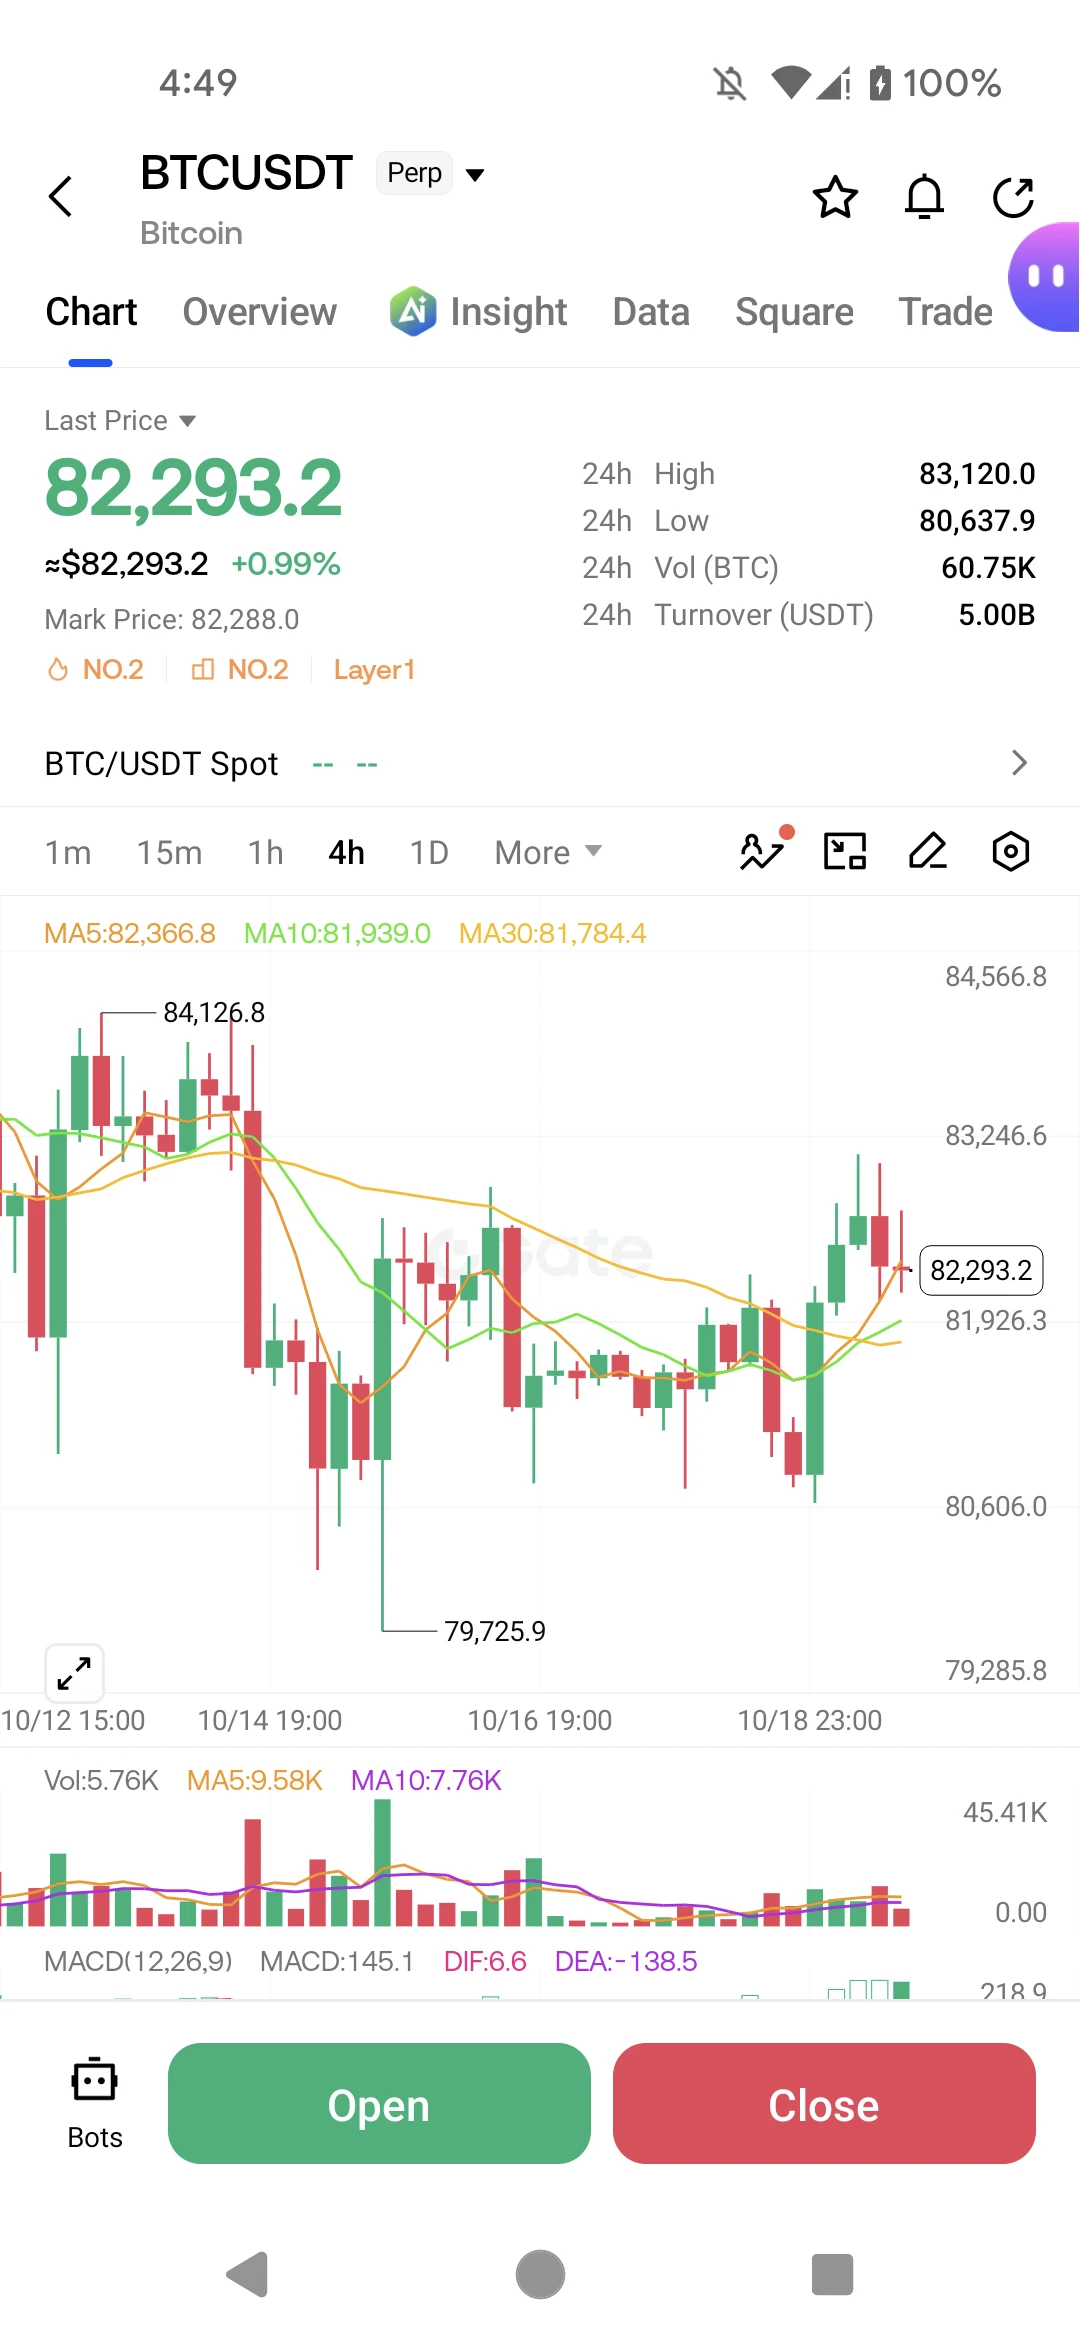
BTC
BOLL: The price has rebounded from near the lower band and moved back toward the middle band, with a short-term recovery structure gradually taking shape.
Fund flows: Overall flows remain tilted toward outflows, but a clear inflow recovery has emerged recently, with stronger support at lower levels.
ATR: Volatility remains active, so stop-losses should be placed beyond the previous low structure.
MACD: The bearish structure remains, but the histogram is strengthening and momentum is recovering.
Trading volume: Volume has not yet expanded consistently during the rebound, so it is better to
post-image
BTC+1.13%
$0.4000000 loadingggggg guyssssss
Who's hodl'g $BR ?
post-image
CryptoSat
Bedrock's moving like Whiskey on the ROCKS 🥃
Super pumped —it just hit an ATH and jumped 50% today.
We may see 0.4 soon. The further levels I expect $BR to hit today are 0.45, 0.5, 0.6, and 0.7.
repost-content-media
BR+59.34%
  • 1
  • 1
August is finally over, and everyone can catch their breath. We originally thought the market would remain lifeless, but a look at the data shows that the broader market was quietly “squatting before a jump.” Overall CEX trading volume rebounded to $4.29 trillion, up 12.7% from July. The biggest surprise was spot trading, which rose 18.7%, clearly outperforming derivatives—signaling that more people with real money are entering to scoop up tokens.
But I’d rather talk about Gate @Gate_zh. After spending enough time in this space, you know that whoever captures new growth areas is the one who re
post-image
  • 4
  • 2
Market update
live-cover
LIVE1,666
Robinhood Chain 收入连续五日下滑 - 24 小时收入降至 72.3 万美元#RobinhoodChain #链上收入 #DeFi #收入下滑 #今日热点话题
Robinhood Chain Revenue Falls for Five Straight Days to $723K: The End of a Hype Cycle or a Healthy Normalization?
After a spectacular debut that made it one of the most talked-about chains in early September, Robinhood Chain is now showing the other side of rapid growth. Daily network revenue, which had peaked at around $6 million on September 4, has entered a five-day consecutive decline and has now compressed to the $723,000 to $950,000 range, representing an 83% to 85% drawdown from its all-time high.
On
post-image
discovery
Robinhood Chain 收入连续五日下滑 - 24 小时收入降至 72.3 万美元
#RobinhoodChain #链上收入 #DeFi #收入下滑 #今日热点话题
Robinhood Chain Revenue Falls for Five Straight Days to $723K: The End of a Hype Cycle or a Healthy Normalization?
After a spectacular debut that made it one of the most talked-about chains in early September, Robinhood Chain is now showing the other side of rapid growth. Daily network revenue, which had peaked at around $6 million on September 4, has entered a five-day consecutive decline and has now compressed to the $723,000 to $950,000 range, representing an 83% to 85% drawdown from its all-time high.
On the surface, a drop of this magnitude looks like a collapse. The underlying data tells a far more nuanced and actually more interesting story about how new Layer-2 economies mature.
First, the numbers need to be placed in context. DeFiLlama data showed $5.54 million in daily revenue on September 4, followed by $841,178 on September 11, and $949,331 on September 10. Seven-day cumulative revenue settled around $18.34 million. That is still a figure that keeps Robinhood Chain ranked as the second-largest chain by daily revenue, just behind Canton, even during the correction. In other words, even at its low, it is earning more than most established Layer-1s.
Second, the decline in revenue has not been matched by a decline in usage. Blockscout data indicates the chain processed 13.6 million transactions on September 10, compared to 13.98 million on September 4, a drop of only about 3%. Decentralized exchange volume on the chain held firm near $1.7 to $2.5 billion in the same 24-hour window. Users did not leave. They simply started paying less.
That divergence between stable activity and falling fees is the key to understanding what happened. The initial revenue spike was not driven by organic, long-term transaction demand. It was driven by three temporary factors that all peaked at once. The public mainnet launch brought a wave of airdrop farmers executing high-frequency interactions to qualify for future rewards. The introduction of tokenized U.S. stocks for users in more than 120 countries created a novelty premium where traders were willing to pay elevated gas to be first. And an initial incentive program subsidized liquidity provision that inflated fee generation.
As those three factors normalized, the fee market did what fee markets always do. The average gas price fell back to a competitive level, and the protocol's take rate compressed. Gas revenue alone fell from $6.04 million on September 4 to $1.05 million on September 10, an 82.6% drop, perfectly mirroring total revenue.
For the parent company, this pattern is familiar. In its Q2 2026 report, Robinhood Markets reported that crypto transaction revenue fell 38% year-over-year to $100 million, even as equity trading volume hit $956 billion and options contracts reached 774 million. The company has consistently shown that it can grow its overall ecosystem while crypto-specific fees remain highly cyclical.
The strategic implication is actually positive. A chain that can maintain 13 million daily transactions and near-record DEX volume with sub-million-dollar daily revenue is demonstrating efficiency, not weakness. It suggests that the network is capable of supporting high throughput at low cost, which is precisely what is needed to compete for tokenized equities and retail DeFi flows in the long term. The $6 million day was an anomaly driven by speculation. The $723,000 day is likely much closer to its sustainable baseline.
What to watch next is not whether revenue rebounds to $6 million, because it should not without another artificial catalyst. What matters is whether transaction count and total value locked remain stable over the next two weeks and whether Robinhood Earn, its new decentralized lending product, can create a more durable, interest-based revenue stream to replace the volatile gas-based model.
repost-content-media
HOOD-0.67%
AIRDROP+14.16%
  • 3
$XAU /USDT is about to flip from range to trend, and nobody is watching yet.

$XAU /USDT - LONG

Trade Plan:
Entry: 4315.67 – 4320.89
SL: 4285.75
TP1: 4342.68
TP2: 4358.95
TP3: 4383.35

Why this setup?
Why now? The daily trend is range, but the 1h price at 4317.84 is hugging the lower bound of the entry zone between 4315.67 and 4320.89, while the 15m RSI at 36.16 signals room for a snap-back long. The 1h ATR of 10.427842 shows volatility is compressed enough to fuel a move, and the target TP1 at 4342.68 lines up just above the range, with TP2 at 4358.95 capping the expected leg. The invalid
XAU-0.91%
FILUSDT
🟢LONG · 15m ·
Entry
1.0129
Stop
0.98925 (−2.33%)
Take 1
1.0316 (+1.85%)
Take 2
1.0484 (+3.5%)
Take 3
1.072 (+5.84%)
post-image
FOUR DAYS THREE CATALYSTS.
TUE: SENATE CLOTURE ON THE CLARITY ACT
WED: FED RATE DECISION
FRI: BOJ POLICY CALL
Consensus is already priced.
The move usually comes from what isn’t.
Don’t sleep on this week.
post-image
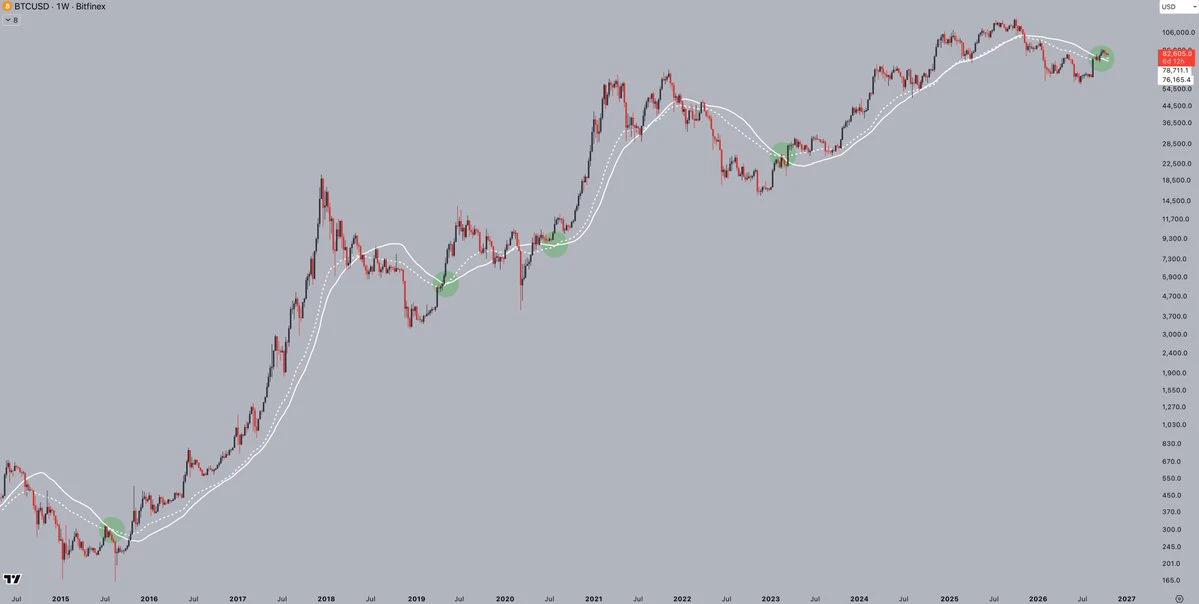
After last week’s CPI-driven pump, it still fell back down in the end. The idea of shorting the rebound at $BTC was correct.
And now we’ve reached a truly difficult week—the Fed’s interest rate decision.
The market has already priced in quite a bit of a 25 bp rate hike in September, so I think what really matters is not whether they hike, but whether they will continue to sound hawkish this time.
We’ll see what Powell says after the hike and whether the dot plot continues to lean hawkish. Once the hike is delivered, if no more hawkish signals are released afterward, we could instead see a wav
post-image
BTC+1.13%
Nobody is talking about this SYMBOL setup yet

$BTC /USDT - LONG

Trade Plan:
Entry: 77625.2 – 77785.0
SL: 76938.4
TP1: 78280.1
TP2: 78663.4
TP3: 79238.4

Why this setup?
Why now? The daily trend is bullish, the 4h bias is LONG at 95 percent confidence, and the 1h price sits at 77705.1 inside a tight entry zone between 77625.2 and 77785.0. The 15m RSI at 56.45 shows room to run without being overbought, while the 1h ATR of 319.44623 tells us volatility is just enough to push toward the first target at 78280.1. If momentum continues, the second target at 78663.4 comes into play, but the line
BTC+1.10%
Everyone watching gold long is about to get blindsided by $XAU /USDT.

$XAU /USDT - SHORT

Trade Plan:
Entry: 4322.41 – 4327.41
SL: 4348.94
TP1: 4306.89
TP2: 4294.88
TP3: 4276.85

Why this setup?
Why now? The daily trend is range, so momentum is exhausted and a breakdown is due. The 1h ATR is 10.01, which means the average candle size is large enough to sweep the entry zone at 4324.91 quickly. The 15m RSI sits at 36.52, showing bearish momentum is building without being oversold yet. The entry zone between 4322.41 and 4327.41 aligns with the 1h price, creating a precise short trigger. The f
XAU-0.91%
After investing for so many years, I increasingly feel:
Making money isn’t about how smart you are, but whether you can make fewer mistakes
When the market is doing well, everyone thinks they’re an expert
What truly creates the gap is when the market falls
Don’t invest all your capital, don’t go all-in, don’t borrow money to invest, don’t chase just because prices are rising, and don’t panic just because they’re falling
For opportunities you don’t understand, it’s better to miss them than force your way in
As long as your principal remains, there will always be opportunities
The most important
post-image
  • 1
  • 2
#AMD$2TAI2030
AMD $2T AI 2030: The Ambitious Vision Behind the AI Chip Market
AMD reaching a potential $2 trillion valuation by 2030 represents an extremely ambitious long-term scenario, but it also highlights how rapidly artificial intelligence is transforming the semiconductor industry. As AI adoption expands across data centers, cloud computing, enterprise software, autonomous systems, robotics, and personal devices, demand for advanced computing infrastructure is expected to remain a major investment theme.
Advanced Micro Devices has increasingly positioned itself as an important competit
AMD+2.54%
Insiders are watching SYMBOL break a range that has held for weeks

$XAG /USDT - LONG

Trade Plan:
Entry: 63.39 – 63.51
SL: 62.67
TP1: 64.03
TP2: 64.42
TP3: 65.00

Why this setup?
Why now? The daily trend is range, but the 1h price is resting at 63.45, a level where the 15m RSI sits at 34.15, signaling a potential shift from oversold conditions. The 1h ATR of 0.249046 tells us volatility is compressed, so a move from the entry zone between 63.39 and 63.51 could be explosive. If long, the first target is 64.03, with a deeper objective at 64.42, but the trade is invalidated if price pushes ab
XAG-1.63%
  • 2
#GateTop4MainstreamCEX Gate continues to emerge as a major force in the global centralized exchange landscape, strengthening its position among leading mainstream CEX platforms.
Its expanding trading ecosystem, broad asset coverage, deepening liquidity, and continued investment in Web3 infrastructure reflect a clear focus on scale and long-term growth. In an increasingly competitive market, the strength of an exchange is measured not only by trading activity, but also by product depth, accessibility, technology, security, and its ability to adapt to the next phase of digital-asset adoption.
Ga
post-image
Load More

Join 40 M users in our growing community

⚡️ Join 40 M users in the crypto craze discussion

💬 Engage with your favorite top creators

👍 See what interests you

Trending Topics

AnthropicPicksNasdaqForIPO

71.95k Views2.64k Discussing

The related rumor has heated up valuation discussions around unlisted AI companies and also linked SpaceX's secondary-market performance with primary-market sentiment. However, it remains an unconfirmed market rumor for now.

Gate 24H Futures Open Interest Tops $11.479B

4.05k Views118 Discussing

Korea Stocks Plunge 3.14% at Open

44.64k Views4.79k Discussing

View More