
Square
Following
Hot
News
Profile
Share your thoughts
placeholder
Article
#nvda #$NVDA #WCTCS9
#NVDAStockAnalysis Can NVIDIA Break $230 and Target $250? Trading Strategy, Support, Resistance and Price Forecast
NVIDIA (NVDA) remains one of the most closely watched companies in the artificial intelligence revolution. With the price currently around 217 USDT according to the provided quote, traders are watching whether buyers can push the stock toward $225–$230 or whether another pullback will create a better entry opportunity.
My view: NVDA has a bullish long-term growth story, but the short-term trend needs confirmation. AI demand, earnings growth, trading volume,
  • 2
🔥 $CT is facing huge selling pressure, down more than 18% in 24 hours! The price has fallen below key support, and bearish momentum remains strong. 📉Take profit: 0.01561 Stop loss: 0.32510 Short $CT 👇
post-image
CT-18.80%
Trenches
Kimchi
K
bade
b
Kimchi
CSoc...pump
Market Cap
$.
Change
.
24h Vol
$.
Holders
.
CYBER
C
bade
b
CYBER
CMo7...pump
Market Cap
$.
Change
.
24h Vol
$.
Holders
.
PANGEA
P
bade
b
PANGEA
JAFq...Y6ea
Market Cap
$.
Change
.
24h Vol
$.
Holders
.
Dacity
D
bade
b
Dacity
nxPq...pump
Market Cap
$.
Change
.
24h Vol
$.
Holders
.
AGT
A
bade
b
AGT
0x5d...e274
Market Cap
$.
Change
.
24h Vol
$.
Holders
.
new stimers
live-cover
LIVE3,205
Anthropic Generates $16.3 Billion in Just Six Months! With Future Computing Commitments Potentially
live-cover
LIVE3,853
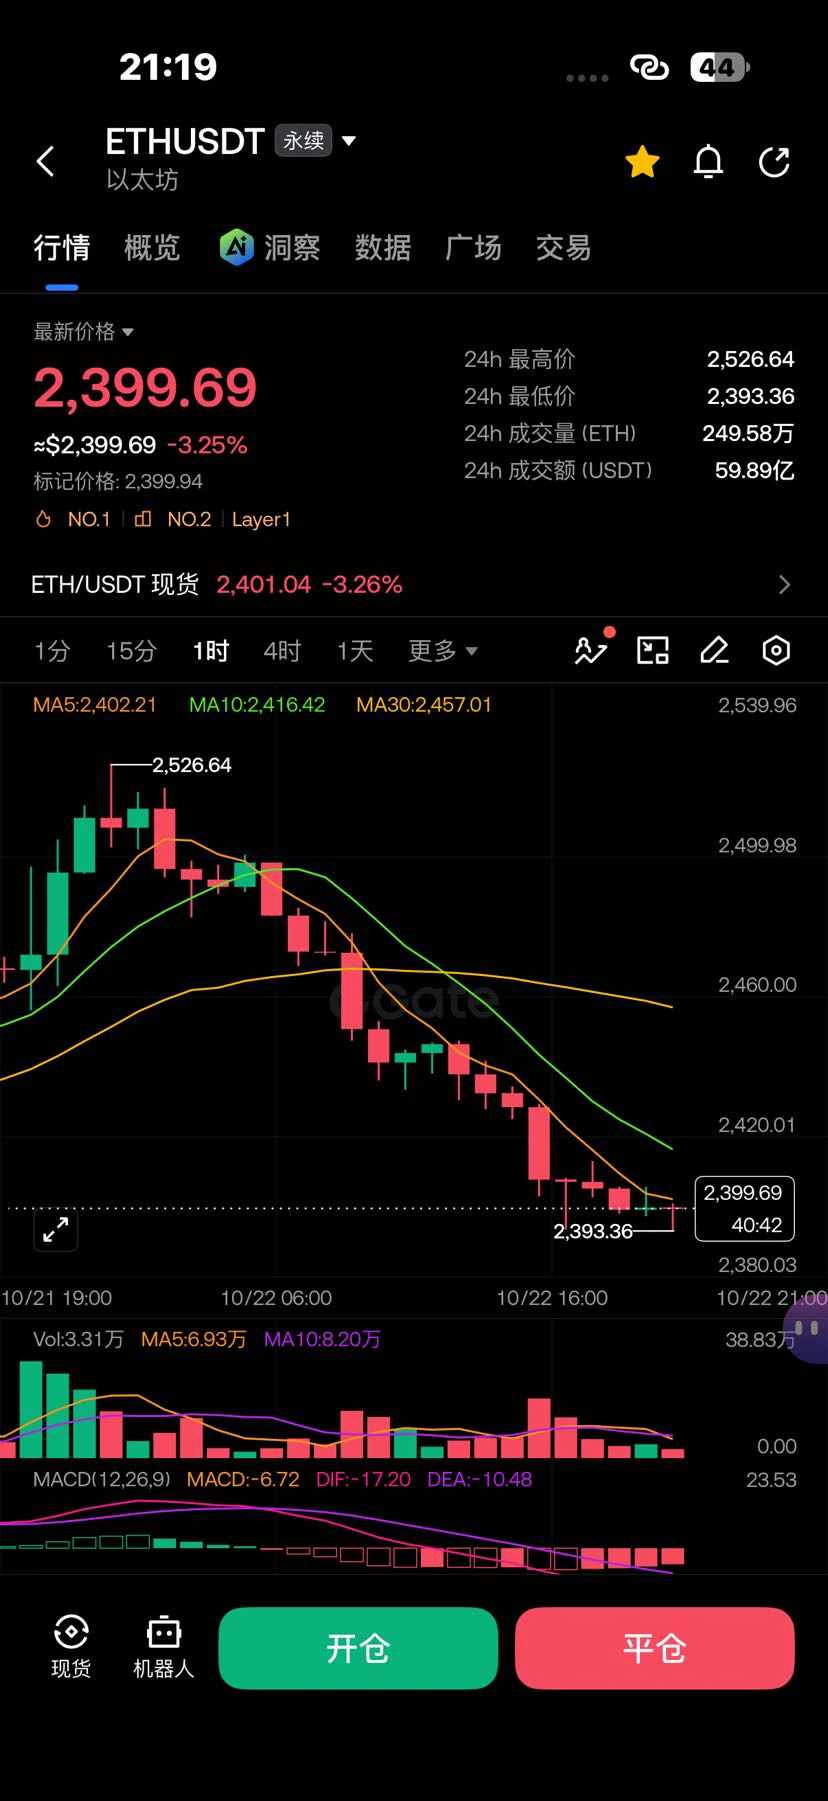
The market is in a one-way decline and has tentatively entered oversold territory. It currently lacks momentum for a rebound; let’s see whether U.S. stocks can bottom out and recover intraday.
The crypto market has no independent short-term trend and is driven by the situation in the Middle East and dollar liquidity
post-image
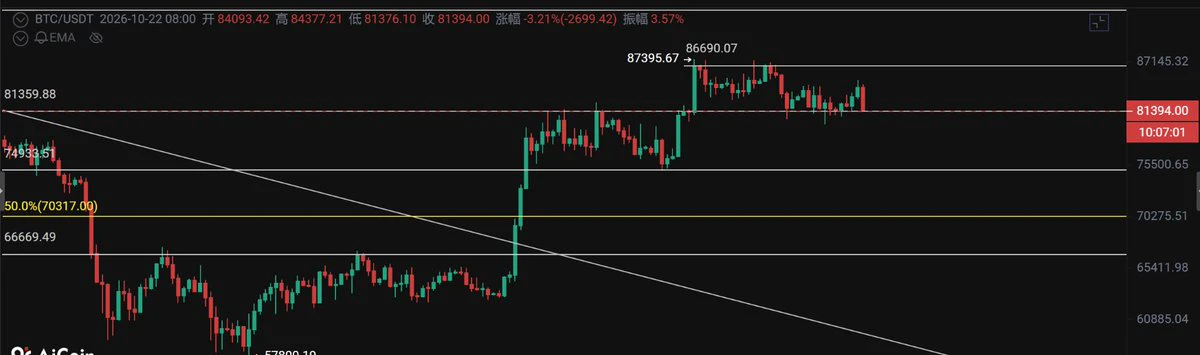
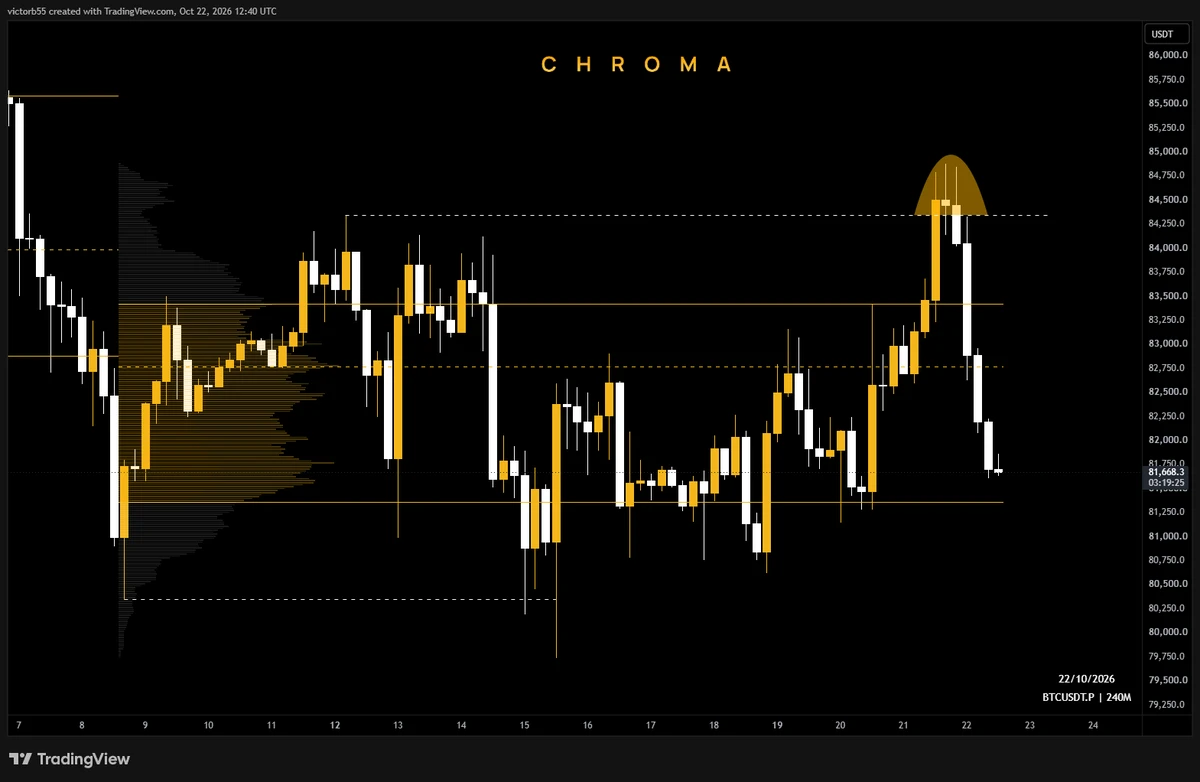
Textbook range high deviation on $BTC
One of the best pieces of advice I can give:
Always bet that it's a deviation, not a breakout. A breakout only happens once, deviations happen many times. So statistically it's EV+ to bet on a reversal than a continuation.
post-image
BTC-2.55%
I had things to take care of yesterday and today, so I didn’t post any market analysis. But we already made our view very clear a few days ago: I personally believe that any rebound at this level would just be a pause before the downtrend continues. Today’s daily candle is a large bearish candle, and the price has returned to the 81,300 support level. The direction from here is actually quite clear: the market will likely continue to move sideways to lower.
The logic is simple:
① The macro environment isn’t strong enough to support a major rally.
② ETF inflows aren’t being driven by new capita
post-image
BTC-2.55%
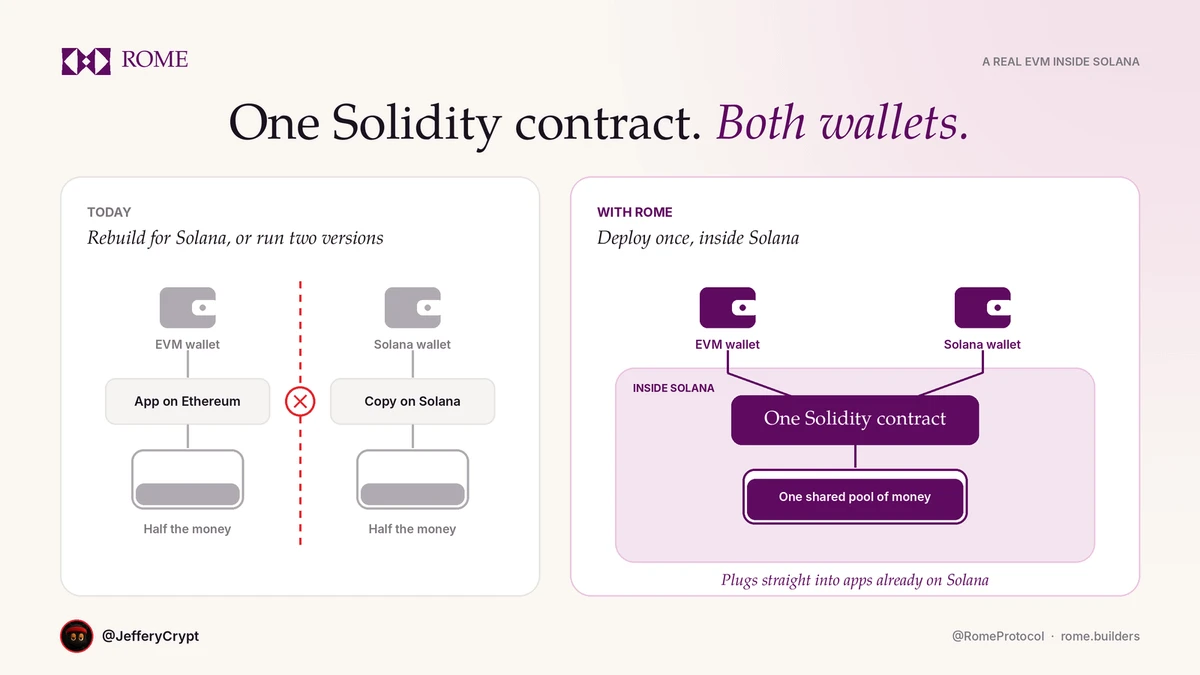
One Solidity contract, used by both Ethereum and Solana wallets. That is @RomeProtocol in one line.
Right now, if you write in Solidity and want Solana users, you either rewrite your entire app or run two versions and split your money in two.
With Rome, because it runs EVM natively inside Solana, you just deploy once: both types of wallets use the exact same pool of funds, and your contracts can plug straight into native Solana apps.
What I like is how simple it makes things. Builders don’t have to pick a side anymore, you just build once and reach both crowds.
post-image
ETH-2.45%
SOL-1.86%
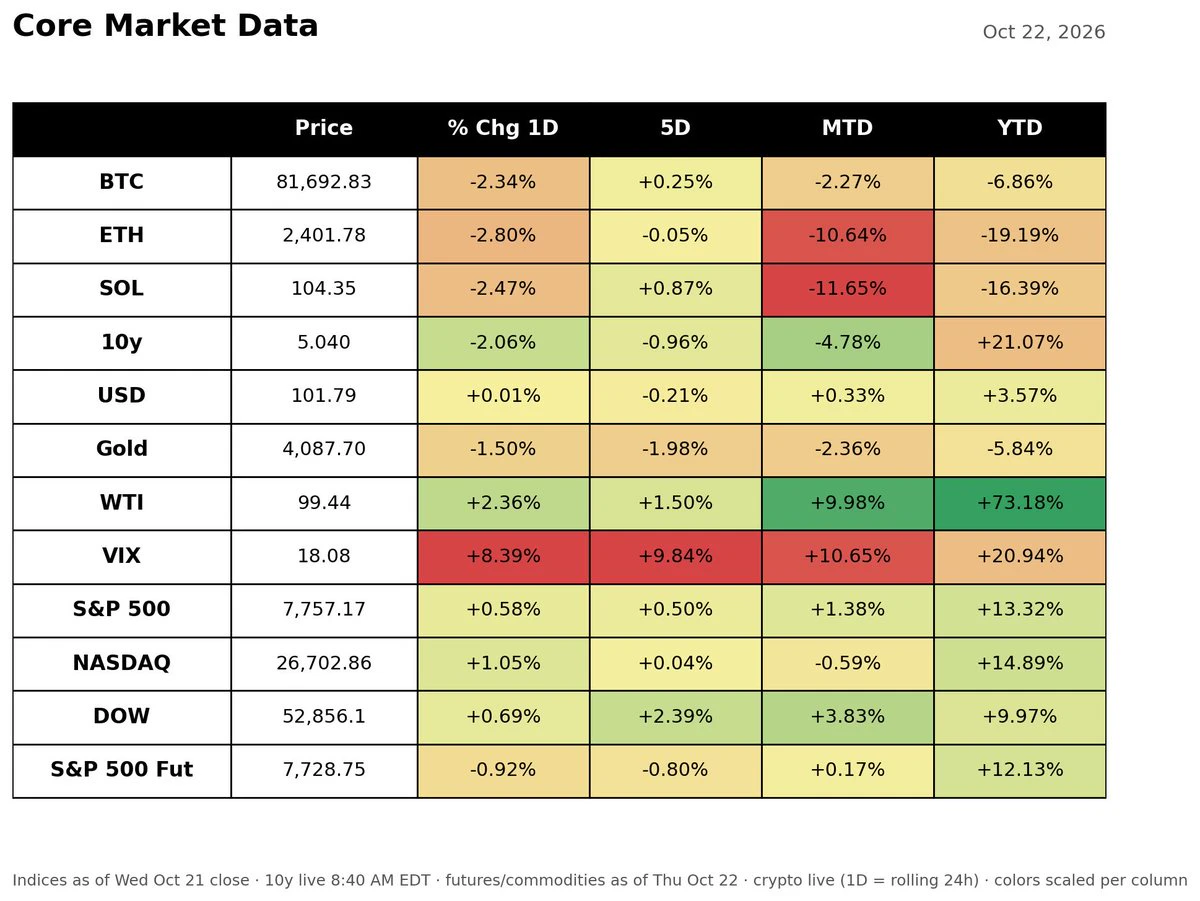
10Y just tagged 5.04%, lowest in nearly a month. The AI wobble is fixing rates faster than the Fed ever did.
post-image
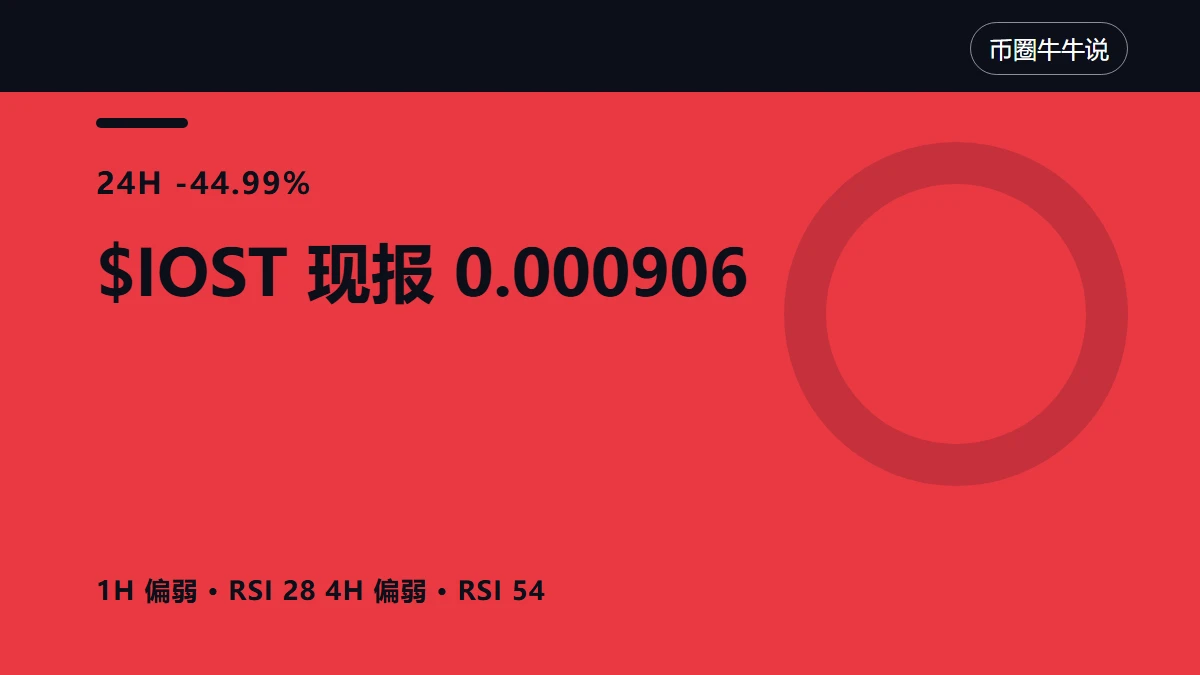
$IOST 's 24-hour result is -44.99%, but the result is neither a cause nor a prediction. What can be confirmed now is 0.000906, 0.09x volume, and weakness on the 1-hour and 4-hour timeframes.
The easiest mistake here is to assume that a big drop automatically means cheap, or that a rebound automatically means reversal. I treat oversold conditions only as a reason for a rebound, not as proof of a bottom; only after it stops making new lows is it eligible to be called a turning point.
The chart is simple to read: below 0.000863 is one outcome, above 0.001908 is another, with broader boundaries at
post-image
IOST-45.01%
#每周来晒 #美股AI和加密概念上涨 The immediate triggers for this rebound are clear, but the substance of the “recovery in risk appetite” needs to be examined more closely.
The short-term support is real, but it is more of a “repair” than a “trend restart.” The gains on October 21 were driven by earnings reports, including 830% year-over-year growth in SpaceX’s AI business revenue and 26% revenue growth at Meta, alongside signals that Russia-Ukraine trilateral talks would resume. This was an event-driven sentiment rebound. The problem is that before the rebound, the semiconductor sector had just endured an e
SPCX-4.66%
GS-0.67%
WFC+0.83%
CRWV-4.75%
MSTR-3.92%
  • 5
Personal recommendation, for reference only. Anyone needing technical indicators for trading can reach out anytime. The indicators are reliable, with real-time trade signals consistently available for gold, U.S. stocks, and cryptocurrencies.
post-image
GLDX-1.49%
PAXG-1.61%
XAU-1.72%
Current thoughts on Ziggs:
I think it's no surprise to anyone that he's equipped to be a control deck. The type of control, however, is something I think most people initially got wrong (myself included).
Trying to replicate Ezreal's control style is a lost cause. Red/purple just plays very differently from blue/purple.
So what does that mean for his play pattern? Well, control in general wants to outvalue the opponent. Ziggs is no different, but the way he generates that value is.
Ziggs' biggest strength comes from having primers (bombs) on demand to combo with Shimmering Swimmer, Detonate, a
post-image
I will attend the @base Meme Summit on October 22 at 11 a.m. Eastern Time.
post-image
BREAKING: BITCOIN ETFs JUST PULLED IN $524.8M 👀
Massive accumulation.
BTC-3.56%
$IOST nearly halved in a day, down 49.1%, while OI is up 55.02%
$IOST is currently at 0.000898, down 49.1% over 24 hours, after dropping from 0.00193 intraday. I’m bullish at this level—the daily RSI is still 67.7 despite the drop, the MACD just formed a golden cross near the zero line 1 day ago, and the histogram bars are still growing. This doesn’t look like a crash; it looks like a shakeout.

24h trading volume is 32666519 USDT, with a volume ratio of 12.584—this kind of volume doesn’t come with a slow bleed. With this much volume on the sell-off, someone is still buying; there’s support
IOST-45.01%
Absolutely jaw-dropping!
What kind of local custom is this??
Which platform would even allow this to be posted?
Personal recommendation for reference only. Anyone who needs quantitative trade orders can consult me anytime. The indicators are stable, and I can provide steady real-time orders for gold, U.S. stocks, and cryptocurrencies anytime.
post-image
GLDX-1.49%
PAXG-1.61%
XAU-1.72%
  • 4
Load More

Join 40 M users in our growing community

⚡️ Join 40 M users in the crypto craze discussion

💬 Engage with your favorite top creators

👍 See what interests you

Trending Topics

GateQ3ReportReleased

4.11k Views3.57k Discussing

Gate released its Q3 2026 report, with September derivatives trading volume reaching $396 billion, up 38.2% MoM, while spot trading volume reached $48.8 billion. The platform now covers more than 12,800 global stocks and ETFs. With trading and broader financial services expanding together, what could drive Gate’s next phase of growth? [👉 Full report](https://www.gate.com/announcements/article/102375)

MetaEarningsBeatExpectations

5.36k Views519 Discussing

USAIAndCryptoStocksRise

21.71k Views8.43k Discussing

View More