Square
Following
Hot
News
Notifications
Profile
Share your thoughts
placeholder
Article
I'm not someone who makes money by talking. Those streamers in the chat, keep your eyes peeled, retail traders. Big streamers—your position is nowhere near enough to keep up. He goes 3x, makes 100% on a 10-point move, and gets out. How can you keep up? Those small streamers are even more full of nonsense
, stay calm. Crypto can turn your life around, but don't pin your hopes on scammers. Newbies seeing this, you're in luck. Keep your hands in check.
post-image
🔹 Ethereum(ETH) Surpasses 1,700 USDT with a Narrowed 1.69 Decrease in 24 Hours
live-cover
LIVE1,489
XAUUSD-2.40%
NVDA-0.35%
ETH-1.23%
BTC-0.65%
XAU+0.38%
Trenches
PIEVERSE
P
bade
b
PIEVERSE
0x0e...25a9
Market Cap
$.
Change
.
24h Vol
$.
Holders
.
IDOL
I
bade
b
IDOL
0x3b...ab07
Market Cap
$
Change
.
24h Vol
$.
Holders
.
JAGENT
J
bade
b
JAGENT
0x8e...ae15
Market Cap
$.
Change
.
24h Vol
$.
Holders
.
Singularity
S
bade
b
Singularity
7R4M...pump
Market Cap
$.
Change
.
24h Vol
$.
Holders
.
mihao
m
bade
b
mihao
4Cxj...pump
Market Cap
$.
Change
.
24h Vol
$.
Holders
.
What if $SOL post 5's stop is below post 4's entry?
73.13 vs 73.49. A 4.9% rally kills one and neutralizes the other.
Same move, opposite outcomes. 👇
$SOL ‌$EVAA ‌$IDOL ‌$NVDA ‌
SOL-0.74%
SOL-0.77%
EVAA-0.42%
IDOL-7.01%
NVDA-13.84%
  • 1
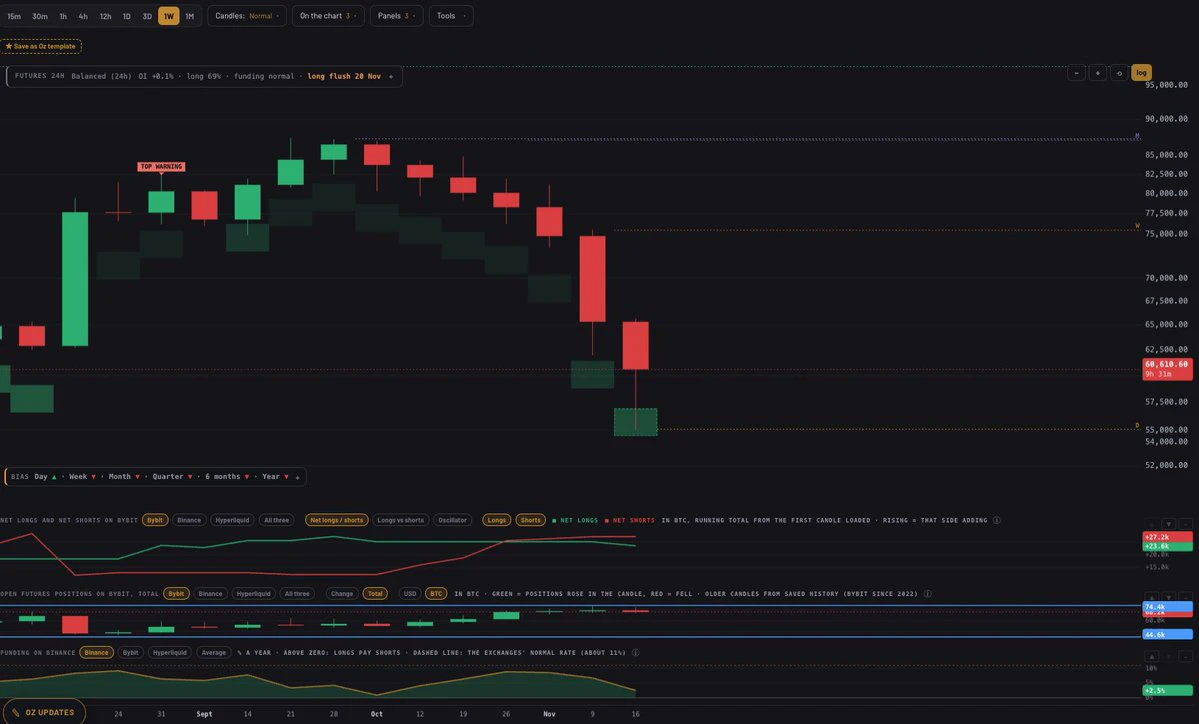
Net Longs finally being flushed out..
post-image
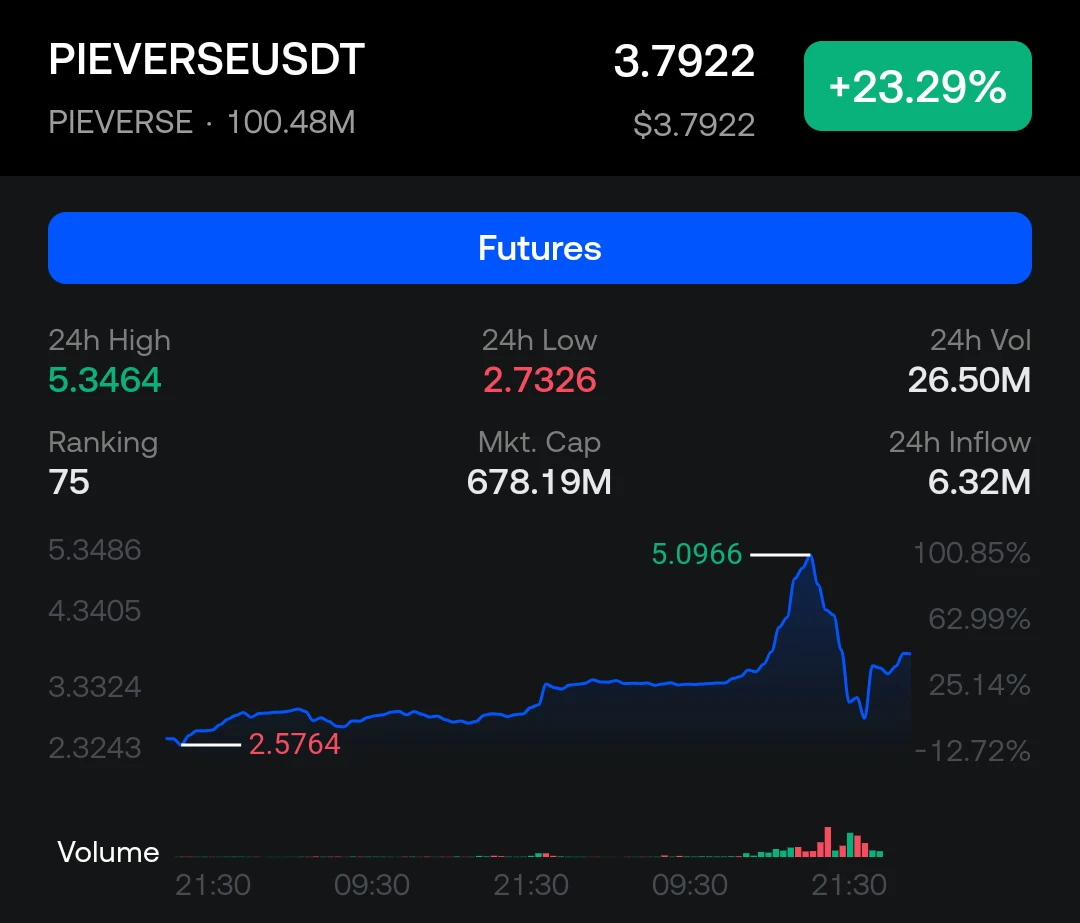
$PIEVERSE ‌PIEVERSEUSDT – Perp 📊
🥧 Why did Pieverse go to therapy? Because it couldn't handle the crusty emotional rollercoaster of being baked at 5.34 and dropping like a hot potato! 📉📈

Bias: Bearish retracement. The chart shows a classic parabolic pump-and-dump from 5.34 down to 2.73, followed by a weak relief bounce. Expect a lower high rejection or consolidation. ⚠️

---

📉 Short – Rejection
Entry: 4.0000 – 4.3500 (Confluence: Lower high / Mid-range resistance)
TP1: 3.3324
TP2: 2.7326 (24h low)
TP3: 2.5764 (Pump origin)
SL: 4.6000 (Above local consolidation)

📈 Long – Breakout
Entr
post-image
PIEVERSE+0.50%
Crypto Fear and Greed Index drops to 11, market sentiment plunges to freezing point.
live-cover
LIVE1,692
BTC-0.67%
ETH-1.26%
SOL-0.77%
USDC+0.01%
XRP-1.15%
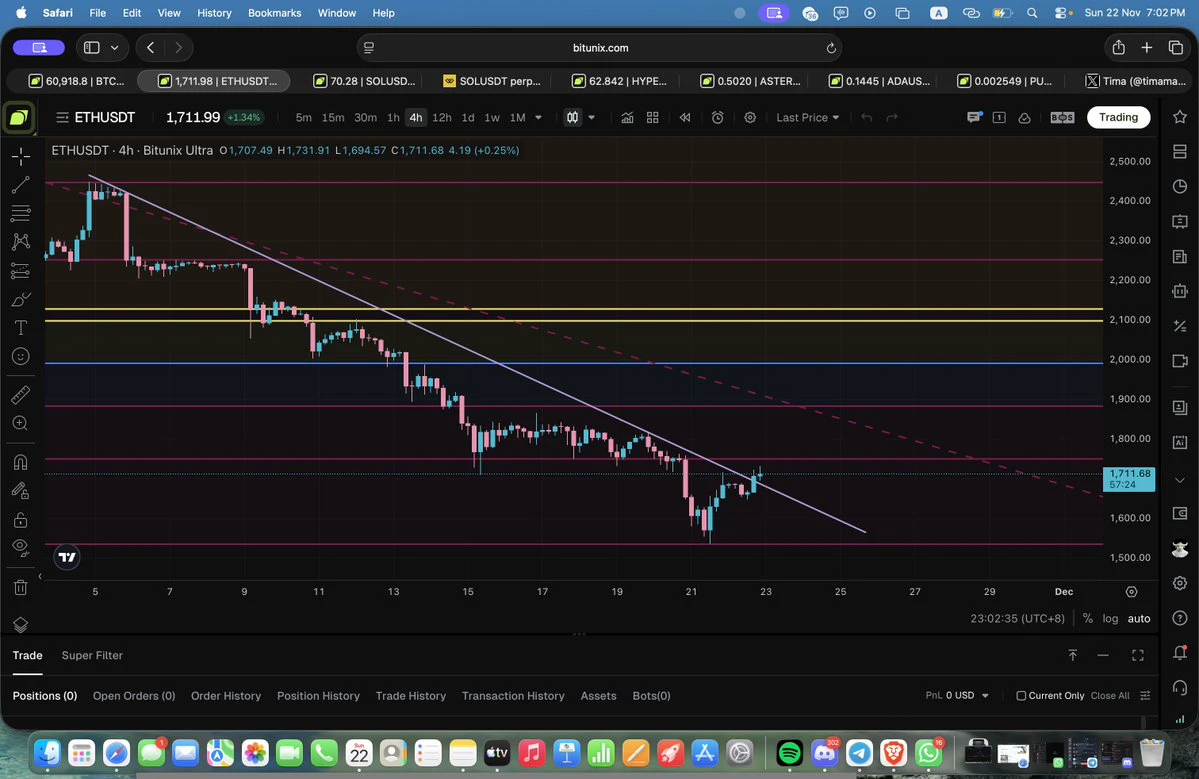
If the candles still look like this in 57 minutes then I'll buy ETH 📈🔥
post-image
ETH-1.26%
  • 1
  • 1
The current ETH/USDT market presents a complex picture when combining on-chain metrics with technical price action.

According to Coinglass data, the order books show a stark asymmetry. There is a large bid concentration near 1650 dollars acting as local support, but significant sell orders are stacked at 1700, 1800, and 1900 dollars. This creates a major barrier for upward movement. Liquidation maps indicate that a move above 1841 dollars could trigger short liquidations, while a drop below 1668 dollars threatens long positions. The funding rate is negative, pointing to bearish sentiment, yet
ETH-1.23%
Held the position all day, and it finally started recovering in the evening😍
post-image
ETH-1.23%
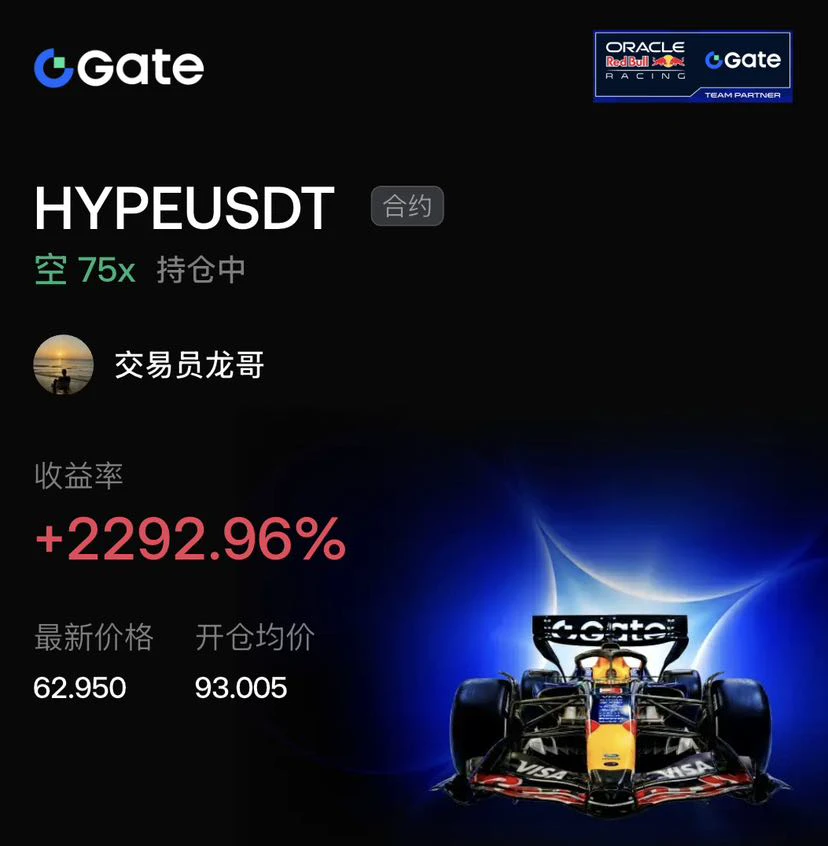
A few days ago, $HYPE surged to around 93. Daily price and volume diverged sharply, and bullish sentiment was far too overheated—it was clearly running out of steam. I decisively went heavily short with 75x leverage! With 75x leverage, there’s virtually no room for error; a wick nearly wiped me out in seconds, but I stuck to my ironclad rules and kept my stop-loss at breakeven, ultimately capturing a staggering 2292% return.

Now the price has plunged to 62.95, and the downtrend is firmly in place. But after such a steep drop, a violent rebound and short squeeze could happen at any time. The
post-image
HYPE+0.33%
BTC-0.65%
SOL-0.74%
$ZEC After surging to $1,700, it has pulled back all the way, but don't overlook one detail in the market: the bulls haven't capitulated, and the key zone where major players are absorbing selling pressure is still being staunchly defended.

Let's mark out a few levels first: - $730–$800: core defense zone; a drop to this level would mark the true dividing line between bulls and bears- $1,050: the first overhead wall of selling pressure- $1,200: extension target after a breakout- $1,700: the top marker for this rally
As long as $ZEC can hold its current support and buyers continue to come in,
post-image
ZEC+1.16%
#BTCFallsToLowestSinceSeptember
#ShareWeekly 🐋 WHALE WATCH: $NVDA closed at $129.95, down 14% on Friday, ending its longest weekly losing streak since 2008. $BTC ‌ ‌ ‌
post-image
NVDA-13.84%
BTC-0.67%
#PCEAndGDPDataNextWeek Global risk assets enter the Thanksgiving-shortened trading week under acute macro pressure, with Bitcoin fighting to stabilize around the $56,000–$59,000 zone after breaking below $60,000, the Nasdaq Composite nursing a sharp 5.28% Friday drop, and spot gold testing critical support near $3,500–$3,520. Everything converges on Wednesday, November 25, 2026, at 8:30 AM EST (6:30 PM PKT), when the U.S. Bureau of Economic Analysis (BEA) simultaneously publishes two market-defining reports: October 2026 Personal Income and Outlays (PCE Inflation) and the Q3 2026 GDP Second Es
post-image
BTC-0.67%
ETH-1.26%
NAS100-4.60%
#SKHynix #WCTCS9 #ShareWeekly
SK HYNIX AT 770 USDT: Is This a Buying Opportunity or a Warning Signal? Full Market, AI Memory, HBM, Fundamental and Trading Strategy Analysis

SK hynix is standing at the centre of the global AI memory story, but strong business performance does not mean its share price can only move upward. At the reference price of 770 USDT supplied for this analysis, the key question is whether the recent weakness represents a temporary correction inside a powerful semiconductor cycle or the beginning of a deeper valuation reset. My approach is to separate the company's opera
To resolve the mother-in-law/daughter-in-law relationship at its root, the best approach is to raise the child yourself or have the maternal grandmother do it. The mother-in-law should just promptly pay for the occasional trip. That’s the only way to completely resolve the relationship.
  • 1
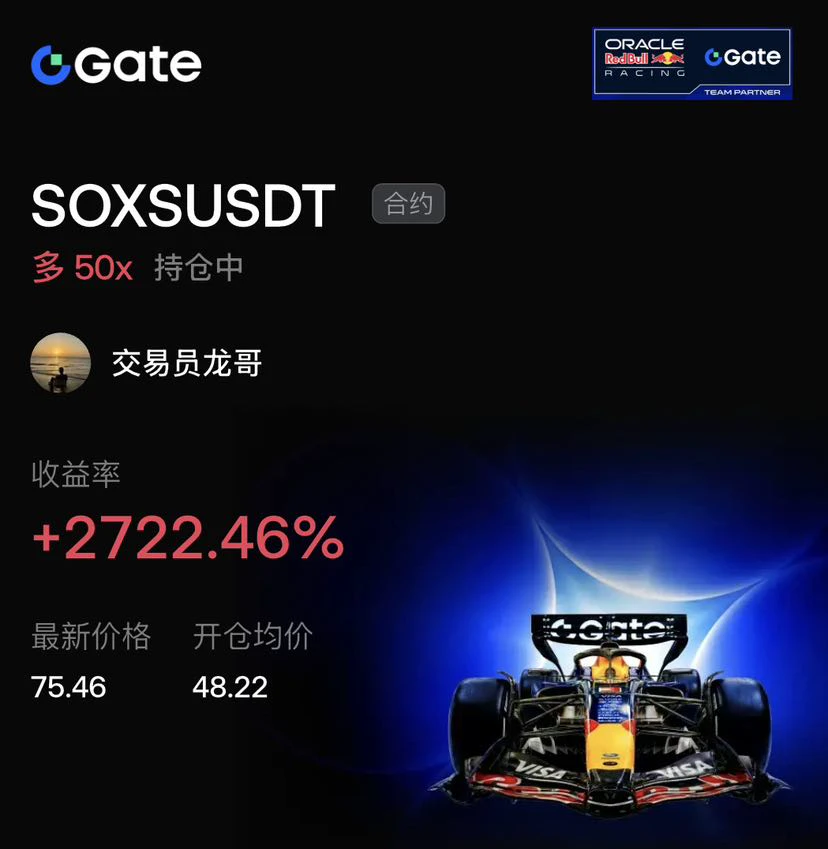
$SOXS From the low of 48.22, it blasted straight up to 75.46—the bulls took off without even leaving the shorts a splash!

The 48.22 bottom was obvious at a glance, so I slammed into a 50x long! A wick nearly liquidated me in seconds, but thankfully my break-even stop held firm, and I still pocketed a full 27x profit!

On the next pullback, keep longing above 72, with a stop at 70! Chase the long on a breakout above 78 and target 82! If it holds at 70, you can try a small long, with a stop below 65. If you’re slow to exit, you’ll go straight to zero$BTC $SOL
#BTC反弹后再争6万美元关口
post-image
SOXS+1.46%
BTC-0.65%
SOL-0.74%
2026-11-22 23:00
$BTC 60,897.90 (-0.23%)
4H range-bound · 15m RSI 48 · Wait, RSI in neutral zone
$ETH 1,712.32 (+0.28%)
4H range-bound · 15m RSI 55 · Wait, RSI in neutral zone
$SKHYNIX 789.31 (+0.39%)
4H bearish · 15m RSI 61 · Strong short 4H bearish + 15m overbought rebound Reference 792.71 short
AAPL 350.35 (-0.30%)
4H range-bound · 15m RSI 29 · Mild long 4H range-bound + 15m touching lower band Reference 350.01 long
#BTC #ETH #SKHYNIX
⚠ For reference only; this does not constitute investment advice$ETH ‌
post-image
ETH-1.23%
  • 1
$BTC is testing the patience of everyone who bought recently.
$15B in unrealized losses is no joke.
Weak hands are getting a masterclass in volatility.
How much selling pressure is actually left?
BTC-0.67%
  • 1
Saylor dropped a line tonight: “The dots aren’t done”
The orange dots aren’t finished being drawn
My read is that he may be hinting at more buying
But it still can’t be written up as an additional purchase
Strategy MSTR’s latest official figures are still from the November 16 report
It holds 850,849 bitcoins, acquired at a cost of about $64.2 billion, with an average price of about $75,452
The previous purchase was made from November 9 to 15: 485 coins for about $33.4 million, at an average price of about $68,887
At the current estimated price of about $60,830, the market value is about $51.8
post-image
MSTR-9.49%
BTC-0.67%
  • 1
Load More

Join 40 M users in our growing community

⚡️ Join 40 M users in the crypto craze discussion

💬 Engage with your favorite top creators

👍 See what interests you

Trending Topics

BTCReboundFaces60KTest

2.1M Views30.1K Discussing

BTC rebounded from around $55,300 on November 21, briefly reclaiming $60,000 before pulling back to around $59,300. The $60K level is back in focus as traders assess whether the recovery can last. Is this rebound a sign of stabilization or a short-lived recovery? Would reclaiming and holding $60K be enough, or do you need confirmation from trading volume and fund flows?

PCEAndGDPDataNextWeek

260K Views2.6K Discussing

GateDirectIPOPhase3ANTAllocates92100Shares

845.6K Views5.1K Discussing

View More