
Square
Following
Hot
News
Notifications
Profile
Share your thoughts
placeholder
Article
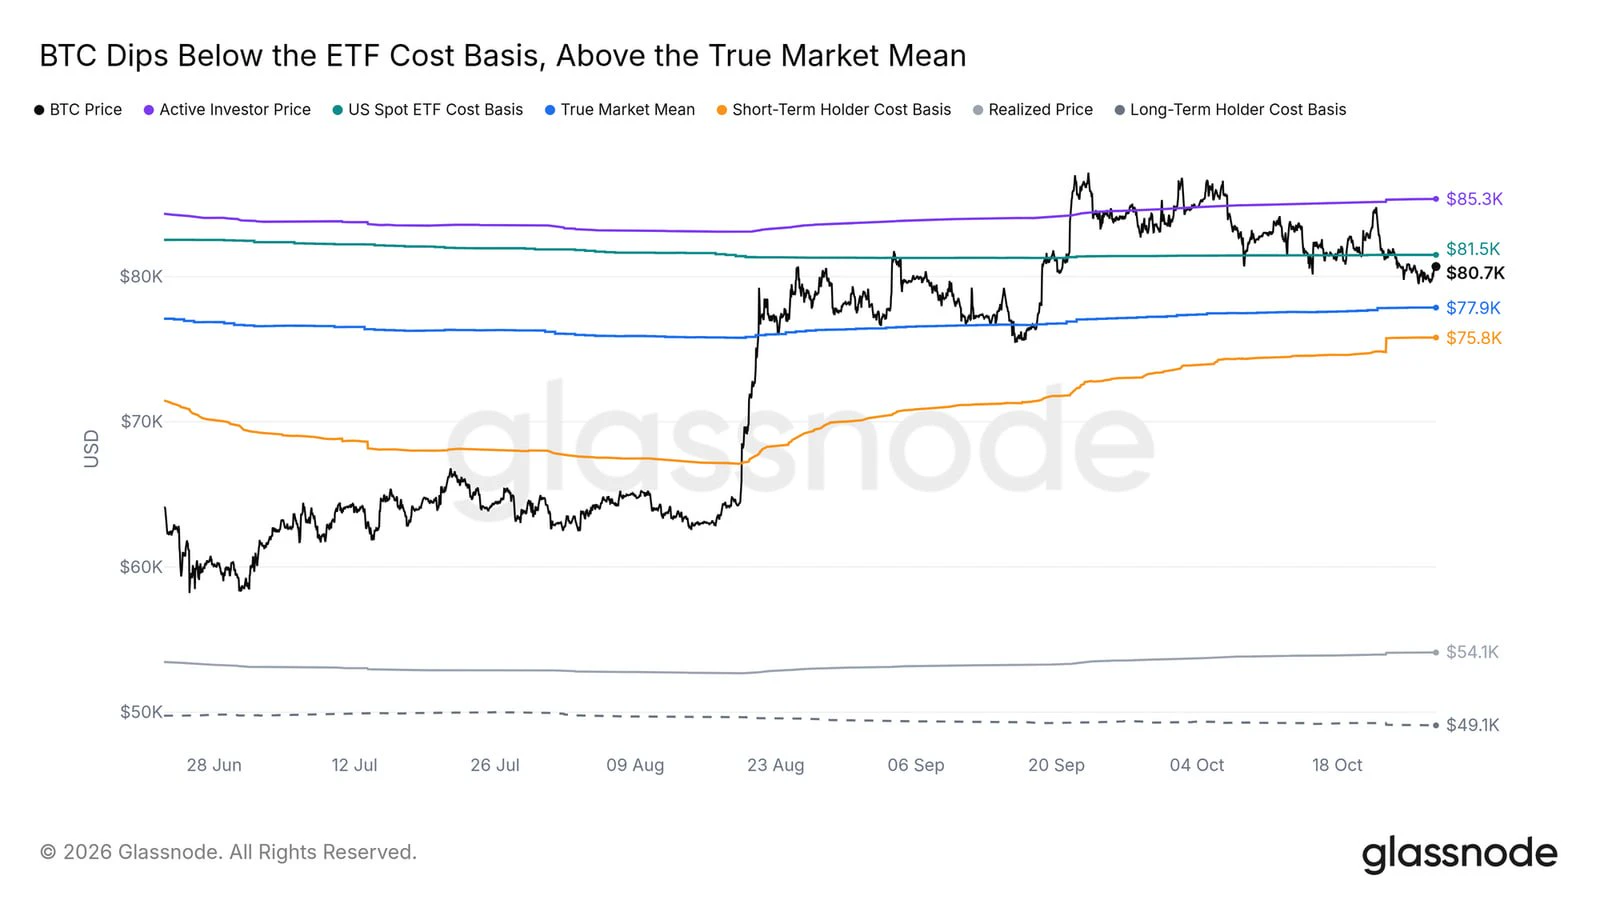
Bitcoin has slipped just under the US Spot ETF Cost Basis, the average price the ETFs paid for their coins, at $81.5K. Below it lies the True Market Mean, the average cost basis of active investors, at $77.9K, and price has stayed above it through both October sweeps. The Short-Term Holder Cost Basis, the average price paid by newer buyers, is lower still at $75.8K. A daily close back above $81.5K would put the average ETF holder back in profit.
$BTC ‌#ShareWeekly #BitcoinDropsBelow$70K
post-image
BTC-0.67%
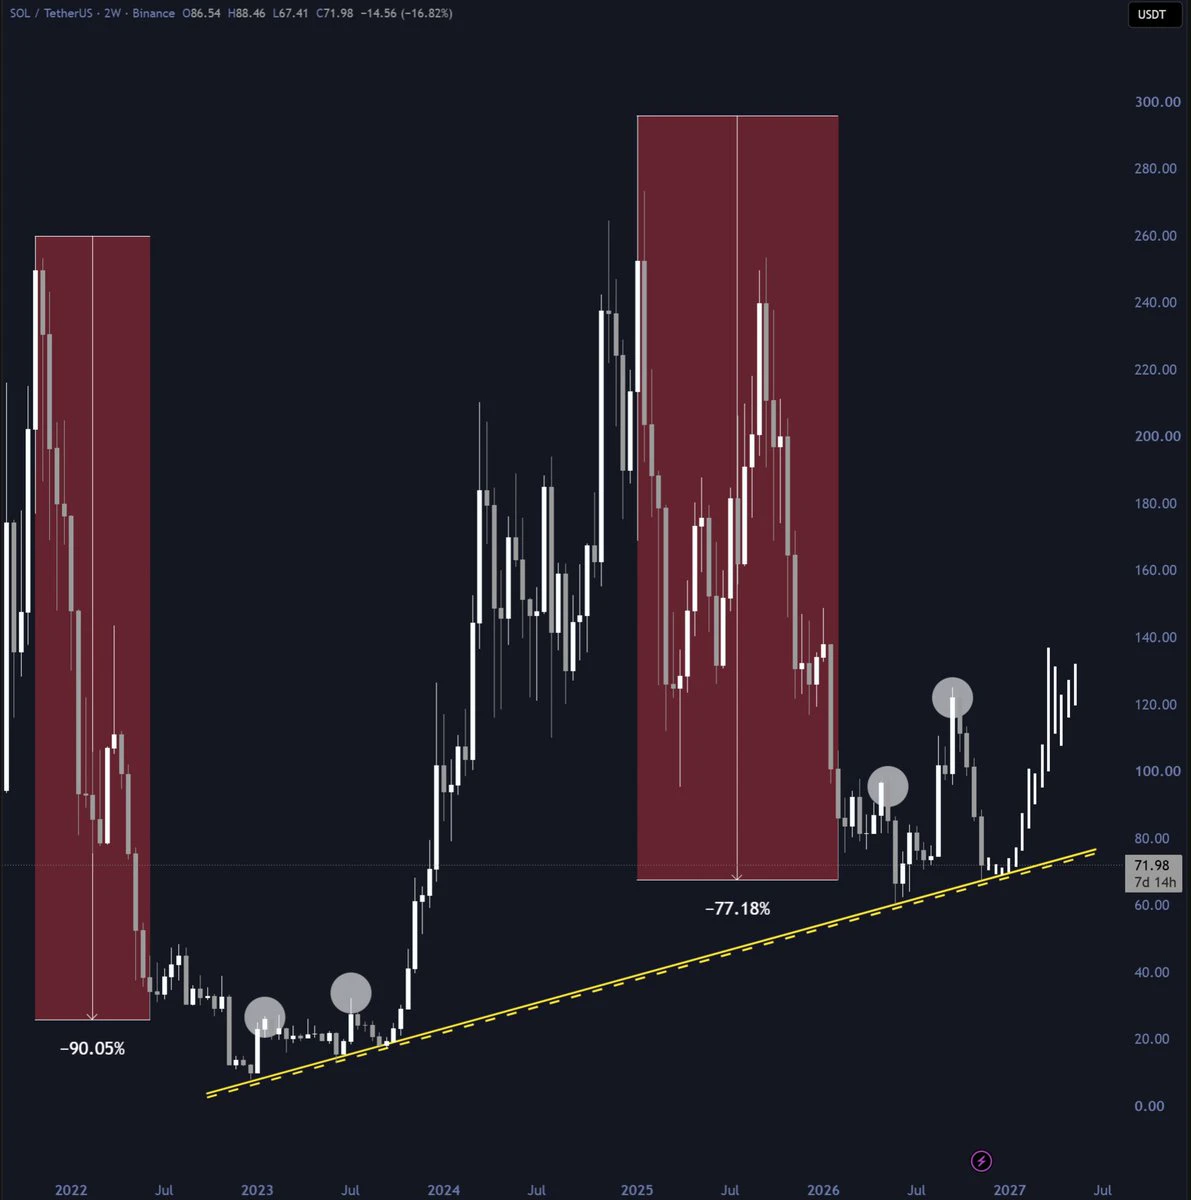
$SOL just retested its multi year support trendline
Whenever SOL has tapped this zone, it has rallied at least 100%
post-image
SOL-0.77%
Trenches
mihao
m
bade
b
mihao
4Cxj...pump
Market Cap
$.
Change
.
24h Vol
$.
Holders
.
Snoopy
S
bade
b
Snoopy
7mEh...47Cn
Market Cap
$.
Change
.
24h Vol
$.
Holders
.
bill
b
bade
b
bill
85Rh...pump
Market Cap
$.
Change
.
24h Vol
$.
Holders
.
AGT
A
bade
b
AGT
0x5d...e274
Market Cap
$.
Change
.
24h Vol
$.
Holders
.
PIEVERSE
P
bade
b
PIEVERSE
0x0e...25a9
Market Cap
$.
Change
.
24h Vol
$
Holders
.
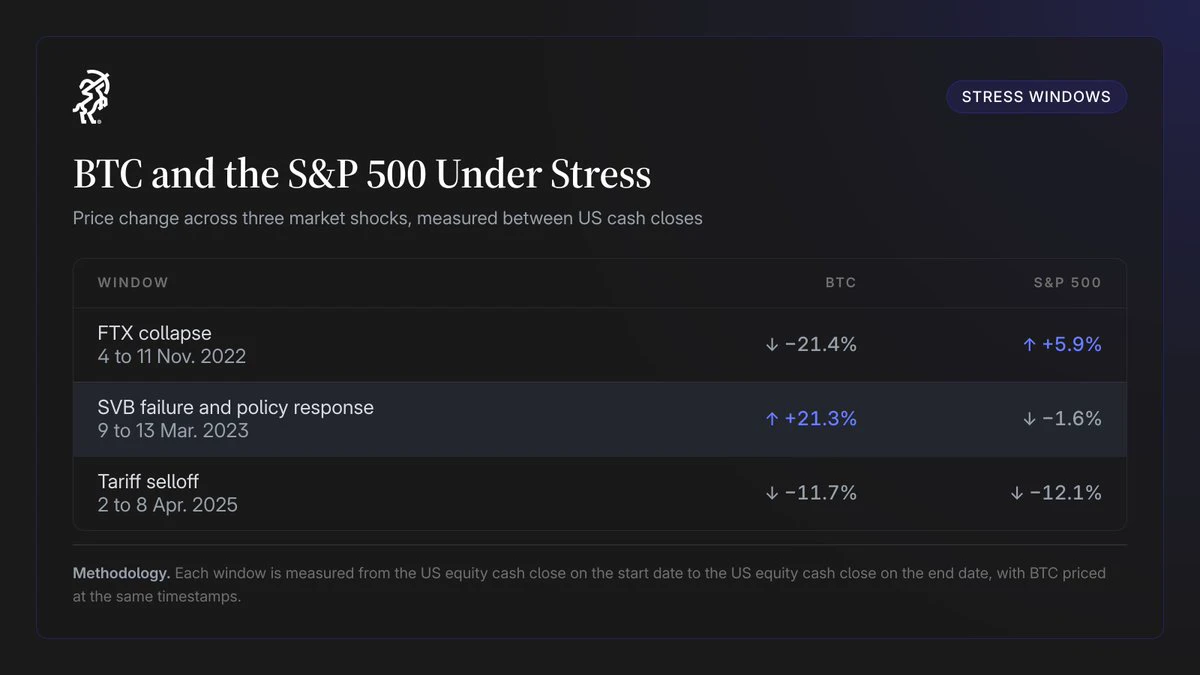
1️⃣ During the FTX collapse, BTC fell 21.4% while the S&P 500 rose 5.9%.
2️⃣ Around the SVB failure, BTC gained 21.3% as stocks slipped 1.6%.
3️⃣ In the 2025 tariff selloff, both fell about 12%.
The type of shock shapes whether crypto moves with stocks.
post-image
BTC-0.67%
Bitcoin/Ethereum short setups at 66,000 and 1,840 once again successfully moved down to around 64,400 and 1,793, with decent overall room. In fact, the short during last night's sharp drop and the longs at 1,720 and 62,500 this morning also had clear room. #Gate直通IPO第三期Anthropic
BTC-0.65%
ETH-1.23%
  • 3
Next Week’s Gold Outlook: Lingering Bearish Pressure Remains, with Rebounds Likely to Face Resistance!

This week’s data gradually came in, and the earlier bullish factors have been fully priced in. Overall market sentiment is cautious, with insufficient bullish momentum. Every modest rebound has been met with selling, making a sustained short-term rally unlikely.

Gold prices continued to fluctuate and retreat this week, and are currently consolidating around 3880. The short-term structure is weak, with strong resistance around 3920 above, severely limiting rebound potential. Overall, the tre
post-image
XAU+0.38%
evening updates
live-cover
LIVE2,031
The AI hot-money cycle isn’t over—but the opportunity isn’t in the large models themselves; it’s in the application layer. Burning cash on infrastructure doesn’t build a moat. Deployable agents and tools are where the real value is. The same logic as a stop-loss sweep followed by an immediate rebound applies here: application teams that have been unfairly beaten down may actually be opportunities. Share any additions in the comments.
post-image
  • 1
  • 2
Hey ChatGPT, make me look like a GTA6 character.
post-image
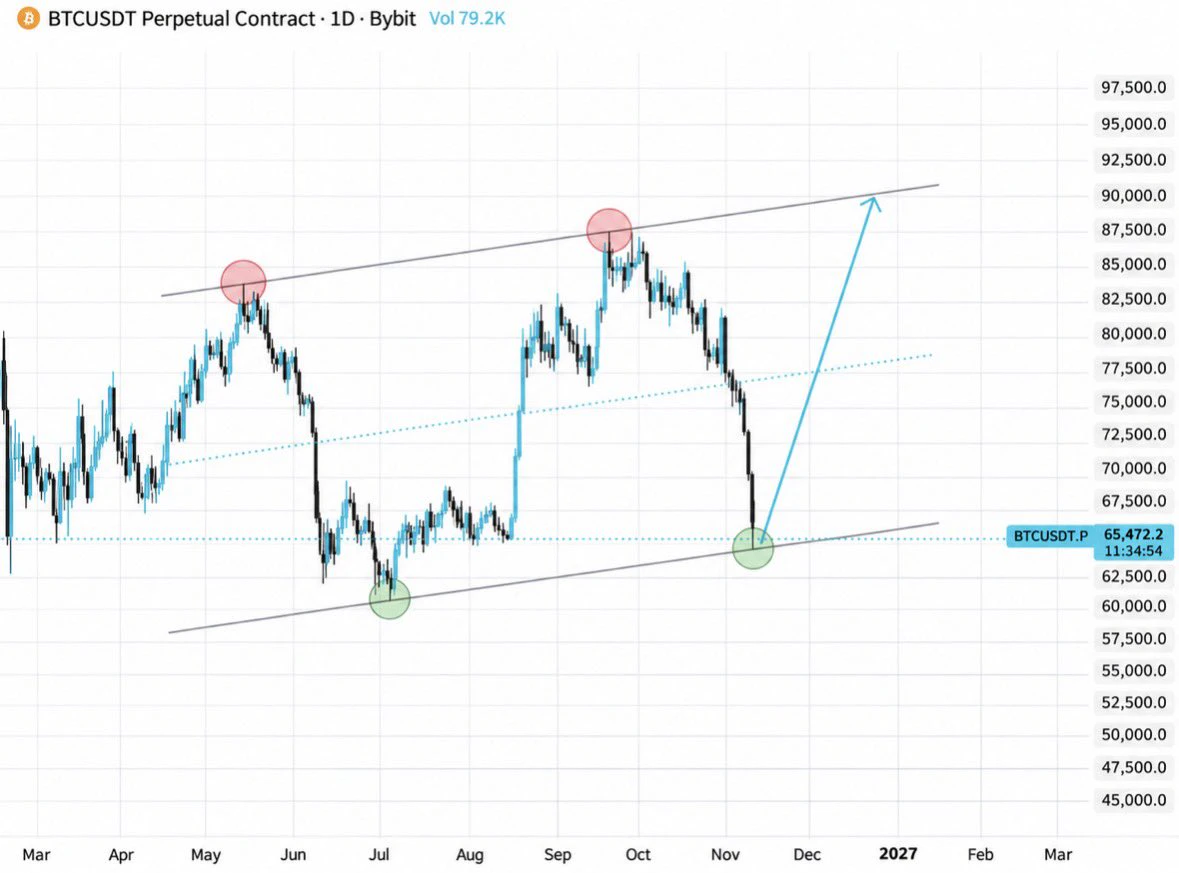
Why is everyone ignoring what’s happening with $BTC right now?
Something big could be coming, Be patience.
post-image
BTC-0.67%
  • 2
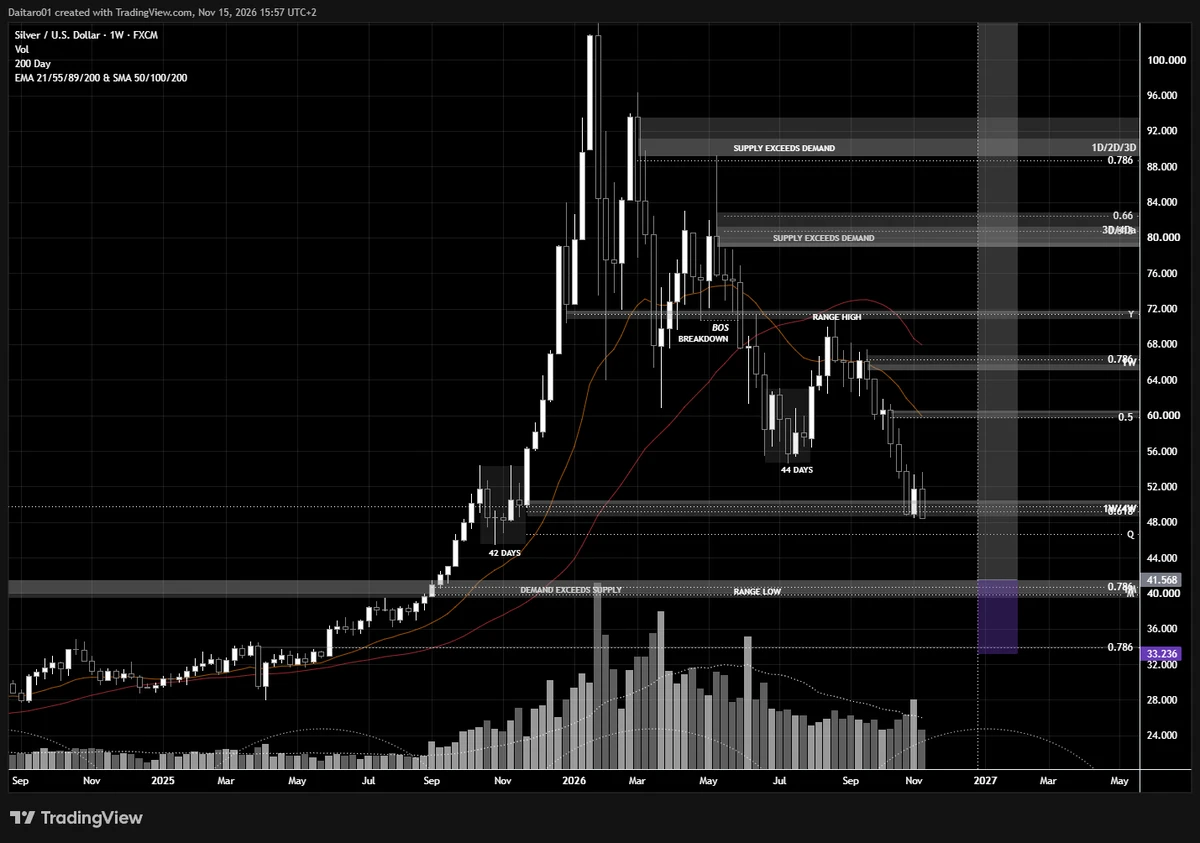
Low 40s or even mid 30s on SILVER ?
post-image
XAG+0.47%
#ETH #ShareWeekly #WCTCS9
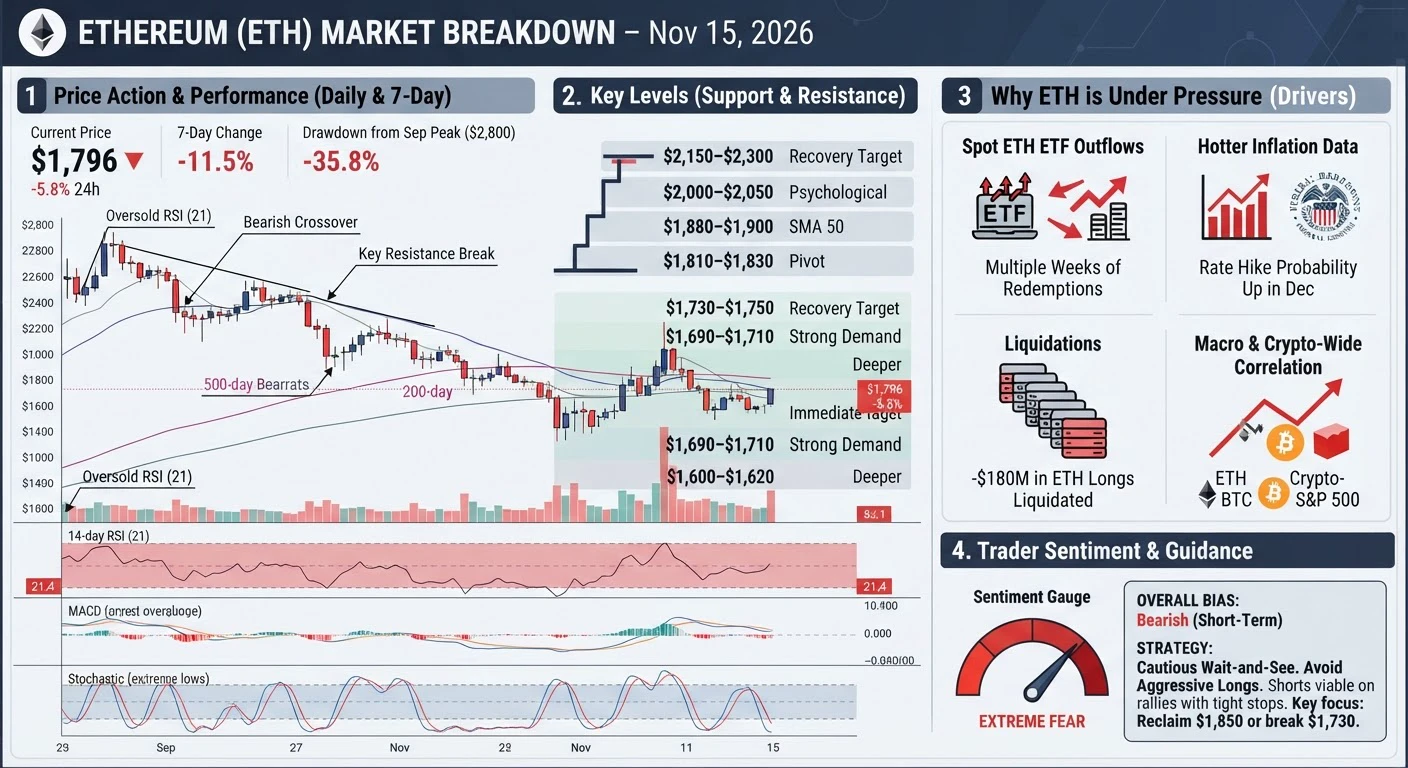
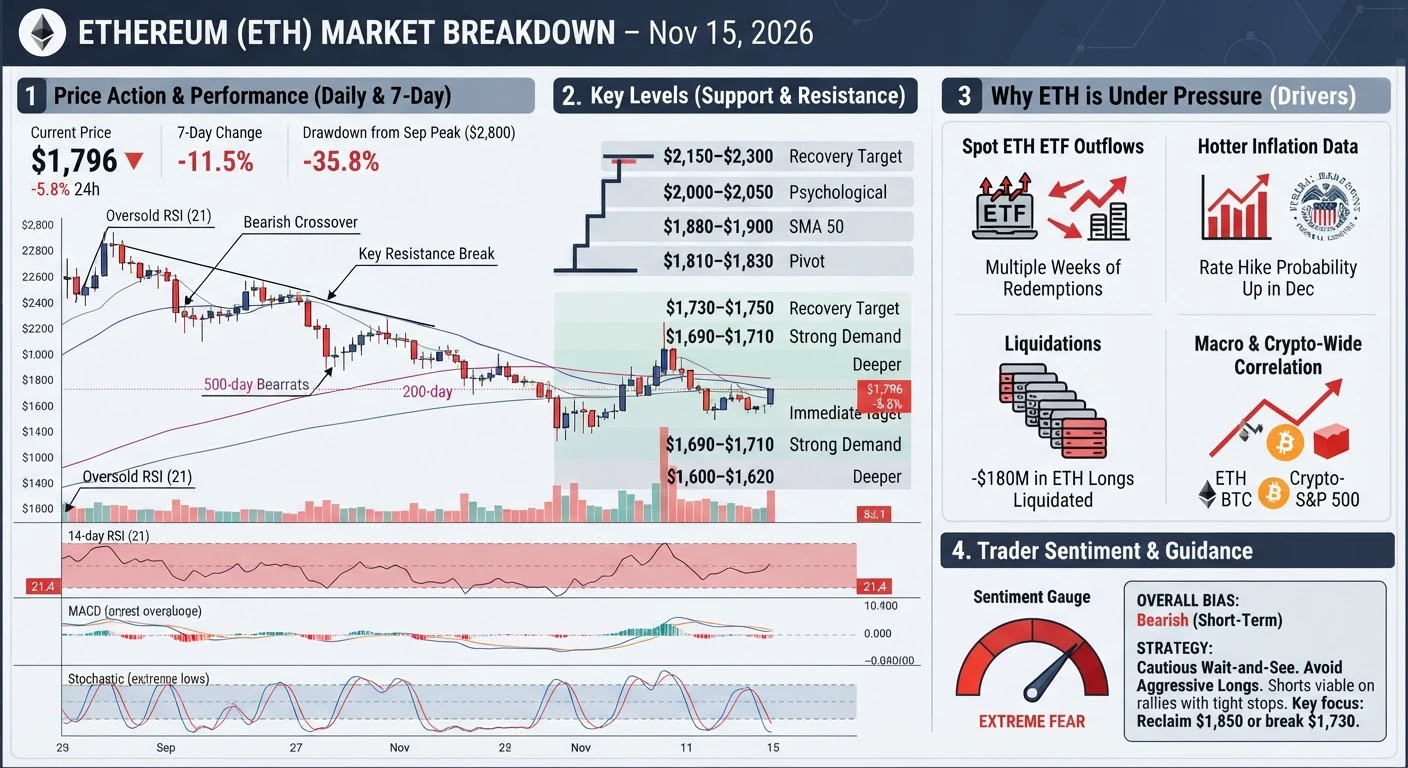
Ethereum (ETH) Full Market Breakdown – November 15, 2026

Ethereum is trading near the $1,790–$1,810 area after continued pressure. Recent quotes place it around $1,791 to $1,808, with 24-hour declines of roughly –5.5% to –6%. Market capitalization remains second only to Bitcoin. Volume has stayed elevated during the sell-off, reflecting both forced liquidations and ongoing institutional activity.

Recent Performance and Percentage Moves
Over the past 7 days ETH has dropped approximately –10% to –12%, falling from levels near $2,050–$2,160 into the high $1,700s and
post-image
ETH-1.26%
BTC-0.67%
$ETH BTC ≈ $65,300–65,500
ETH ≈ $1,820–1,830
Precise entry levels:
Bitcoin
• Long: 62,000–63,500
• Short: 66,800–67,800
Ethereum
• Long: 1,700–1,750
• Short: 1,900–1,950
Long/short probabilities (combined market-wide):
Long 55% (extreme fear + oversold, short-term rebound favored)
Short 45% (downtrend remains intact, clear resistance to a rebound)
Strict stop-loss, NFA.
❤️‍🔥❤️‍🔥❤️‍🔥❤️‍🔥❤️‍🔥❤️‍🔥❤️‍🔥❤️‍🔥❤️‍🔥❤️‍🔥❤️‍🔥
ETH-1.26%
I've been having a blast with AI these past couple of days. I've crammed over 100 GB of AI slop onto my hard drive, haha. My credits are burning🔥
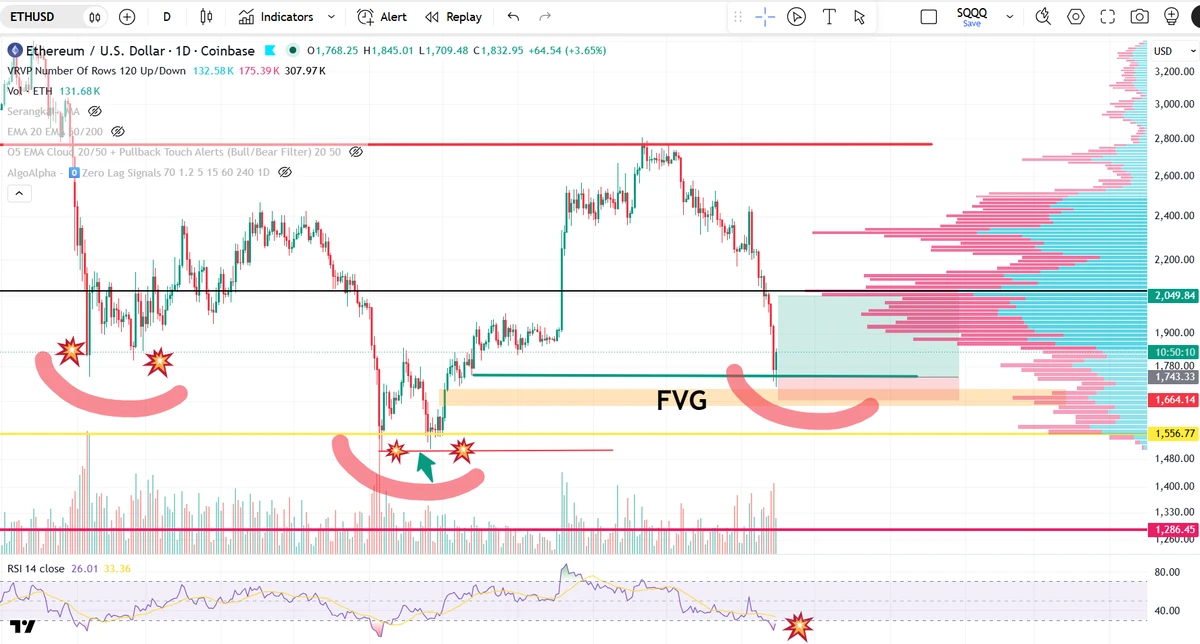
ethereum:native nailed my $1750 long entry after filling liquidity and sweeping some lows - this 10x long is up over 35% already - we now have the opportunity at forming the right shoulder for the inverted H&S here - also finally reaching OVERSOLD levels
post-image
ETH-1.23%
MARKET UPDATE
live-cover
LIVE2,063
Understanding yourself is more important than understanding the latest trends
Many people think they’re highly knowledgeable but poor
In fact, they’ve just consumed too much information
They’ve seen heaps of advice, trends, and other people’s success stories
Yet they can’t tell what’s relevant to them
They don’t know what opportunities suit them
or how they can make money
Information ≠ understanding, and understanding ≠ ability
Being able to create value doesn’t necessarily mean you’ll be rewarded
To get out of a rut
the key is to find your place
and keep honing your skills
Everyone has differ
post-image
“Don’t Mistake a Recovery for a Reversal: The Allure of 66,000 and the Chill at 1,700”
$BT The price has climbed back above 66,000, and talk of a “V-shaped reversal” has resurfaced in the community. But in my view, this looks more like a technical recovery after being oversold than a trend restarting. In the previous sell-off to 62,000, bulls were liquidated in droves, with total liquidations across the market reaching 2 billion. That 6% long lower wick is there for all to see—not a memory that can be erased by just any bullish candle. Chasing longs today could easily get you stopped out if yo
post-image
ETH-1.26%
#SOL #WCTCS9 #ShareWeekly
Solana (SOL) Full Market Analysis: Recovery Outlook, Price Targets, Network Growth, Liquidity and Trading Strategies

Solana is at a critical point after a sharp market correction. The key question is whether SOL can build a sustainable recovery or whether sellers will push it towards lower support zones. A useful analysis must go beyond a single price candle: spot demand, futures positioning, open interest, funding, liquidations, ETF flows, Bitcoin's direction, network development and trader psychology all matter. This is a market scenario analysis, not a promise t
post-image
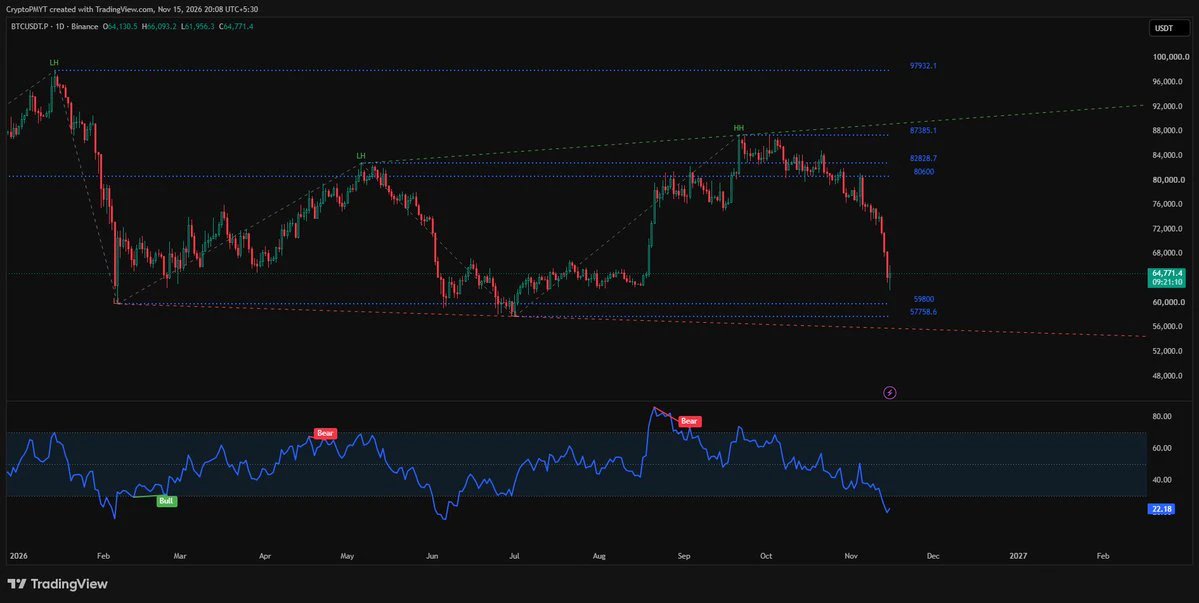
This bitcoin:native chart still isn't convincing me to buy the dip.
Here's my bearish case:
bitcoin:native has dropped aggressively from the $87K region and is now trading around $65K. The price structure is still weak, with lower highs forming and no convincing sign of a bullish reversal.
Yes, the $62K area has held for now, but why should we assume that's the bottom?
There is still significant liquidity sitting below the recent lows, particularly around $59.8K and $57.75K. With barely 1.5 months left in 2026 and no convincing bullish momentum across the broader market, I don't see a strong
post-image
BTC-0.67%
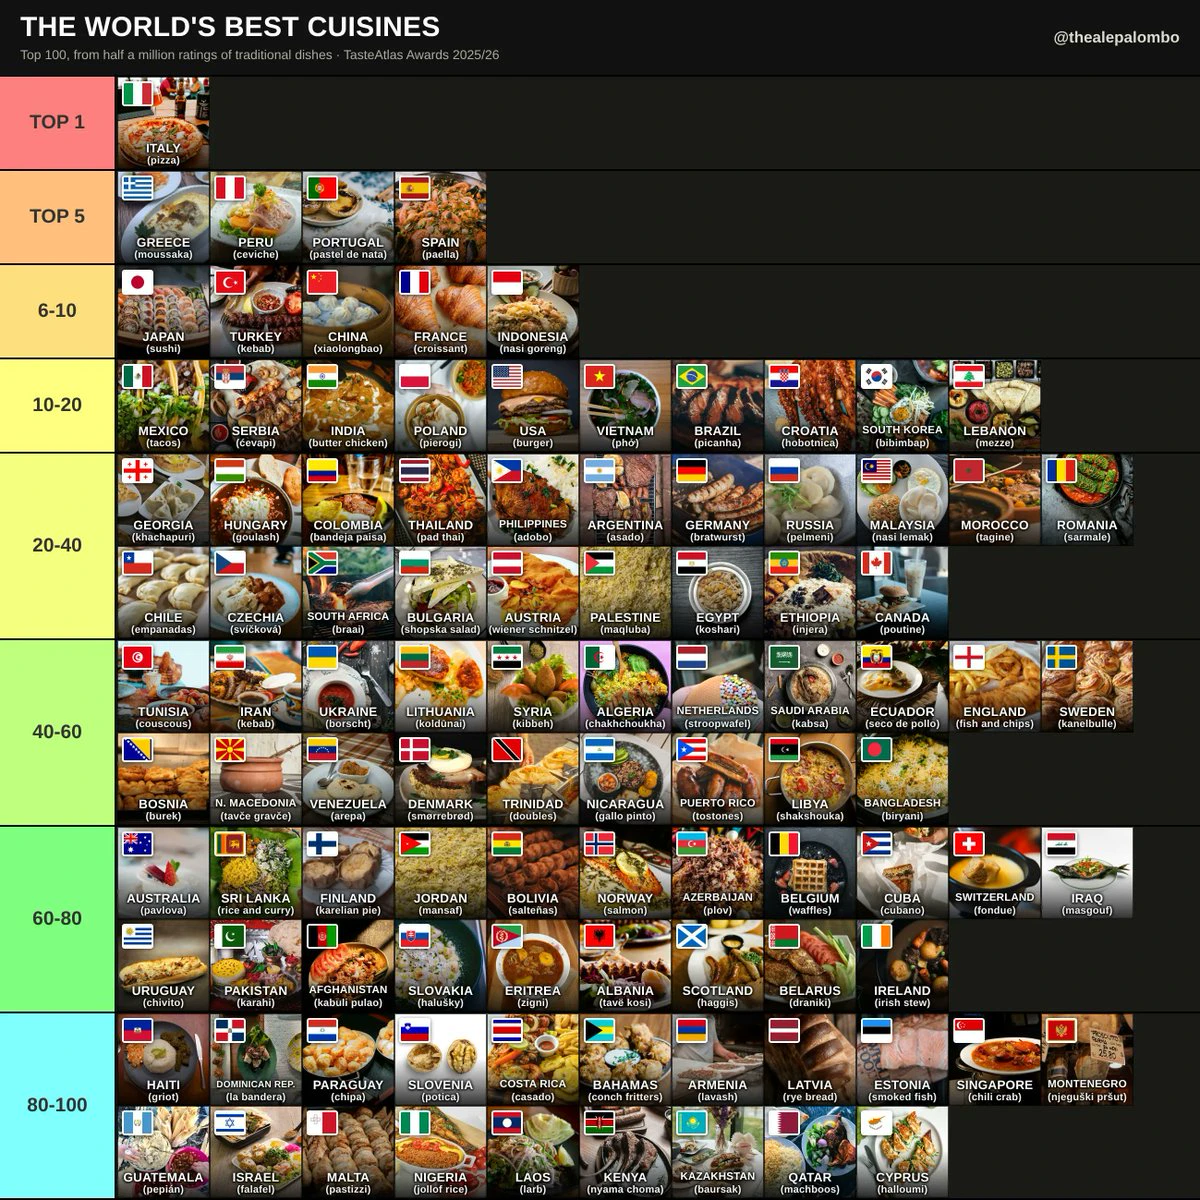
Well, it's hard to imagine they call pizza a cuisine 🍳
post-image
Load More

Join 40 M users in our growing community

⚡️ Join 40 M users in the crypto craze discussion

💬 Engage with your favorite top creators

👍 See what interests you

Trending Topics

GateIPOAccessAnthropic

355.8K Views2.7K Discussing

Gate IPO Access Phase 3 features Anthropic (ANT), with USDT subscription interest starting from 100 USDT. Successful allocations will be delivered as real shares to Gate Stock Accounts. Indicative price: $70–$78/share Subscription: Nov 12–17 (UTC+8) Allocation is not guaranteed. Please manage risk accordingly.

Dr.HanOxfordUnionSpeech

151.7K Views513 Discussing

USOctoberPPIBelowExpectations

484.1K Views1.5K Discussing

View More