Share crypto content and earn up to 60% commissions through content mining.
placeholder
gatefun
A few days ago, I was still calculating whether I had enough money for instant noodles this month; this morning, I was already wondering whether to add sausage. When the sell-off hit during the morning session, I happened to be watching the chart. The plunge looked fierce, but I noticed that every push upward fell just short, and the volume simply failed to keep up. This kind of move clearly shows insufficient buying support, with a strong whiff of a bull trap.

And sure enough, it didn’t disappoint: it steadily slid from 1.0045 all the way down to 0.7632, with +1156.84% secured. Nailed it. T
XRP-1.88%
DOGE-3.06%
View Original
post-image
  • Reward
  • Comment
  • Repost
  • Share
After Blackwell Comes Rubin—A $1 Trillion Relay Race
Nvidia’s long-term story is actually quite simple: each generation of chips is more profitable than the last. After Blackwell comes Rubin, and after Rubin there will be something new.
Blackwell is the current mainstay. TrendForce expects Blackwell to account for 71% of Nvidia’s high-end GPU shipments in 2026. Nvidia’s Q1 earnings report showed data center revenue of $75.2 billion, up 92% year over year. Blackwell Ultra is expected to begin shipping this quarter, while GB300 will also enter production this quarter.
But the market is more focu
NVDA2.15%
View Original
post-image
post-image
post-image
  • Reward
  • Comment
  • Repost
  • Share
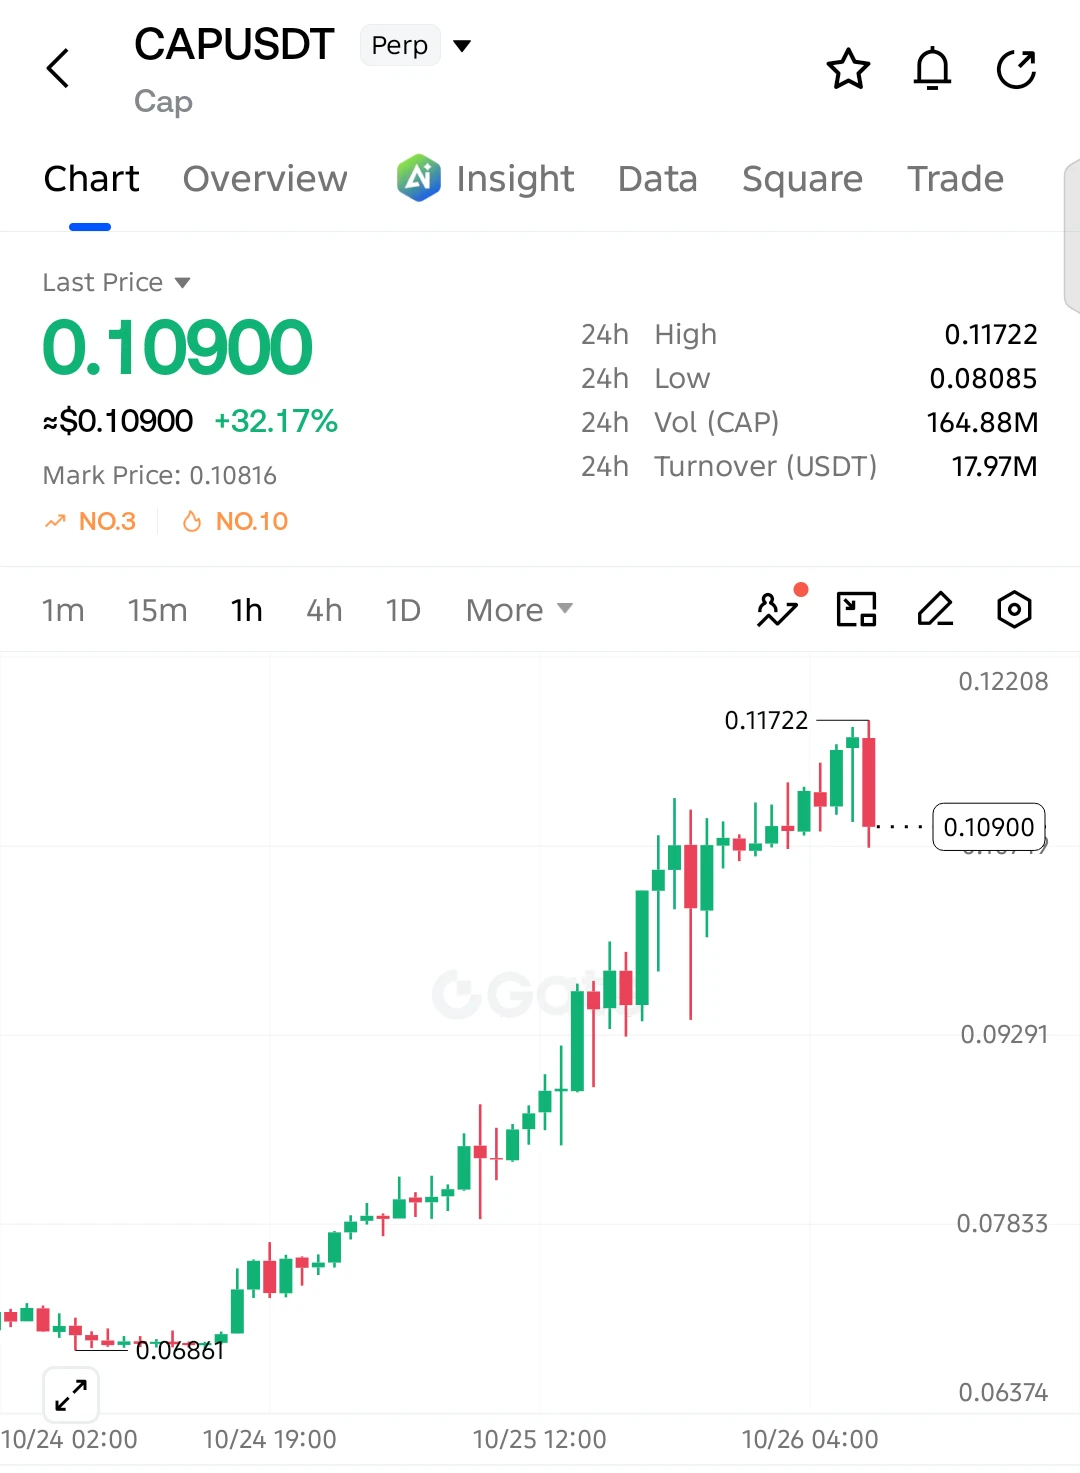
I thought I’d be counting stars until dawn, but the market unexpectedly sang me a lullaby. When I checked the chart after lunch, that rebound looked pretty fierce, but the volume didn’t follow, and the resistance above was too obvious. I thought, isn’t this basically a freebie?

Entered at 0.2056 and saw 0.0926, with +1080.26% safely locked in. This move was purely the market being in a good mood and casually scattering some gold coins, which just happened to hit me on the head. Staying out of the market isn’t a crime; opening reckless positions is. I’d rather miss a limit-up than catch a fal
SOL-0.36%
XRP-1.88%
View Original
post-image
  • Reward
  • Comment
  • Repost
  • Share
No reason $GC shouldn't just explode from here.
post-image
  • Reward
  • Comment
  • Repost
  • Share
I had just switched the software to the background, and it shot right back up—are you playing hide-and-seek with me? $ONDO When the screen was glowing green, I was thinking: at 0.3261, it held after the pullback, and the buying pressure was ridiculously strong, so what was there to hesitate about?
While everyone else was running, I chose to take a look at the support strength at the bottom. At the time, the long-entry signal was given, but hardly anyone dared to follow. Now look: 0.3659, +586.7% in the bag. What a huge gain—staying up late watching the charts was worth it.
Once the rhythm is
ONDO-3.47%
LAB-2.02%
XRP-1.88%
View Original
post-image
  • Reward
  • Comment
  • Repost
  • Share
A bearish signal has appeared for gold, but could this time be different?

$XAU /USDT - SHORT

Trading plan:
Entry: 4663.19 – 4671.69
SL: 4708.24
TP1: 4636.84
TP2: 4616.44
TP3: 4585.84

Why pay attention to this setup?
- $XAU /USDT is bearish on the 4-hour timeframe, but the 1D trend is still range-bound, not in a one-way decline.
- The 15-minute RSI has reached 70.34, indicating short-term overbought conditions and accumulating pullback pressure.
- Key levels: 4667.44 is the current reference level, with TP1 at 4636.84 and TP2 at 4616.44 below.
- Why now? Short-term overbought conditions +
XAU-0.17%
View Original
post-image
post-image
  • Reward
  • Comment
  • Repost
  • Share
This trend doesn’t even require me to think—the account is dancing on its own. Just after seeing the bearish news, $ESPORTS was still stubbornly holding up, but selling pressure was crushing it, and every rebound came with little volume. There was simply no one buying the dips. I wasn’t heavily positioned either, just testing with a small position—the entry was comfortable enough. Shorting in this market is following the trend, not going against it.
Hold as long as the trend remains intact; get out when it breaks down. Don’t fall in love with a stock.
I shorted at 0.04289, and it’s now at 0.01
ESPORTS2.27%
SNDK0.27%
ZEC-4.69%
View Original
post-image
  • Reward
  • Comment
  • Repost
  • Share
This was purely because market sentiment was good—it casually tossed out some coins, and they happened to land right on my head🍀. Before the market had fully kicked off, around the time I had just finished lunch, I was watching the 0.0001670 level. The rebound had no volume, and the price was lingering below the key level, looking like a bull trap no matter how I saw it. I judged at the time that no one would take it higher, so I might as well go with the short. When I came back after lunch, I saw 0.0000565, +1300.47%—it really paid off😋. Some friends always want to wait for a bigger rebound
BTC0.21%
LAB-2.02%
View Original
post-image
  • Reward
  • Comment
  • Repost
  • Share
$GT SPIKED TO 8.38, NOW SLIDING BACK TO THE MOVING AVERAGES CONSOLIDATION OR THE START OF A BREAKDOWN? ⚠️📉
GateToken made a strong steady climb from 6.73 all the way to a spike high of 8.38, then got smacked with a sharp rejection candle and is now chopping right around the moving averages. Unlike a pure blow-off top, this one built real structure on the way up but that rejection wick and the fade since are worth respecting. Is this just a shakeout before continuation, or the top of the move? Here's the play.
SIGNAL TRADE 🚨
Pair: $GT /USDT
Type: SHORT
Leverage: 5x
Entry Zone: 7.80 – 7.95
GT-3.34%
post-image
  • Reward
  • Comment
  • Repost
  • Share
🚨🚨🚨
JUST IN: $5B in $IBIT options expire on Sept 18.
Calls dominate: $3B vs $2B in puts.
Max pain implying roughly $71K for $BTC .
Source Glassnode
IBIT0.15%
BTC0.21%
post-image
  • Reward
  • Comment
  • Repost
  • Share
Ethereum has shown a high degree of correlation with Bitcoin overall, forming a volatile downward pattern after an initial surge and pullback. It began retreating from the high around 2527 early today, gradually breaking below short-term support during the choppy decline and reaching a low near 2445. It is currently trading around 2447, steadily following Bitcoin’s decline throughout, with clear market correlation.
The daily downtrend channel continues to expand in an orderly manner. After a short-term surge that lured in longs and the completion of high-level distribution and topping, the mar
ETH-0.87%
BTC0.21%
View Original
post-image
  • Reward
  • Comment
  • Repost
  • Share
BNB 4-hour bearish signal armed, with the long-short tipping point at 696.6—which side are you on?

$BNB /USDT - SHORT

Trading plan:
Entry: 695.3 – 697.9
SL: 709.2
TP1: 687.1
TP2: 680.8
TP3: 671.3

Why pay attention to this setup?
- Current price is 696.6. The 1-day trend is range-bound, while a SHORT signal has appeared on the 4h timeframe, with 55.4 confidence (slightly above the 50 threshold).
- Key levels: Entry reference at 696.6, TP1 at 687.1 (-1.4%), TP2 at 680.8 (-2.3%), and SL at 709.2 (+1.8%), giving a reasonable risk-reward ratio of approximately 1:1.5.
- The 15-minute RSI is 48
BNB-0.59%
View Original
post-image
post-image
  • Reward
  • Comment
  • Repost
  • Share
Layout for Bitcoin, Ethereum, and Dogecoin
gate liveLIVE
1,608
  • Reward
  • 3
  • Repost
  • Share
TalkingAboutMemeAsTheCoinMakes:
Bull market, come back soon 🐂
View More
$LAB /USDT 4-hour chart hides deadly risks—dare to follow?
$LAB /USDT - SHORT
Trading Plan:
Entry: 0.06664 – 0.06750
SL: 0.07121
TP1: 0.06396
TP2: 0.06189
TP3: 0.05879
Why pay attention to this setup?
- 4-hour SHORT signal with confidence as high as 95%; the trend is clearly downward.
- 1D trend is bearish, with bears in control; any rebound is a shorting opportunity.
- 15-minute RSI is 42.72, not yet oversold, so there is still room to move lower.
- Current price is 0.06707, with clear EMA resistance; an entry can be made on a rebound toward around 0.06750.
- TP1 at 0.06396 and TP2 at 0.06189
LAB-2.02%
View Original
post-image
post-image
  • Reward
  • Comment
  • Repost
  • Share
What Is the Options Market Betting On? $280 Billion in Market Value Could Vanish Overnight
Options market data is often more honest than any analyst report—because traders are betting real money, not writing reports just to get by.
According to the latest options market pricing, Nvidia's implied stock-price move after its earnings release is approximately ±5.4%. Based on Nvidia's current market cap of more than $5.2 trillion, this means roughly $280 billion in market value could evaporate or surge overnight.
What does $280 billion represent? It is larger than the total market capitalization of
NVDA2.15%
View Original
post-image
post-image
post-image
  • Reward
  • Comment
  • Repost
  • Share
9% down in a single session. Is SanDisk cracking or is the market just handing patient buyers a second look?
Let's break this down like traders, not headline-chasers.
1. What happened
SanDisk (SNDK) fell roughly 9% on August 24, part of a broader memory-sector slide that also hit Micron and Western Digital. Asian peers Samsung and SK Hynix sold off hard too, so this wasn't an SNDK-only story it was sector-wide.
2. Why the drop matters
A 9% single-day move on a stock that's been one of the biggest AI-infrastructure winners this year isn't noise. It tells you positioning was crowded, expectatio
SNDK0.27%
post-image
  • Reward
  • 4
  • Repost
  • Share
SlippageSigh:
90% of the bullish news has already been priced in, so a single rumor can trigger a 9% drop. This isn’t a collapse in fundamentals—it means expectations were too high. The truly good opportunities often emerge gradually when no one dares to step in.
View More
SNDK at $1,400—what are the trump cards of the bulls and bears?
SNDK is currently in the $1,400–$1,500 range. The bulls and bears are confronting each other here—what are their respective trump cards?
The bulls’ trump cards:
First, 17x P/E + 7x forward P/E. SNDK’s valuation has fallen to historical lows. If NBM can truly break the cycle, this is a golden buying opportunity.
Second, $15.5 billion in buybacks. The board approved an additional $14 billion in buybacks, bringing the total authorization to $15.5 billion. Spending $15.5 billion on buybacks when the stock is at $1,400 means management
SNDK-0.77%
View Original
post-image
post-image
  • Reward
  • Comment
  • Repost
  • Share
$tia @celestia $celestia #celestia #tia
ciddi misin aq????**????? WTFF ❗❗❗❗❗❗❗❗❗❗❗❗❗❗❗❗❗❗❗❗❗❗
TIA-3.89%
post-image
  • Reward
  • Comment
  • Repost
  • Share
August 26 Strategy Plan
For followers only, listed by priority
Operation priority ranking
Priority 1: Short on a rebound facing resistance at 2461—2466
This is today’s top-priority plan.
As long as the price has not firmly held above 2466/2476, the bearish bias remains unchanged.
---
Priority 2: Short after a retest following a break below 2440
If the market does not rebound and directly breaks below 2440, wait for a failed retest of 2440—2444 before shorting.
---
Priority 3: Go short-term long at 2414—2422 after the decline stops
Only trade this upon the first touch accompanied by a clear sig
ETH-0.91%
View Original
post-image
  • Reward
  • Comment
  • Repost
  • Share
Load More

Join 40 M users in our growing community

⚡️ Join 40 M users in the crypto craze discussion
💬 Engage with your favorite top creators
👍 See what interests you
  • Pinned