Square
Following
Hot
News
Notifications
Profile
Share your thoughts
placeholder
Article
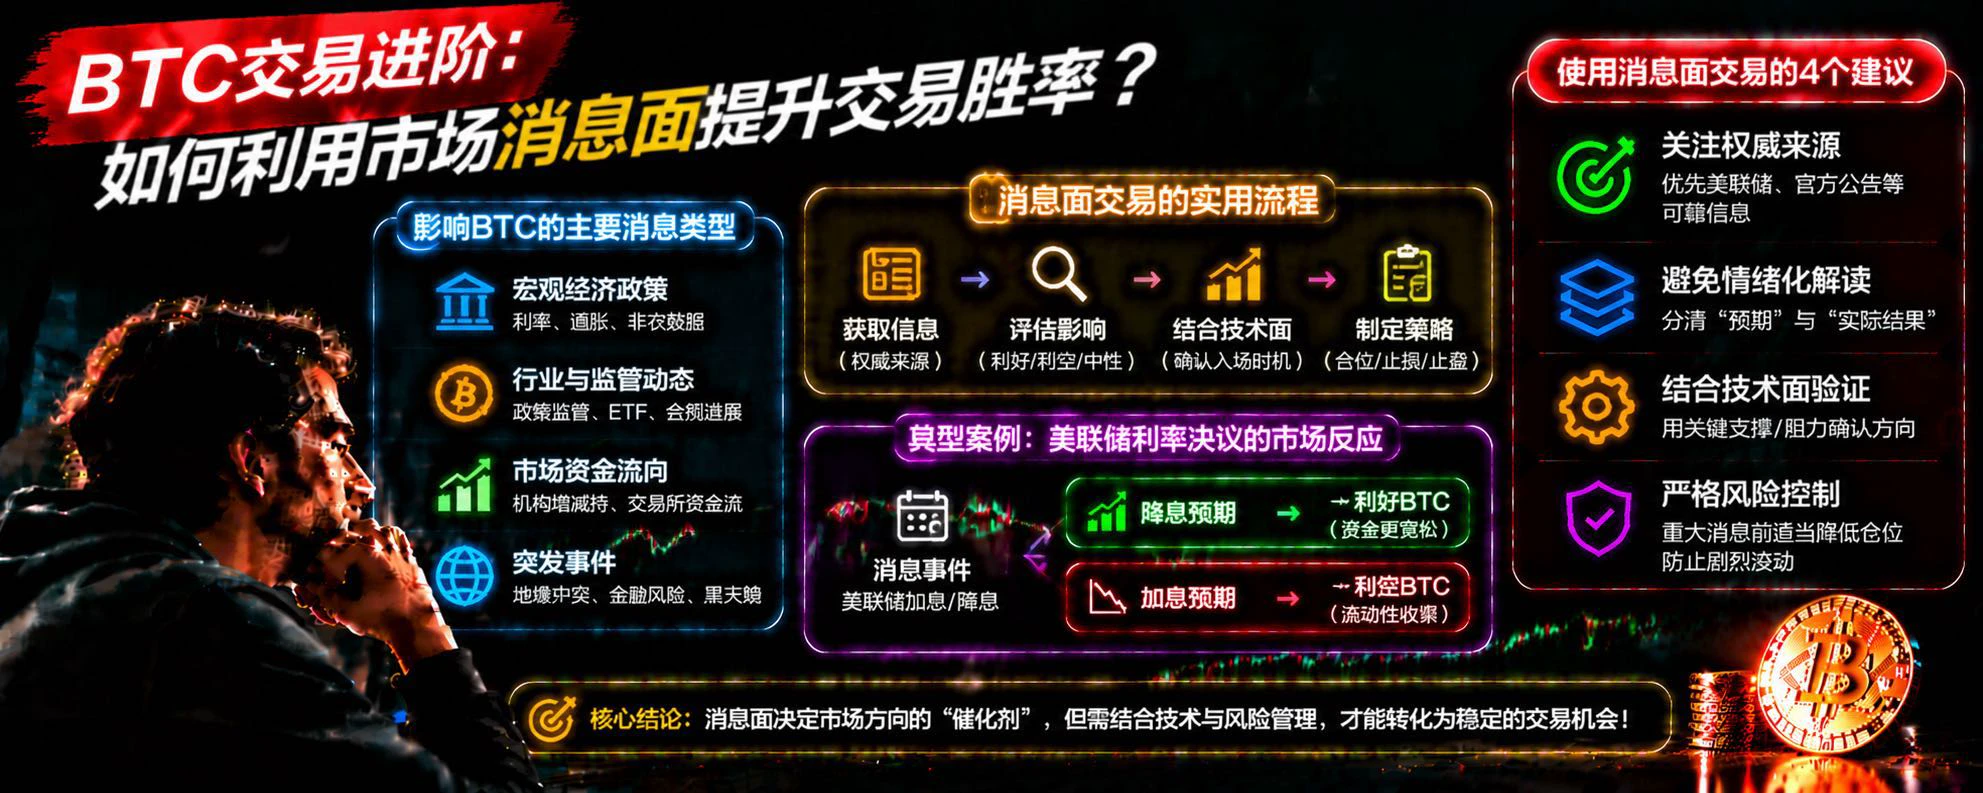
BTC News Analysis: How Can Market News Improve Trading Decisions?

In BTC trading, many people study candlestick charts, MACD, and RSI every day, but overlook an important factor that can significantly affect market movements: news.

Sometimes, BTC suddenly rises or falls in a short period not because technical indicators signaled it in advance, but because of new policies, economic data, or shifts in capital flows. Changes in the news can quickly alter investor expectations and, in turn, affect the balance between buyers and sellers.

So, how should you use news to analyze BTC?

First, follow
post-image
BTC-0.67%
$SENT is gradually building upward momentum after completing a solid basing phase. The price previously found firm support in the $0.0155–$0.0160 range, after which buying continued to come in. $SENT has now climbed to around $0.0169, with bullish sentiment clearly warming. If it can hold above and decisively break through the short-term resistance at $0.0171, it may open up further upside.
Trading reference: Entry range: $0.01675–$0.01690 Target: $0.01750 Stop-loss: $0.01620
$SNDK and ZEC are also worth watching, but the focus remains on confirmation of $SENT 's breakout.
Risk warning: The
post-image
SENT-5.09%
SNDK-0.18%
Trenches
mihao
m
bade
b
mihao
4Cxj...pump
Market Cap
$.
Change
.
24h Vol
$.
Holders
.
IDOL
I
bade
b
IDOL
0x3b...ab07
Market Cap
$.
Change
.
24h Vol
$.
Holders
.
FOOD
F
bade
b
FOOD
FTu5...pump
Market Cap
$.
Change
.
24h Vol
$.
Holders
.
Sakura
S
bade
b
Sakura
9sFG...pump
Market Cap
$.
Change
.
24h Vol
$.
Holders
.
AGT
A
bade
b
AGT
0x5d...e274
Market Cap
$.
Change
.
24h Vol
$.
Holders
.
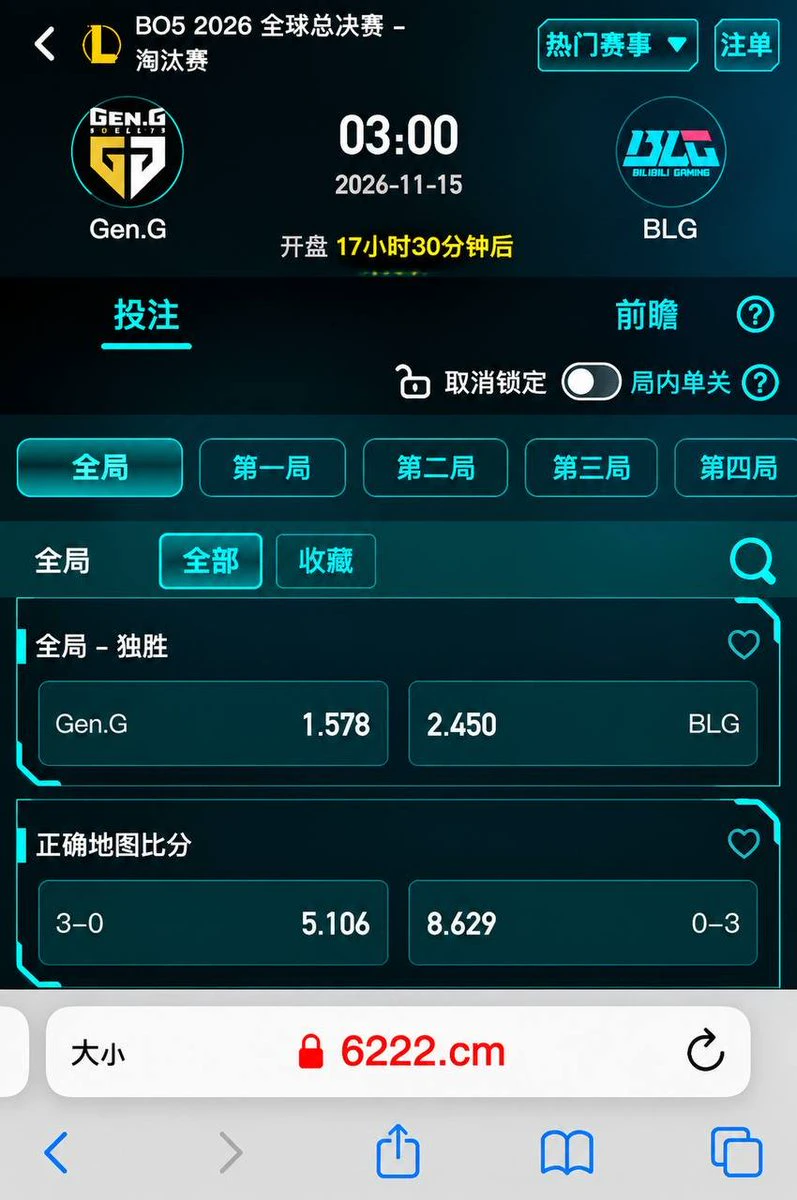
Tonight at 3 a.m., the League of Legends World Championship Finals: GEN vs. BLG!
I’ve already bet on BLG.
You have to have dreams—what if they actually win?
Let’s go, BLG! Bring the championship home! 🏆
#英雄联盟 #S16 #LPL #LCK #BLG
post-image
  • 2
  • 2
During a BTC Pullback, How Can You Tell a Normal Correction from a Trend Reversal?

In BTC trading, one of the most common mistakes is treating every drop as a trend reversal. As soon as the price pulls back, people rush to close their positions or even open short positions. But sometimes the market is simply undergoing a normal correction in an uptrend, after which the price strengthens again.

So, how can you distinguish a normal pullback from a genuine trend reversal?

First, watch the structure of highs and lows. In a healthy uptrend, the price typically forms progressively higher highs an
post-image
BTC-0.67%
$SPCX Big Rocket pulled back after facing resistance overhead. Those who didn't get in earlier can continue going long, with short-term targets around 140 and 142! Big Rocket has been a very resilient asset since U.S. stocks started falling, and the outlook for new highs by year-end remains unchanged!
post-image
SPCX+0.78%
How do you create a BTC trading plan? Build a truly executable trading process!

In BTC trading, many people watch the market and study indicators every day, and often adjust their views based on market changes. But when it comes time to trade, they don’t know where to enter, how much loss should trigger an exit, or when to stop trading.

The problem is often not a lack of analytical tools, but the absence of a complete trading plan.

First, determine the market direction. Before opening a position, observe BTC’s higher-timeframe trend and decide whether the market is rising, falling, or movin
post-image
BTC-0.67%
How should the complete process of a BTC futures trade, from opening to closing a position, work?

Many traders who are new to the BTC futures market go long when they see prices rising and short when they see prices falling. But what truly determines the outcome of a trade is not just your assessment of the direction—it’s whether you have a complete execution process from before opening a position through to closing it.

Step 1: Analyze the market trend. Before opening a position, first assess whether BTC is currently rising, falling, or trading sideways. Use price structure across different
post-image
BTC-0.65%
I got drunk last night, and today I received this picture. I asked her what it meant, but she hasn’t replied.
Do you guys know what it means?
post-image
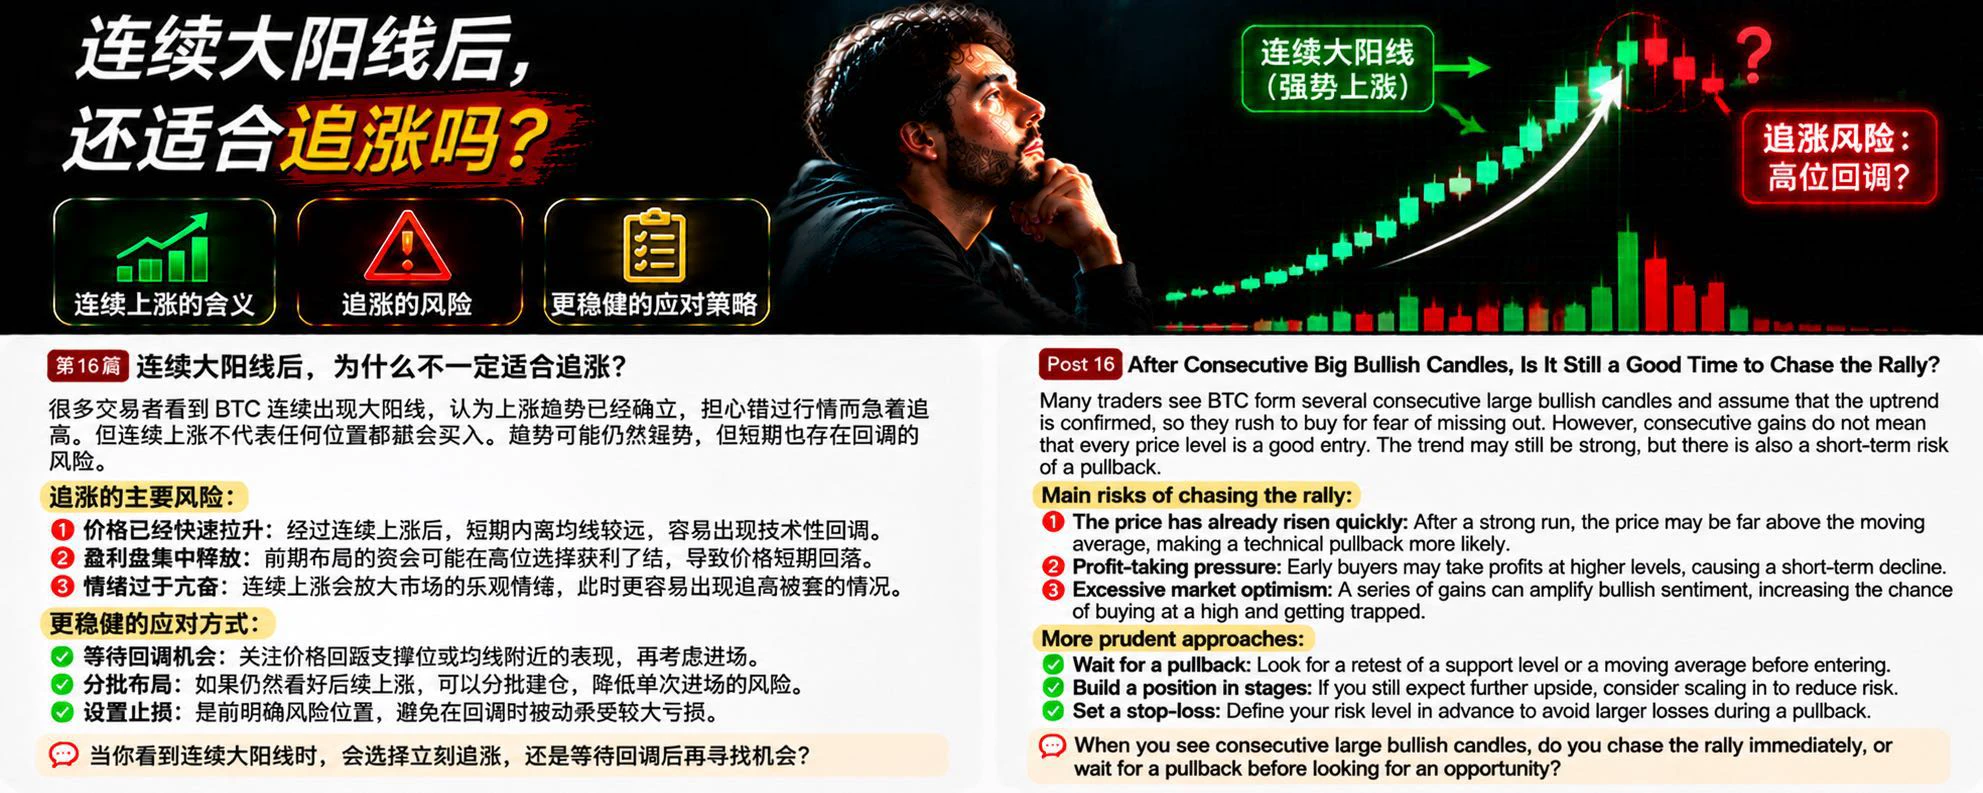
In BTC trading, many people see several large bullish candlesticks in a row and assume the uptrend is fully established. Worried about missing out, they rush to chase the rally. But consecutive gains do not mean that every price is a good entry point. Sometimes, the faster the rally, the more alert you need to be to the risk of a short-term pullback.

Why isn’t it always a good idea to chase a rally after several large bullish candlesticks?

First, the price may have moved too far from a reasonable level. After a series of gains, the short-term price may be far from the moving average. The mar
post-image
BTC-0.67%
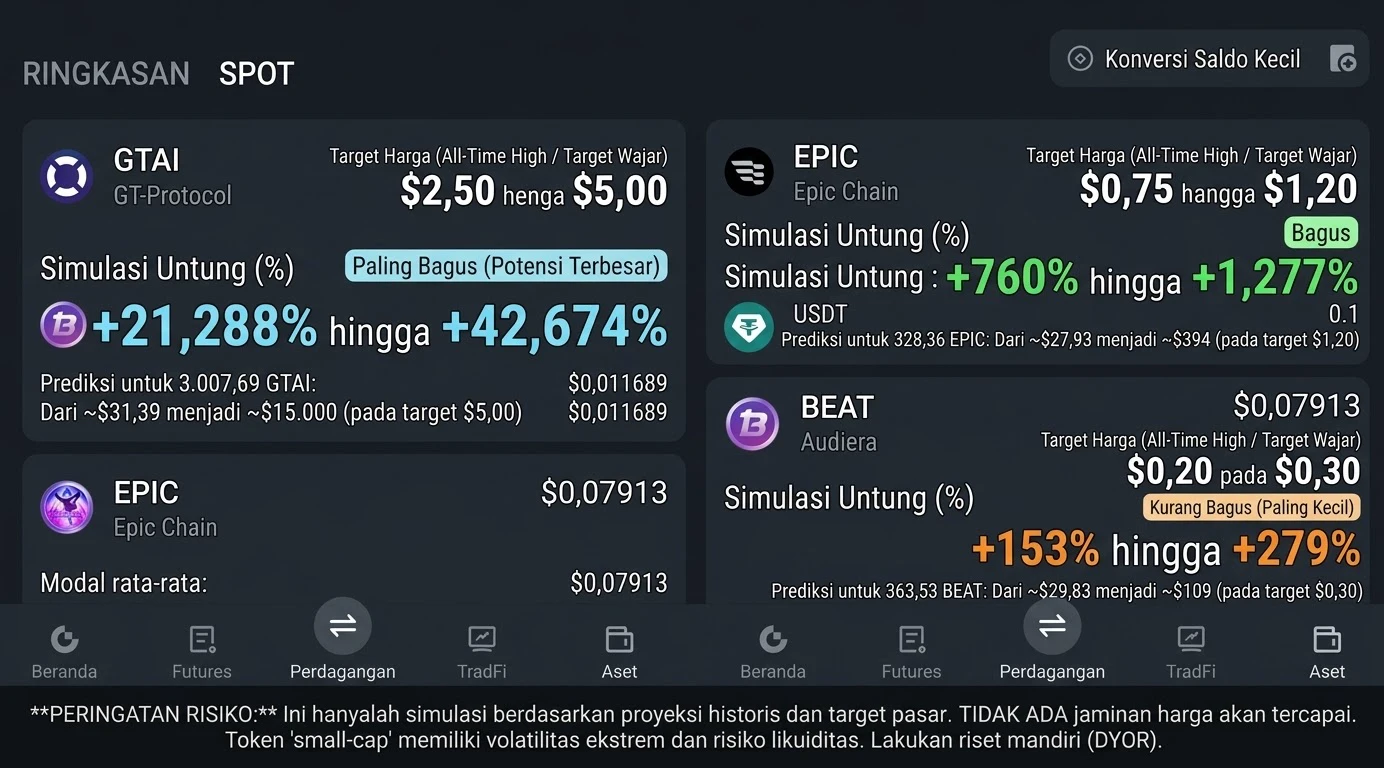
$GTAI What will this cigarette money turn into by the middle of next year!! 😎🤪😜😜😜📖🛸🛸🛸🛸🛸🛸🛸🛸🛸🛸🛸🛰🛸🛸🛸🛸🛸🛸🛸🛸🚀🛸🛸🛸🛸🛸🛸🛸🛸

#GTAI #BEAT #EPIC
post-image
GTAI-4.43%
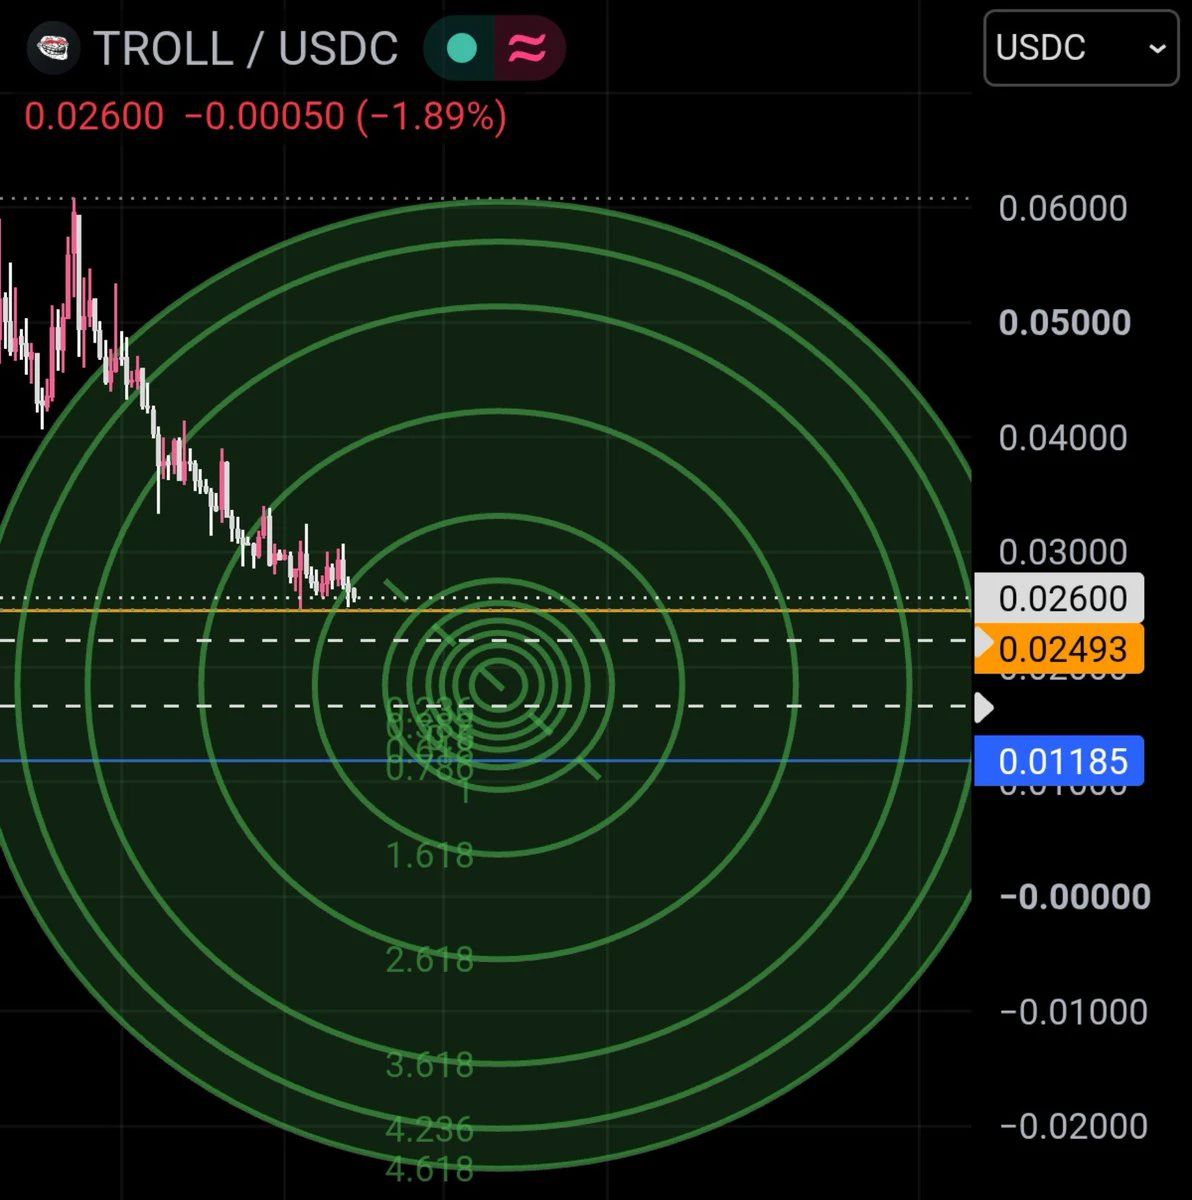
The perfect circle
$TROLL
post-image
TROLL-0.61%
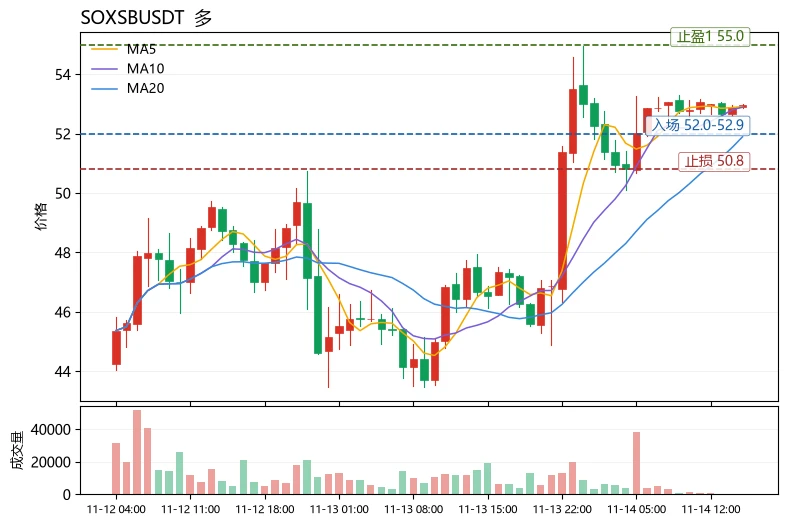
Many people treat the “MA golden cross” as a universal buy signal, jumping in when MA5 crosses above MA20, only to end up buying at the top of a short-term spike. The problem isn’t the moving averages themselves, but looking only at the crossover and not the structure: a moving average crossover only shows that short-term cost basis is rising; it doesn’t indicate whether the trend is healthy.
Take $SOXSB$SOXSB as an example to break down a reusable framework. The current price is 52.98, up 14.30% over 24h. MA5=52.91 is now above MA20=51.896, with the short-term moving average turning up. This
post-image
INIT-2.53%
XRP-1.15%
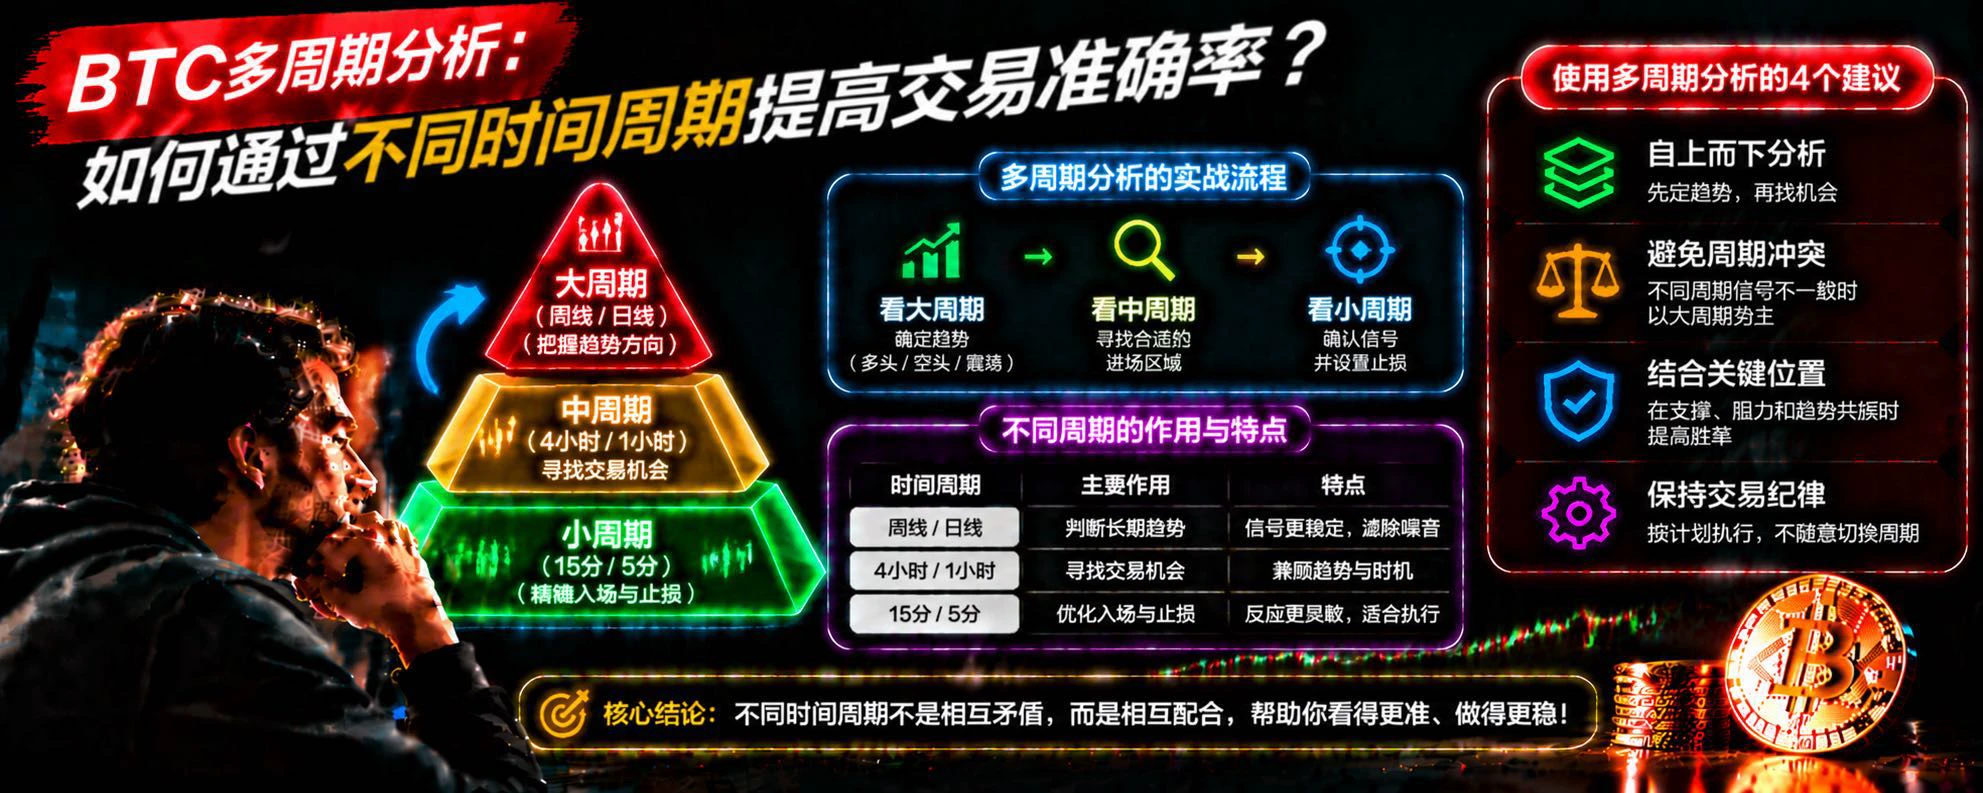
BTC Multi-Timeframe Analysis: How Can Different Timeframes Improve Trading Accuracy?

In BTC trading, many people are used to watching 15-minute or even 5-minute candlestick charts for trading opportunities, but overlook an important point: short-term price movements do not necessarily reflect the market’s true trend direction.

Why do some people correctly predict short-term movements but still end up losing money? One important reason is that they fail to make an overall assessment using multiple timeframes.

First, use higher timeframes to determine the trend. You can use weekly and daily c
post-image
BTC-0.67%
Do one good deed each day,
Day 7 of picking up litter😁
Bending down isn’t weakness; it’s letting go of arrogance.
Revere nature. As we bow and bend,
we pick up civility and cultivate peace of mind.
$BULLA I’m making a bold prediction: if it doesn’t break below the previous low of 0.0248 within 24 hours, I’ll livestream washing my hair upside down. Save the screenshot and come back tomorrow to prove me wrong.
I just spotted this BULLA wick while watching the market: 0.0275, down 40.52% in 24 hours. It plunged from a high of 0.0498 to 0.0248—nearly half—with a trading volume of 86.1M. Retail traders couldn’t have generated that kind of volume; this was clearly a cascade of futures liquidations. Some people in the group bought in at 0.045 and are looking pretty green around the gills now, b
BULLA+10.92%
  • 1
I synced a legendary trader’s trades!
Note: synced, not copied!
Uncle Sam’s every move will be followed in milliseconds!
Technology changes destiny!
post-image
BTC Market Cycle Analysis: How to Identify the Different Stages of Bull and Bear Markets?

In the BTC market, many investors are accustomed to judging market conditions based on short-term price movements, while overlooking a more important question: Which stage of the cycle is the market currently in? Understanding market cycles can help traders develop better strategies instead of using the same trading approach at every stage.

First, the accumulation phase. After a downturn, prices gradually stabilize, market interest is low, and trading volume may be relatively subdued. This phase is usua
post-image
BTC-0.67%
Load More

Join 40 M users in our growing community

⚡️ Join 40 M users in the crypto craze discussion

💬 Engage with your favorite top creators

👍 See what interests you

Trending Topics

GateIPOAccessAnthropic

305.3K Views2.8K Discussing

Gate IPO Access Phase 3 features Anthropic (ANT), with USDT subscription interest starting from 100 USDT. Successful allocations will be delivered as real shares to Gate Stock Accounts. Indicative price: $70–$78/share Subscription: Nov 12–17 (UTC+8) Allocation is not guaranteed. Please manage risk accordingly.

Dr.HanOxfordUnionSpeech

147.2K Views586 Discussing

USOctoberPPIBelowExpectations

461.1K Views1.4K Discussing

View More