

















#美股存储板块跌幅扩大 The Nature of the U.S. Tech Pullback Is Shifting: From Valuation Repricing to Credit-Chain Repricing
Many people are still viewing U.S. stocks through the old “AI pullback = buying opportunity” playbook. But if you only watch the Nasdaq and the Philadelphia Semiconductor Index, you may miss the most important change:
July was “AI valuation/positioning repricing”; October is a triple hit from “the AI credit chain + high interest rates + geopolitics/oil prices.” The latter is closer to a “credit-side preview” of the bursting of the 2000 internet bubble, but we’re not yet in a full-blown bear market.
I. July pullback: Expensive, crowded, but no blowup!
Trigger: Google/Meta/Tesla raised CAPEX forecasts, FCF turned negative, and the market asked, “When will AI spending pay off?”
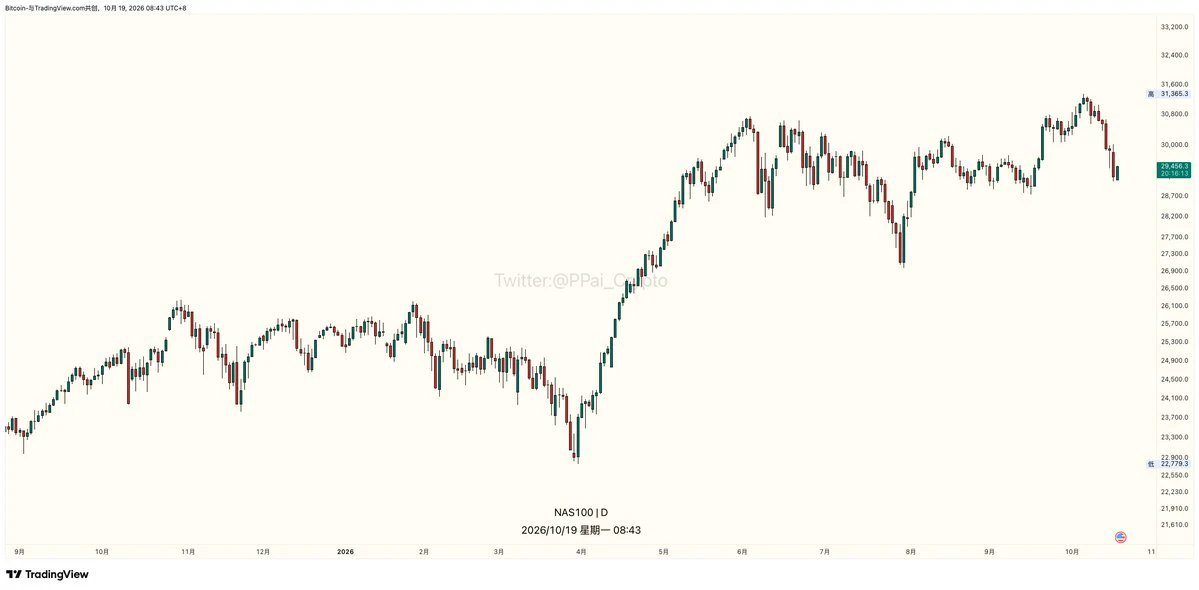
QQQ fell from a June high of ~$748.65 to a July 29 low of $661.14, a peak-to-trough decline of 11.7%; QQQ fell 6.5% for the full month of July, and SOXX fell 21%.
The 10-year Treasury yield was at 4.6–4.75%; the VIX spiked to 20.66 on a weekly basis (+24%), but the broad VIX did not stay above 22. VXN reached 26, but there was no panic spike.
The S&P edged down, while equal-weight stocks rose; money rotated within equities (tech → Dow/healthcare/consumer). Bonds didn’t rally, and yields rose → this wasn’t a flight to safety, but “semiconductors are too crowded, trim them first.”
Outcome: The 200-day moving average at $645 held, and stocks recovered after August. This was a correction that could be bought.
II. October pullback: From “valuation” to “who can’t repay their loans?”
The logic behind this tech pullback since October is more like:
Borrow at a 15% cost to build compute capacity → rental income can’t cover interest → credit cracks appear first → semiconductor order expectations get cut → quite a few sell-side firms are using the 2000 internet bubble as a reference (the Nasdaq crashed, while long-bond yields fell from 6.5% to the mid-4% range).
Market action: It’s not a broad selloff; “highly leveraged growth + AI infrastructure” are being singled out for punishment. From 10/14–10/16, the Dow rose 0.67% for the week, XLV/energy were strong, the SPX fell ~1.95% for the week, and the Nasdaq fell 4.48% for the week (its worst since June); the Philadelphia Semiconductor Index (SOX) fell for 8 straight days (the longest streak since 2008);
Among individual stocks: CRWV fell 25% for the week, CDS breached 1000bp, and its 5-year default probability was priced at 60%+.
The 10-year Treasury yield fell from 5.3% to 5.07–5.19%, but this was a safe-haven decline as stocks fell and money fled into Treasuries, not a central-bank rescue; the VIX broke above 22, Brent crude topped 110, and tensions in the Middle East and Russia-Ukraine escalated.
Investor sentiment: the CNN Fear & Greed Index fell to 18, but it’s not yet at the extreme “2–4” levels seen in 2018/2020—meaning the market is shifting from “uncomfortably expensive” to “a little worried about credit,” but this is not a COVID-style liquidity collapse.
III. How have similar “credit-side + tech selloff” pullbacks played out historically?
The 2000 internet bubble burst: The Nasdaq was cut in half, then cut in half again from its peak, while the S&P lagged; valuations were hit first, then earnings, then credit, and bonds ultimately entered a bull market. The difference today: major tech issuers aren’t pure concepts; their cash flows/cloud revenues are real. So this isn’t a repeat of 2000, but “the 2000 credit playbook + the 2022 interest-rate playbook.”
The 2022 rate-driven growth selloff: The 10-year Treasury yield surged from 1.5% to 4.3%, QQQ fell 35% from its peak, and SPY fell 25%; the core issue was the “discount rate,” not credit defaults. The 10-year Treasury yield is now above 5%; megacaps are hurting, but banks/consumer/healthcare haven’t collapsed.
2018 Q4 deleveraging: The VIX spiked to 35, QQQ fell about 20% for the quarter, and stocks made a V-shaped recovery after the Fed turned dovish; the Fed isn’t as hawkish now, but inflation + oil prices mean it can’t turn dovish freely.
March 2020 liquidity black hole: The VIX hit 80, and stocks, bonds, and gold all fell together, with the Fed providing a backstop; there’s no COVID-style liquidity freeze now, and CRWV is an individual credit event, not a market-wide counterparty crisis.
Historical rules of thumb
“VIX above 20 + 10-year Treasury yield rising + tech leading declines” → usually the middle of a pullback, not the bottom.
“VIX plateauing at high levels + 10-year Treasury yield starting to fall + semiconductors no longer making new lows” → only then is it a signal to add to QQQ.
Until credit events (CDS widening, high-yield bond spreads widening) stabilize, every QQQ rebound is prone to being sold.
Historical timing reference: the July pullback took 3–5 weeks to recover; with an October-style “credit + rates + geopolitics” combination, a bottom usually isn’t in until the VIX returns to 16–18, CRWV bonds stop falling, and SOXX posts a high-volume candle without making a new low. This often takes 3–8 weeks; if credit spreads widen to Oracle/major tech bonds, it can drag on for a quarter.
IV. The counterintuitive point during earnings season: stock prices are falling, but earnings haven’t collapsed. In the first week of the new 26Q3 earnings season, about 9% of large S&P 500 companies had reported earnings. Stock prices are falling, but earnings haven’t collapsed—the declines reflect “discount rates + credit expectations,” not “current results.”
Companies that have reported: earnings up 29% year over year, revenue up 12.6%;
26Q1 earnings up 28.6%, 26Q2 up 50.4% → the strongest earnings cycle since 2021Q2;
Market pricing for full-year 2026: earnings up 32.8%, revenue up 12.7%;
Q3/Q4 earnings expectations: +29% / +28.6%;
The S&P’s forward P/E is 19.0: below the 10-year average of 19.1 and the 5-year average of 19.8.
This isn’t an “earnings collapse”; the market is getting ahead of three fears:
① AI CAPEX returns in 2027 will fall short of expectations;
② 10-year Treasury yields at 5%+ will discount long-duration assets;
③ AI credit-chain players like CoreWeave will blow up first.
So this is neither 2000 (earnings fraud/disappearance) nor 2022 (earnings downgrades + interest-rate battering). It’s “earnings are very strong, but valuation logic is being repriced for credit risk.”
V. Why is the week of October 19–23 a turning point?
This isn’t an ordinary earnings week. It’s a week to “use real-economy cash flows to rescue tech valuations.”
1) Wednesday’s two pillars: META + TSLA
What to watch for in META:
Will CAPEX be revised higher again, how are advertising/AI monetization progressing, and what is happening with free cash flow?
If it says “we’re continuing to invest more in AI, but ROI is clear” → it eases July-style spending concerns;
If it says “returns are slower than expected” → QQQ could sell off again.
What to watch for in TSLA:
It’s not just a car company; it’s a high-beta proxy for “AI / robotics / energy storage.”
Deliveries, gross margin, FSD, and what it says about Optimus matter more than sales volume.
A weak TSLA → high-beta tech sentiment could collapse again.
2) Industrial / defense / payments: proof that “the non-AI parts of the economy are holding up”
GE, RTX, NOC, LMT, MMM, UNP, CAT names (URI), AXP, COF:
Industrial orders = the temperature of the real economy;
Credit cards (AXP/COF) = consumer resilience and delinquencies;
Defense (RTX/NOC/LMT) = a geopolitical premium, but with budget constraints.
If they hold up, investors will be more willing to stay in SPY / XLI / XLV rather than go back to catch the falling knife in QQQ.
3) Macro anchors
Tuesday: housing starts / existing-home sales → has housing frozen under 5%+ rates?
Thursday: initial jobless claims + leading indicators → are there cracks in employment?
Friday: manufacturing / services PMI → soft landing or a second downturn in manufacturing?
These data will determine whether the 10-year Treasury yield holds 5.0% or surges to 5.3%–5.5%, and will directly determine the discount rates for SPY / QQQ.#WCTCS9
