Square
Following
Hot
News
Notifications
Profile
Share your thoughts
placeholder
Article
📊 Crypto Daily | Evening of Nov 13: $70,000 support lost! Iran strikes US military facilities, 180,000 liquidated, $1.631 billion wiped out—the Fear and Greed Index falls to 20

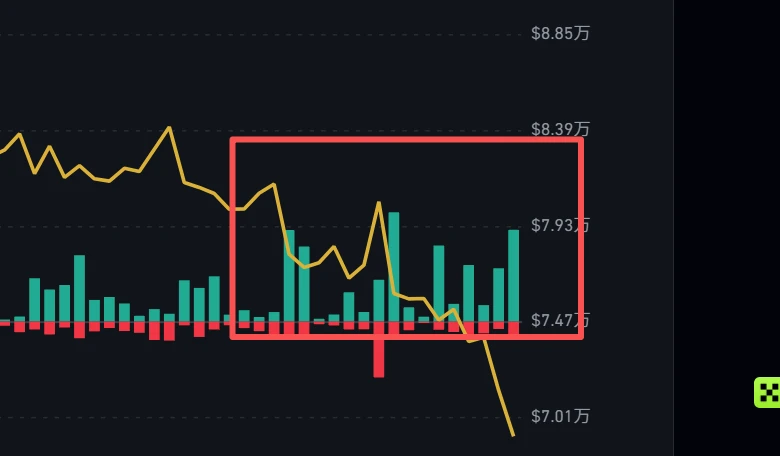
Guys, it was hovering around 71,000 this morning, then plunged below $70,000 tonight: $BTC fell as much as 5.4% intraday, bottoming near 67,585, and has now recovered to around 69,400, down nearly 3% on the day. This wasn't a technical pullback—the news directly sent prices tumbling: Iran struck US military facilities in the Middle East, stoking safe-haven sentiment and sending risk assets across the board lower; on t
post-image
BTC-0.67%
NVDA-4.49%
IBIT+0.00%
#Gate直通IPO第三期Anthropic

Unbeatable subscription signals🧭
All 4 trades have hit take-profit!

Waiting for opportunities to keep trading. CPI is also coming tonight; my personal view is a spike followed by a pullback.

$ETH ‌
ETH-1.23%
  • 3
  • 3
Trenches
mihao
m
bade
b
mihao
4Cxj...pump
Market Cap
$.
Change
.
24h Vol
$.
Holders
.
AGT
A
bade
b
AGT
0x5d...e274
Market Cap
$.
Change
.
24h Vol
$.
Holders
.
FOOD
F
bade
b
FOOD
FTu5...pump
Market Cap
$.
Change
.
24h Vol
$.
Holders
.
IDOL
I
bade
b
IDOL
0x3b...ab07
Market Cap
$.
Change
.
24h Vol
$.
Holders
.
AI
A
bade
b
AI
2T56...pump
Market Cap
$.
Change
.
24h Vol
$.
Holders
.
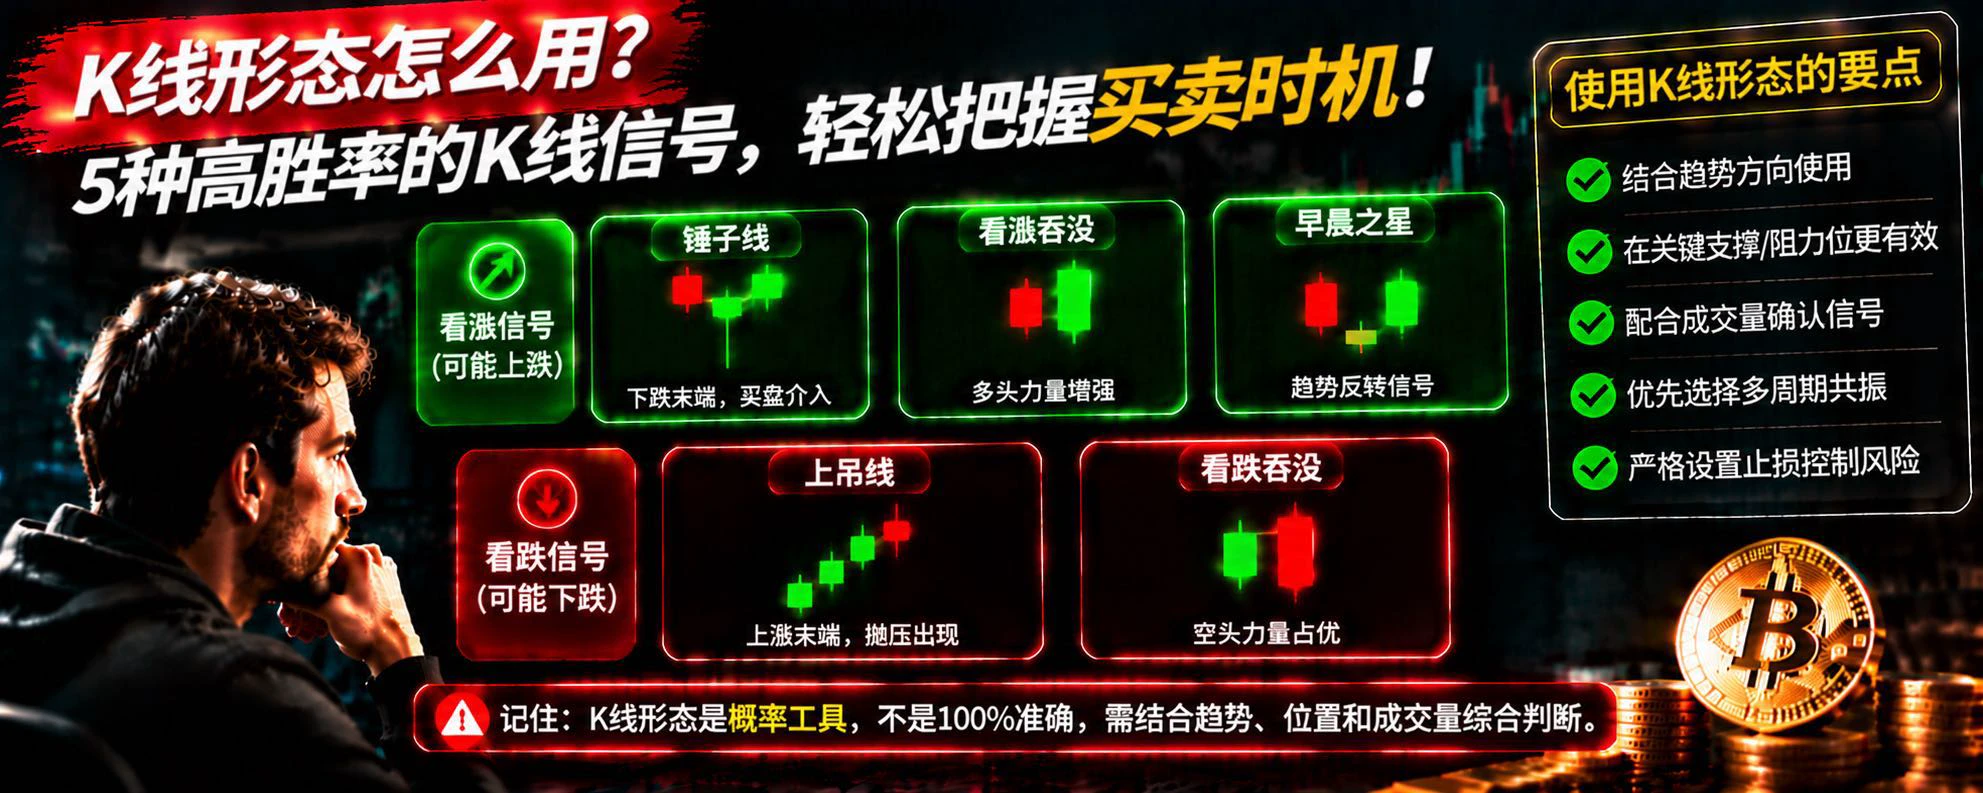
How to Use Candlestick Patterns? 5 Common Signals to Help Determine When to Buy or Sell BTC

In cryptocurrency trading, many people look at candlestick charts every day, but few truly understand the market sentiment behind them.

Why does BTC rise rapidly after some candlestick patterns appear? Why does the price continue to fall after other patterns appear?

Today, we’ll introduce 5 common candlestick patterns.

First, the hammer. It usually appears in a downtrend, with a long lower wick and a relatively small body, indicating that some buying support emerged after the price fell and potentia
post-image
BTC-0.67%
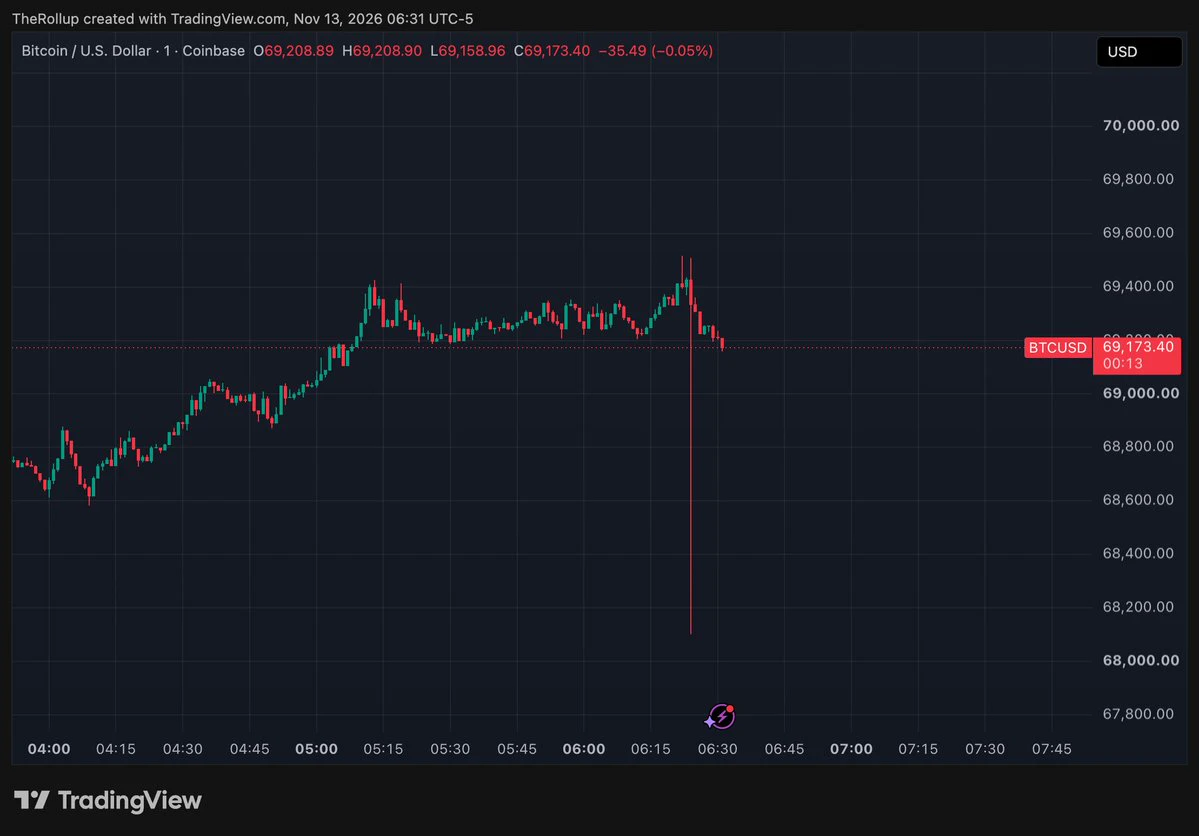
Someone fat fingered and nuked their BTC stack on Coinbase, yikes
$BTC
post-image
BTC-0.67%
The slow bleed accelerated toward the end, and longs lost far more than they would have from a single huge wick. Many longs were probably hurt.
post-image
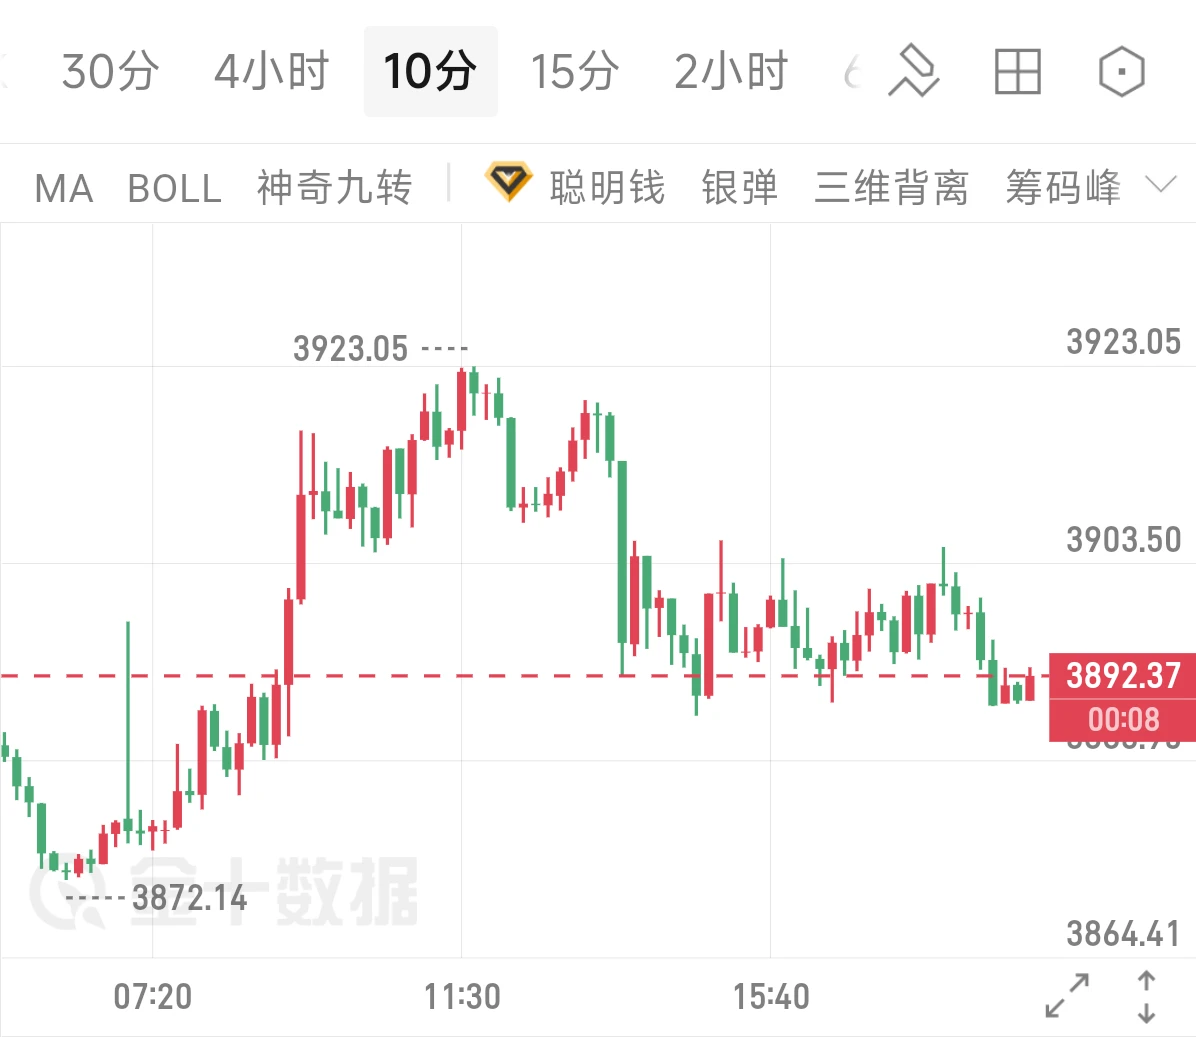
11.13 Gold Evening Update: Rally Meets Resistance and Weakens in Choppy Trading! Bearish Gold Bias Remains Unchanged

Gold dipped to support at 3872 during the morning session before rebounding for a recovery. It climbed to around 3923 intraday, where it met resistance and pulled back. Bulls failed to extend the gains, and prices continued to drift lower in choppy trading in the afternoon. Gold is currently trading near 3892, with rebound momentum continuing to fade. Overall, it is consolidating weakly after a rally and pullback.

Technical outlook: On the 10-minute chart, gold rallied and the
post-image
GLDX-0.40%
PAXG+0.37%
Shorts are crushing it across the board, firmly in control of this downtrend!
Went short on BTC near the 74,800 high ahead of time, anticipating a break below the 70,000 mark. The market plunged all the way to a low of 67,500, capturing the full 7,000-point move;
Opened short positions on ETH around 2,100, targeting 1,900. Price hit 1,893 with precision, locking in a solid 200-point swing;
Opened a short position on ZEC near the 1,030 resistance level, targeting a break below 900 support. It dipped to a low of 880, securing 144 points in profit;
Called a short on SOL near the 86 resistance lev
BTC-0.65%
ETH-1.23%
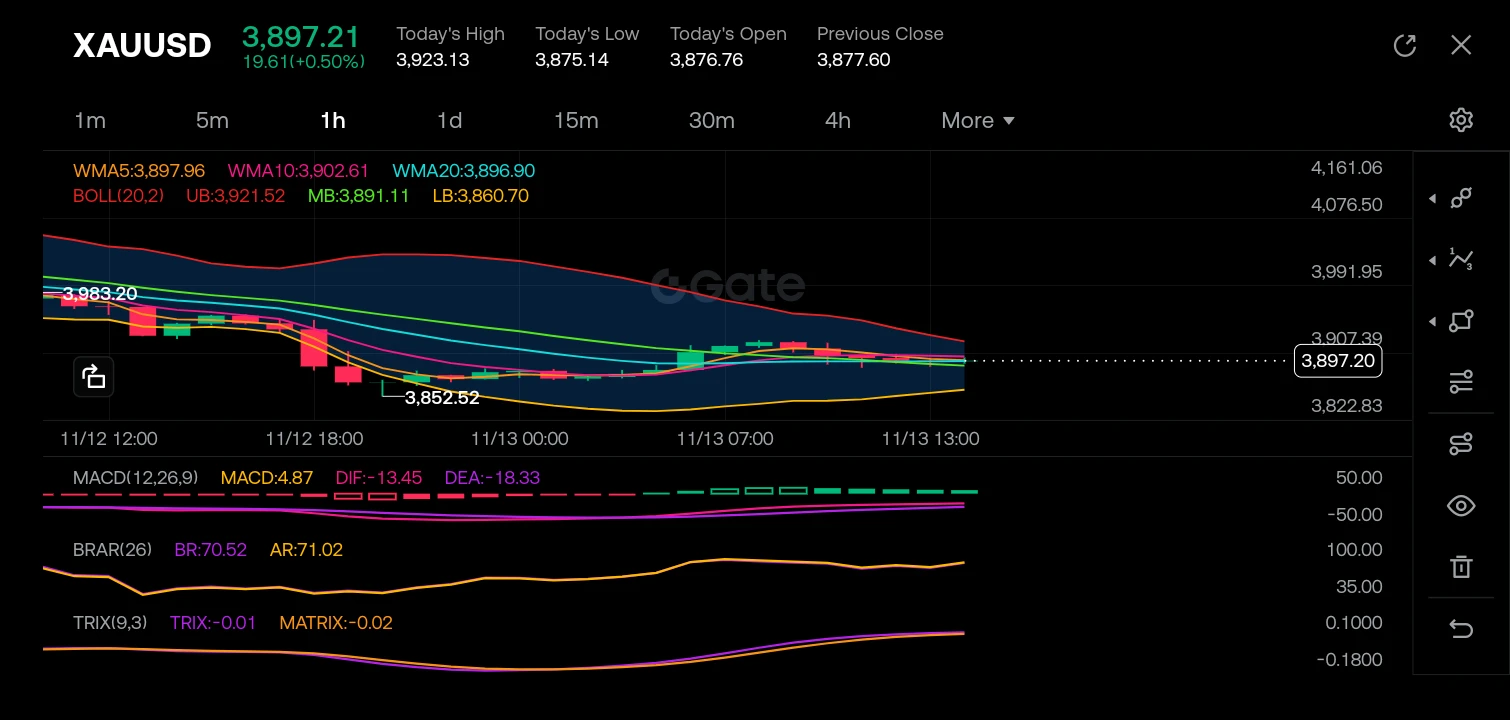
$XAUUSD ‌
Looking at the 1H chart, the market structure is currently in a corrective consolidation phase following a prior downtrend. Price recently swept liquidity to the downside, bottoming out at a swing low of 3,852.52, before forming a base and attempting a recovery. The K-line analysis shows a shift from heavy bearish momentum into a choppy, range-bound environment, with price now hovering around 3,897.21, attempting to establish support above the WMA5 (3,897.96) and WMA10 (3,902.61).

The recent price action prints a series of small-bodied candles with wicks on both sides, suggesting i
post-image
XAUUSD+0.00%
  • 4
  • 1
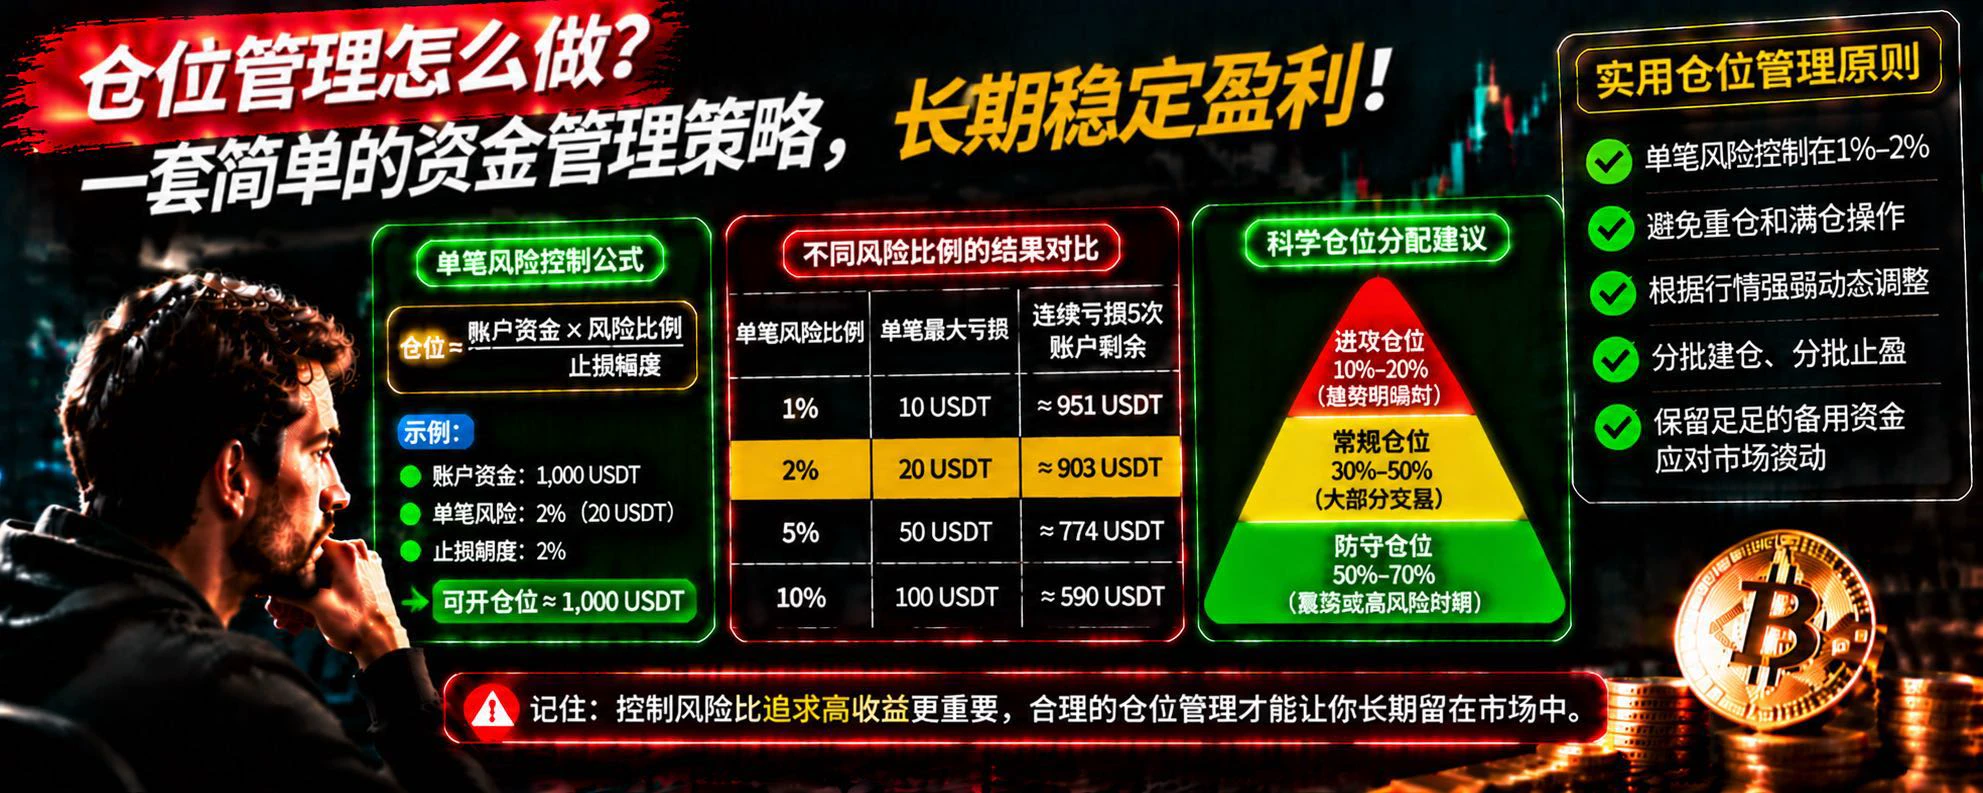
Why Is It Harder to Break Even After a Larger Loss? Understanding the True Cost of Account Drawdowns

In cryptocurrency trading, many people focus on how much a trade can earn, but rarely take the time to calculate how much the account needs to gain after a loss to return to its previous level.

This is actually one of the most easily overlooked risks in trading.

Suppose your account originally had 1,000 USDT. After a 10% loss, you have 900 USDT left. To return to 1,000 USDT, it needs to rise by 11.1%, not 10%.

If the loss reaches 20%, you have only 800 USDT left, which needs to rise by 25%
post-image
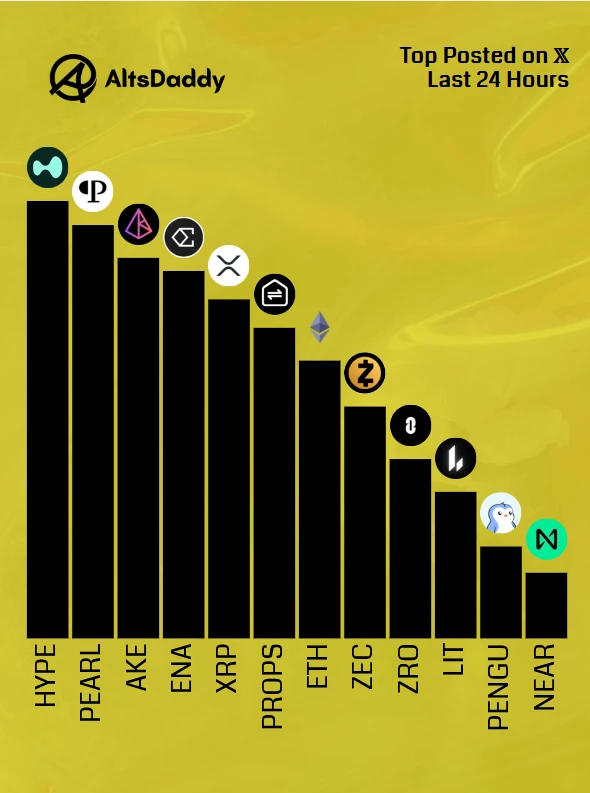
🎗️ Friday’s Top Posted #Altcoins 🎗️
1️⃣ $HYPE
2️⃣ $PEARL
3️⃣ $AKE
4️⃣ $ENA
5️⃣ $XRP
6️⃣ $PROPS
7️⃣ $ETH
8️⃣ $ZEC
9️⃣ $ZRO
🔟 $LIT
1️⃣1️⃣ $PENGU
1️⃣2️⃣ $NEAR
Runner ups: $XRP, $VVV, $SUI, $SOL, $NEAR
#Altseason2026 #Altcoins $DDY
post-image
HYPE+0.24%
PEARL-2.04%
AKE+6.07%
ENA+8.04%
XRP-1.15%
I locked spot #2010 in the MemePit Genesis WL. @memepitHQ
post-image
WL-11.27%
In cryptocurrency futures trading, many people spend every day analyzing whether BTC will rise or fall, yet overlook a very important question: Do you really understand the different order types on trading platforms?

Sometimes, even if you correctly predict the market, an unreasonable order placement method can result in a poor entry price or even unnecessary losses.

First, Limit Order. You can set a buy or sell price in advance and wait for the market to reach that price before the order is filled. It is suitable for looking for buying opportunities near support or planning to sell near res
post-image
BTC-0.65%
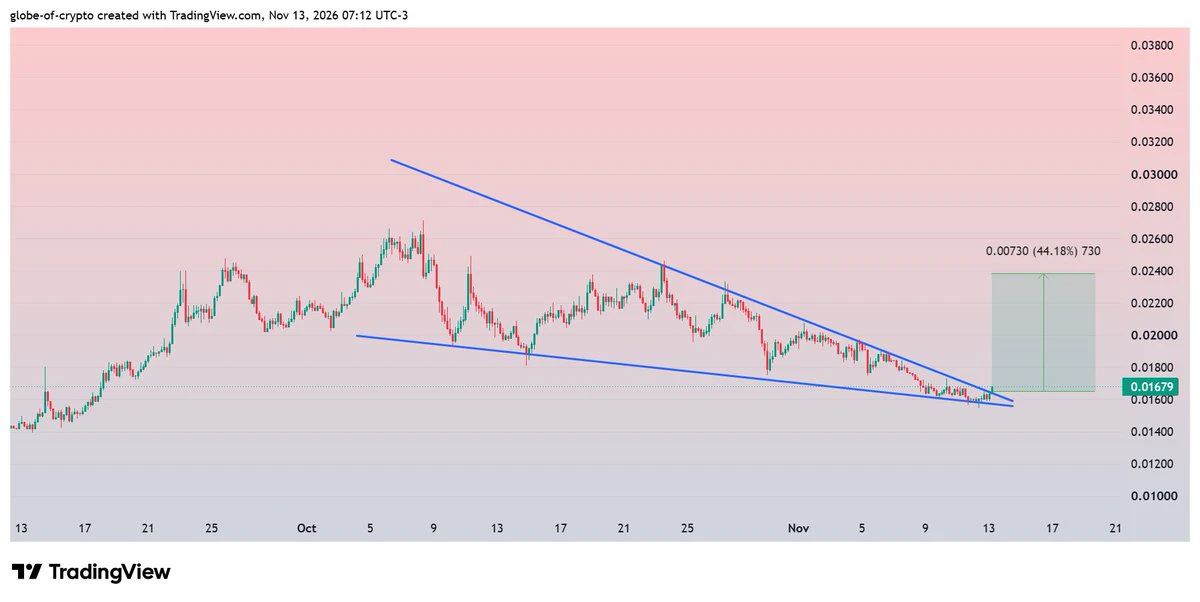
$SENT #SENT
Breaking Falling Wedge on 4H chart.
Successful breakout could trigger cold trigger 45-50% rise ✍️
post-image
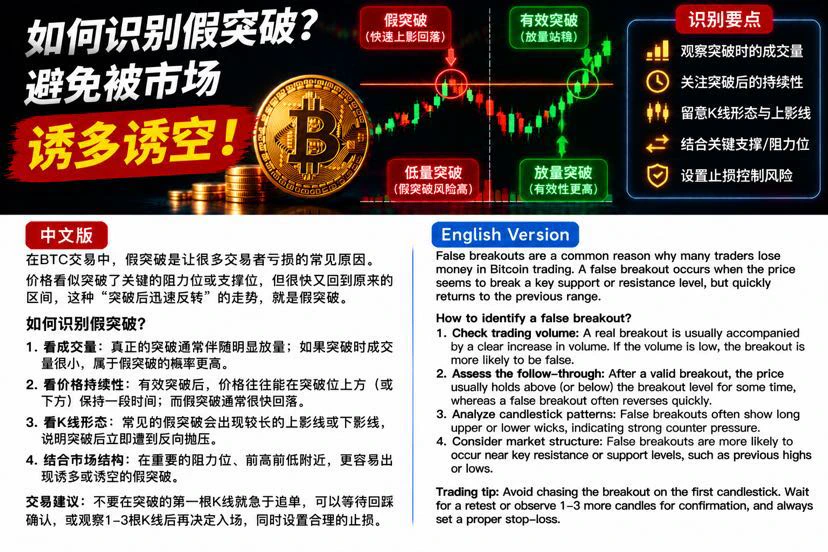
In BTC trading, many traders have had this experience: the price suddenly breaks through a key resistance level, and they think the uptrend has finally begun, so they immediately enter by chasing the rally. But before long, the price quickly falls back into its previous range, or even triggers their stop-loss. This phenomenon is commonly known as a false breakout.

So, how can you identify a false breakout?

First, watch trading volume. A genuine breakout usually needs to be accompanied by sufficient trading volume. If the price breaks through a key level but trading volume does not increase s
post-image
BTC-0.67%
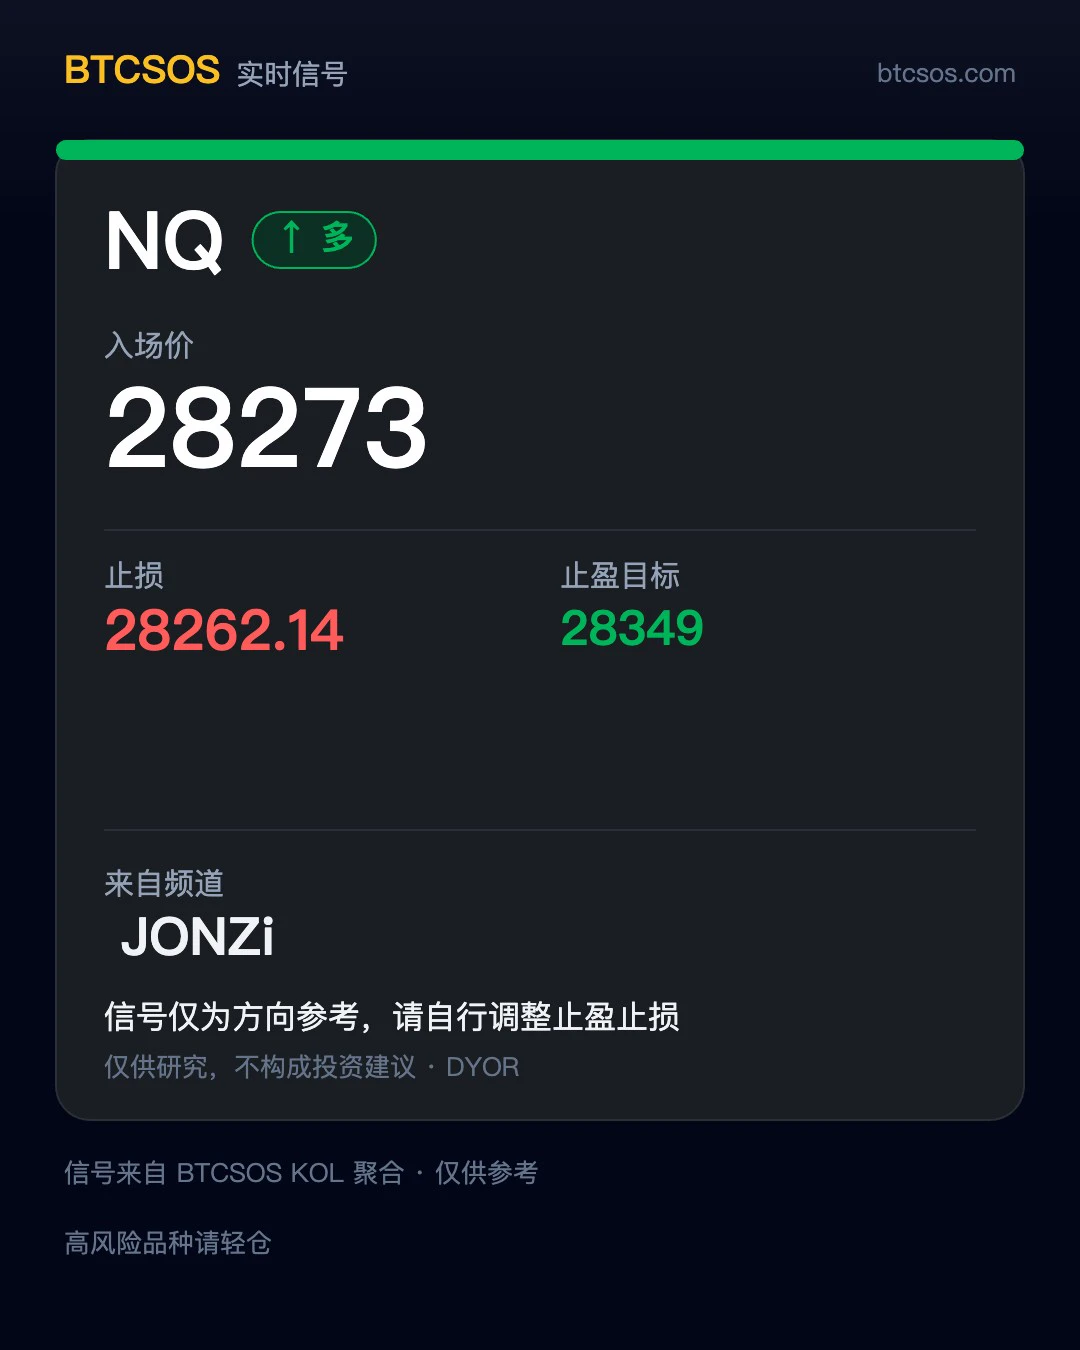
📢 Signal Card · Repost Channel JONZi
$NQ Long entry: 28273 Target: 28349 Stop loss: 28262.14 Time: just captured, no other details noted
Speaking of which, just 5 days ago (11-08), sis reposted a $BTC trade from JONZi, and here it is again—hardworking confirmed 😂
As always, sis is only responsible for reposting it as is. Signal quality has nothing to do with sis. Whether to follow and how much to invest is up to you.
Shared for personal record, not investment advice. #Trading Voices: Your experience deserves to be heard.
post-image
BTC-0.67%
Why Do Stop-Losses Keep Getting Hit, Only for the Market to Move as Expected Afterward?

In cryptocurrency trading, many people have experienced this:

You buy BTC, and a slight price dip triggers your stop-loss. Just after you sell, the market starts rising again. The same thing happens when shorting: the price first moves up and hits your stop-loss, then suddenly drops.

Why do your stop-losses keep getting hit?

First, your stop-loss may be set too close to the current price. Cryptocurrency markets are volatile, and normal price pullbacks over short periods are common. If the stop-loss dist
post-image
BTC-0.67%
$SOPH The bullish signal has been triggered. Enter a long position decisively at the current price of $0.001705. The token distribution at this price level looks favorable, and short-term momentum is building. The +27.82% gain is just the beginning. Go long $SOPH 👇
Risk warning: The above is solely a personal opinion and does not constitute investment advice. Contract trading involves extremely high risk. Please manage your position size carefully.
post-image
SOPH-3.83%
bitcoin:native JUST FOLLOWING THE LONGTERM UPTREND LINE...
BTC-0.67%
$LINK Listen to me... Now entering a large short position: 10.8-12.2 Stop loss: 13.6 Take profit: 10.1 Take profit: 9.3 Take profit: 8.6 Progress is lagging: Moody's cross-chain pilot remains limited to a testnet using simulated data, delaying actual revenue for on-chain protocols. Trade here $LINK 👇
post-image
LINK-0.18%
Load More

Join 40 M users in our growing community

⚡️ Join 40 M users in the crypto craze discussion

💬 Engage with your favorite top creators

👍 See what interests you

Trending Topics

JensenHuangResigns

518.2K Views8.2K Discussing

Jensen Huang has resigned as NVIDIA CEO and stepped down from the board. CFO Colette Kress will serve as interim CEO while NVIDIA considers internal and external successors. $NVDA fell more than 10% in premarket trading following the announcement. With one of AI’s most influential leaders stepping aside, markets are now reassessing NVIDIA’s leadership stability, AI strategy, and long-term valuation.

GateIPOAccessAnthropic

281.9K Views2.6K Discussing

Dr.HanOxfordUnionSpeech

144.8K Views474 Discussing

View More