Square
Following
Hot
News
Notifications
Profile
Share your thoughts
placeholder
Article
What Is Trading Expectancy? How Can You Tell Whether a Strategy Has an Edge Over the Long Term?

In crypto trading, some people review their win rates and look for better entry points every day, yet overlook a more fundamental question: If you repeatedly trade according to the same set of rules, how much will you earn or lose on average per trade over the long term?

That is the question trading expectancy aims to answer.

First, what is trading expectancy?

Trading expectancy is the theoretical average return per trade under a given strategy and set of statistical conditions. It analyzes the
When a trading strategy starts to fail, should you adjust its parameters or stop trading?

The real danger isn’t that a strategy loses money, but that you don’t know why it’s losing and keep changing its parameters in an attempt to repair the returns curve.

A strategy may once have worked, but the market won’t always behave the same way.

A trend may turn into a range, liquidity may decline, trading costs may rise, and entry signals that once worked may gradually lose their edge.

So how should you tell?

Step one: Determine whether it’s a normal drawdown or a change in the strategy’s assumpt
post-image
Trenches
ZIG
Z
bade
b
ZIG
0x8c...1145
Market Cap
$.
Change
.
24h Vol
$.
Holders
.
BTC
B
bade
b
BTC
C5xp...pump
Market Cap
$.
Change
.
24h Vol
$.
Holders
.
Diamond
D
bade
b
Diamond
5VCE...pump
Market Cap
$.
Change
.
24h Vol
$.
Holders
.
GM
G
bade
b
GM
0x13...7777
Market Cap
$.
Change
.
24h Vol
$.
Holders
.
DOGE
D
bade
b
DOGE
DoGE...fm7R
Market Cap
$.
Change
.
24h Vol
$.
Holders
.
11.7 BTC Market Analysis

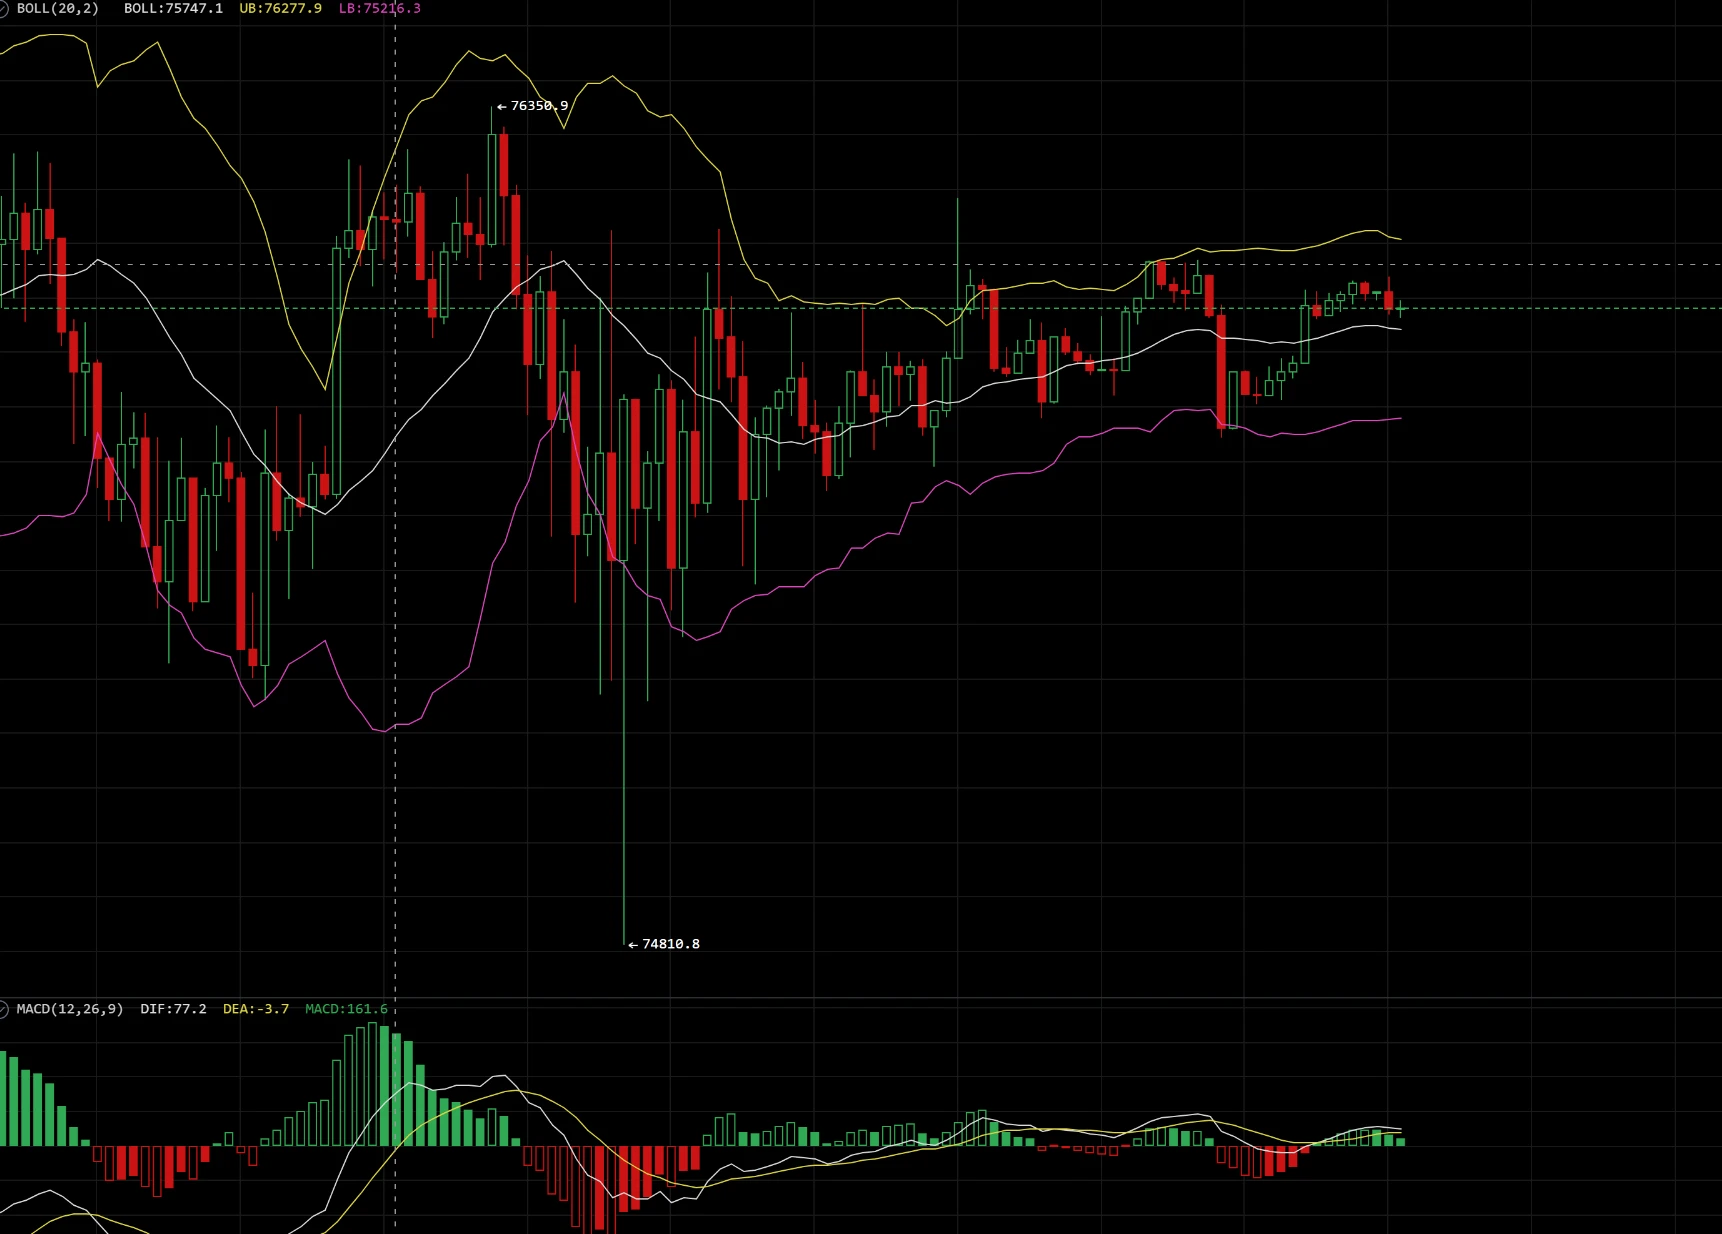
  BTC is currently in a weak consolidation and recovery phase following its decline. The Bollinger Bands have generally narrowed and flattened, with the fast and slow lines converging. Previous bearish momentum has clearly faded, but no clear short-term rebound or reversal trend has formed either, so the market is primarily moving sideways within a range. Key support levels are first the Bollinger middle band at 75830, then the lower band near 75297, with strong support at the previous low of 74810. A sequential break below these support levels could restart the downt
post-image
BTC-0.65%
How far can steady progress take us this time
With funding rates this deeply negative, most of the people longing $SOL are basically stuck holding their positions. The fact that futures longs are so deep underwater points to one thing: the meme coins that actually break out aren’t about who shouts the loudest, but who has something real.
post-image
SOL-0.74%
MEME-0.94%
Why might your account's overall risk be far higher than expected even when you've only made a few trades?

Many traders review their positions one by one but overlook a more important question: Do these trades share a common source of risk?

Suppose you hold long positions in BTC, ETH, and SOL at the same time. On the surface, you hold three different assets. But if all three are affected by a broad market downturn, shrinking liquidity, or declining risk appetite, these trades could all lose money together.

These are three frequently overlooked issues in portfolio risk.

I. Correlation risk:
post-image
BTC-0.67%
ETH-1.26%
SOL-0.77%
Great $ESPORTS , another wave of gains is underway. I followed the long trend and made some profit too. There are signs of a slight dip, so going short seems better 😍😍😍$TA $ONE 😍😍😍
post-image
ESPORTS-5.30%
TA+10.20%
ONE-1.19%
GM if you GM back!
post-image
The long-term downtrend structure remains intact, while the short-term rebound lacks volume: Is this support or just a pause before further declines?
Recently, several crypto friends have asked a very interesting question: Before Trump took office, Bitcoin surged from around $75,000 to $120,000. Now that Trump is about to finish selling off his Bitcoin, could it fall back below $70,000?

First, a correction: This is not a question of “prediction,” because Bitcoin is currently fluctuating above $75,000.

CME Bitcoin futures closed at 75,785 last night, with an intraday low of 74,810. About 140
BTC-0.65%
ETH-1.23%
The Annual Traffic King Is About to Be Crowned! Gate Streamer and Creator Awards: Who’s the Real Pro?

The crypto world has no shortage of experts—it needs more people with both talent and an audience! Some study the market every day and deliver sharp analysis; some keep their livestreams lively with witty commentary, turning every market move into a joke; others attract countless fans with quality content and become community favorites.
The Gate Social Annual Streamer and Creator Awards are here!
This time, the spotlight isn’t just for trading pros—it’s also for those who create diligently, s
MU+4.71%
  • 22
#美股AI板块遭遇重挫

BTC daily chart probes the bottom with a slight rebound; low-level consolidation awaits a breakout

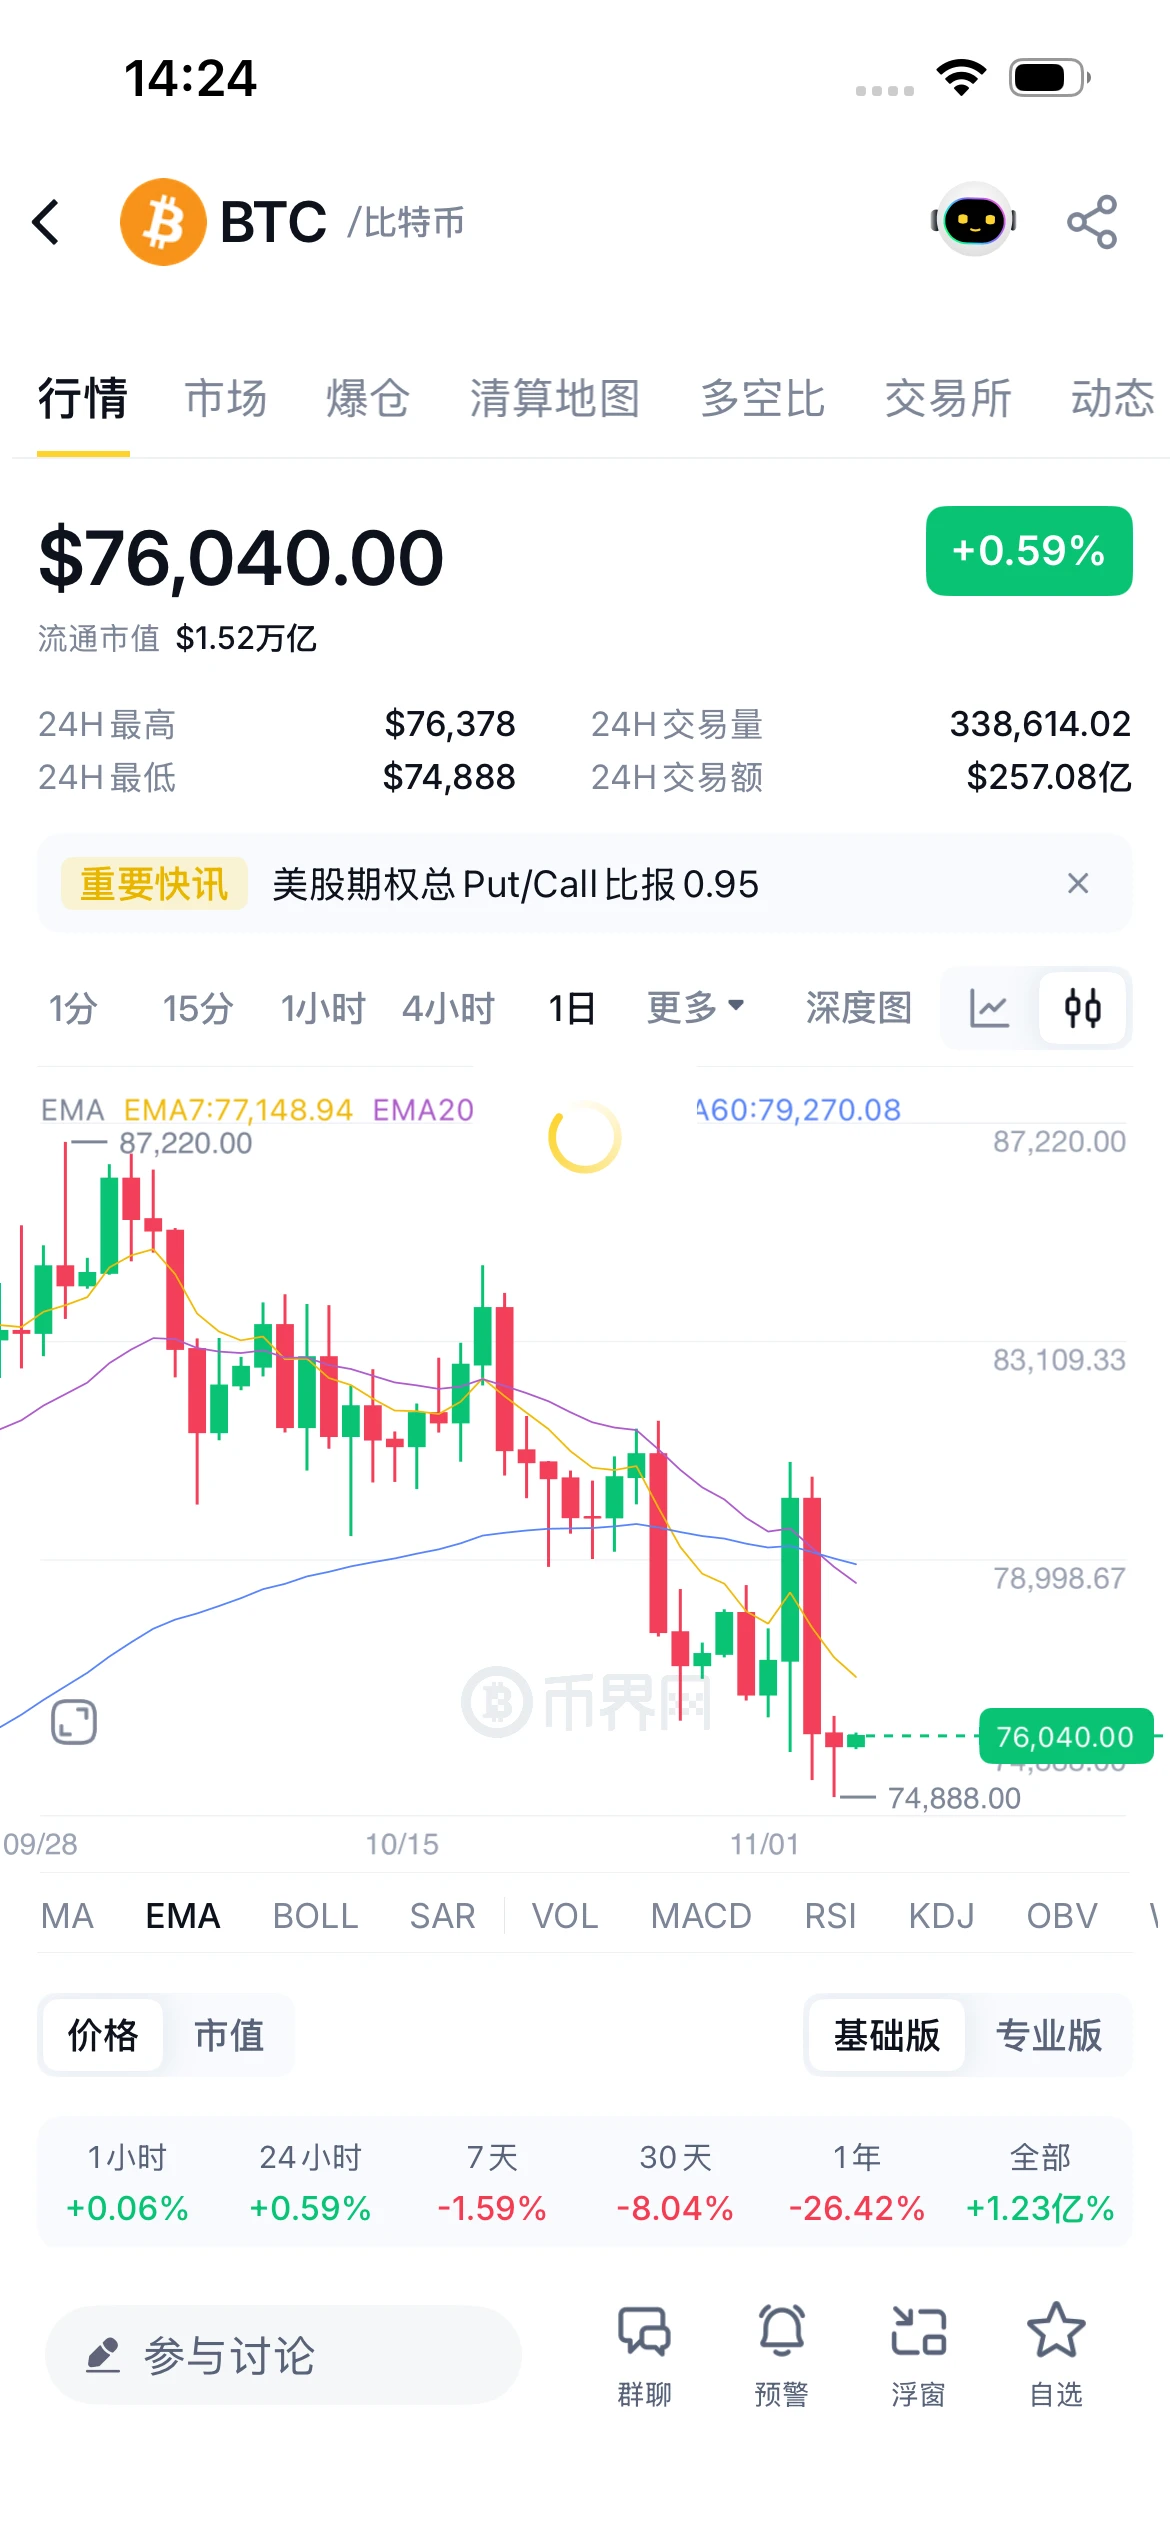
Currently at 76,040 (+0.59%), stabilizing and slightly rebounding from the low of 74,888. On the 1-day chart, EMA7 (77,148) has crossed below EMA60 (79,270), creating bearish pressure. But after consecutive declines, selling pressure has eased, and bids are emerging at the lows. Reclaiming EMA7 is the first confirmation; intraday, the bias is toward range-bound recovery.

Outlook: If it holds steady → rally directly to 77,148 without breaking 74,888; if it breaks down → first wick
post-image
BTC-0.65%
Anyone else see STRATO sitting behind Tether and Paxos on DefiLlama?
In that snapshot, @strato_net was #3 among Gold & Commodities platforms by DeFi Active TVL.
Here’s the bit that made me pause.
$27.66M in tracked gold and silver.
$13.2M of it being used in DeFi.
That’s close to half.
Say you came to STRATO because you wanted some silver. You could hold SILVST for a while, then trade it for USDST and move those dollars into savings, all on the same chain.
I can see why someone would come for the silver and end up using the rest of the app.
That’s what I’m curious about going into the $STRAT
USDT+0.00%
USDP-7.41%
Zec market update
live-cover
LIVE1,973
#美股史诗级抛售 #Gate股票畅聊季 #每周来晒 The “Deleveraging” Moment in U.S. AI Stocks: A 1998 Replay Without Fed Rate Cuts to the Rescue!

This article analyzes the plunge in U.S. AI stocks and the wave of programmatic selling: at the market-structure level, leveraged ETFs and dealers’ negative Gamma triggered a mechanical selloff; at the valuation level, uncertainty over capex and returns created a rift; and at the macro level, the Fed was absent as a backstop through rate cuts. It examines whether the AI trade is replaying the 1998 LTCM crisis or heading toward a 2000-style bubble.

As buyers of AI computin
BUBBLE-2.35%
NDAQ+0.28%
SPX500+0.19%
NVDA+2.80%
CSCO-2.05%
  • 3
$SNDK $MU $SKHYNIX

Is AI’s rampant expansion about to be put on the brakes?

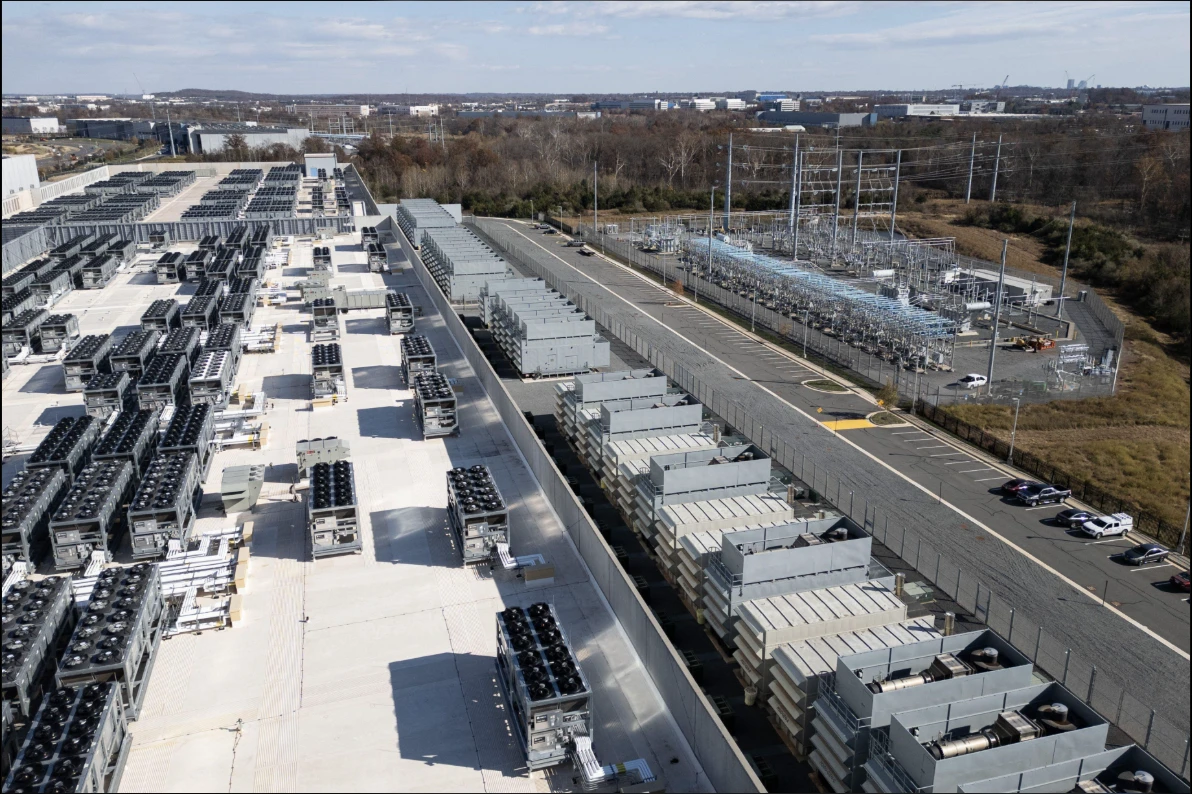
The U.S. is starting to tighten data center regulations

This time, the computing, AI, and chip giants are all going to feel the pain

Holy shit

Guys

The AI industry is about to get fucking ugly

Before, whenever people talked about AI

all they focused on was whether NVIDIA had enough chips, whether there was enough computing power, and how powerful the models were

But now

U.S. regulators and local governments are starting to focus on a more practical issue

You AI giants

You can build data centers

but who th
post-image
SNDK-0.18%
MU-0.63%
SKHYNIX+1.41%
November recruitment call—laying it all out clearly.
Different account sizes, different trading rhythms: ≤20,000 U for short-term swing trades and quick in-and-outs; 20,000–50,000 U for a flexible mix of swing trades and medium- to long-term positions; ≥50,000 U for medium- to long-term trend positioning. Don’t blindly chase trades—choose a timeframe that fits your account size.
Last week: 13 trades, 12 wins, netting 9270 points. The trading rhythm is all documented. If you want to follow along, join us for the November swing-trading cadence. $BTC ‌$ETH ‌#10月非农数据聚焦
post-image
BTC-0.65%
ETH-1.23%
[NEW STREAMER]hot prediction market update💕
live-cover
LIVE1,508
#美股AI板块遭遇重挫 #每周来晒 This latest sell-off in U.S. AI stocks was a deleveraging-driven rout, but the AI trade has entered a deeper correction. From here, tech giants with stable cash flows look more attractive, while chip stocks need to be repriced based on valuations and expected returns.

Why it’s about more than deleveraging
The trigger was political: Democrats won both chambers, raising market concerns about tighter data center permitting and power-use regulations.
AI investment returns are being reassessed: Five cloud providers spent $556.9 billion on capital expenditures in the first nine m
NVDA+2.80%
MSFT-0.95%
GLDX-0.40%
PAXG+0.37%
  • 1
  • 2
$MITO is performing impressively, up as much as 18.82%! A strong breakout has pushed the price close to $0.0080. If buyers break through $0.00809, a new rally may be ahead! Entry: $0.00770 – $0.00785Target: $0.00810 / $0.00835 / $0.00860Stop-loss: $0.00735
post-image
MITO+8.51%
Load More

Join 40 M users in our growing community

⚡️ Join 40 M users in the crypto craze discussion

💬 Engage with your favorite top creators

👍 See what interests you

Trending Topics

USAIStocksHitHard

15.97k Views3.65k Discussing

U.S. stocks sold off sharply on Thursday, November 5 (UTC). The Nasdaq closed down around 5.5%, entering correction territory, while the Philadelphia Semiconductor Index plunged roughly 12%, with chip stocks including $NVDA and $AMD posting steep losses. Beyond profit-taking, investors are growing concerned about the pace of AI data center construction, capital spending, and future returns on investment. The key question now is whether the AI sector’s lofty growth expectations need to be repriced. Where do you think the next opportunities will emerge: chip stocks, tech giants, or other sectors?

USNonfarmPayrolls

23.64k Views4.26k Discussing

StakeOnLaunchpoolToShare450KVLX

2.62k Views775 Discussing

View More