





Square
Following
Hot
News
Notifications
Profile
Share your thoughts
placeholder
Article
Market update
live-cover
LIVE1,884
  • 1
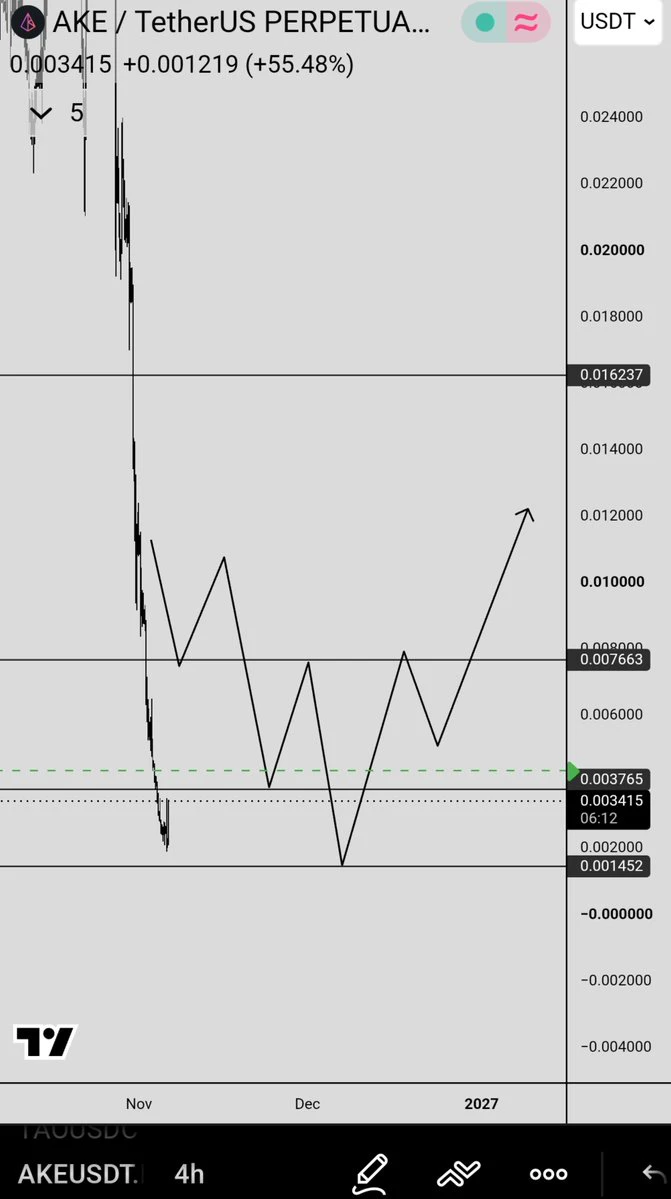
#Ake $Ake was updated earlier
post-image
AKE+6.07%
  • 1
Trenches
fxUSD
f
bade
b
fxUSD
0x08...d8f6
Market Cap
$.
Change
.
24h Vol
$.
Holders
.
ZIG
Z
bade
b
ZIG
0x8c...1145
Market Cap
$.
Change
.
24h Vol
$.
Holders
.
BTC
B
bade
b
BTC
C5xp...pump
Market Cap
$.
Change
.
24h Vol
$.
Holders
.
CORLA
C
bade
b
CORLA
0xba...7777
Market Cap
$.
Change
.
24h Vol
$.
Holders
.
STONK
S
bade
b
STONK
6GmA...UNgx
Market Cap
$.
Change
.
24h Vol
$.
Holders
.
Compute Is No Longer a Moat: When Politics Hits the Brakes on AI
Democrats’ AI regulations are moving from slogans to legislation, tightening rules on energy use, compute procurement, and model audits.
Microsoft’s decision to give up its expansion rights shifts capex uncertainty to policymakers—it would rather build less than make the wrong bet.
IPO valuation logic is being rewritten: from “discounting future compute” back to “pricing current cash flow.”
When the bubble deflates, companies with customers and gross margins will be rediscovered.
Army Outlook:
The key to winning the next round of
post-image
MSFT-3.65%
  • 2
  • 1
#SK海力士跌近7% #ShareWeekly

SK Hynix Drops Nearly 7%: Is This a Temporary Market Correction or a Warning Sign for the AI Boom?

The recent decline in semiconductor stocks has created fresh uncertainty across global financial markets. On November 5, 2026, SK Hynix shares dropped approximately 6.7%, while Samsung Electronics also recorded a decline of nearly 6%. At first glance, this movement may look like a serious setback for the AI and memory chip industries. However, looking beyond the daily price action reveals a more complicated picture.

In my view, the latest sell-off is more closely conne
With on-chain patches like this, nobody pays attention until something goes wrong—and then it’s a big deal.

On the evening of November 4, XRP Ledger activated a patch: accounts with only burn permissions should not have minting rights, but under the old rules they could mint tokens themselves under certain conditions. The issue involved on-chain issued assets, including stablecoins; XRP itself was unaffected, and there have been no publicly known exploits to date. The same batch also addressed accounting in the lending module, token recovery from the transaction pool, and signature validation
post-image
XRP-1.15%
2Z-3.17%
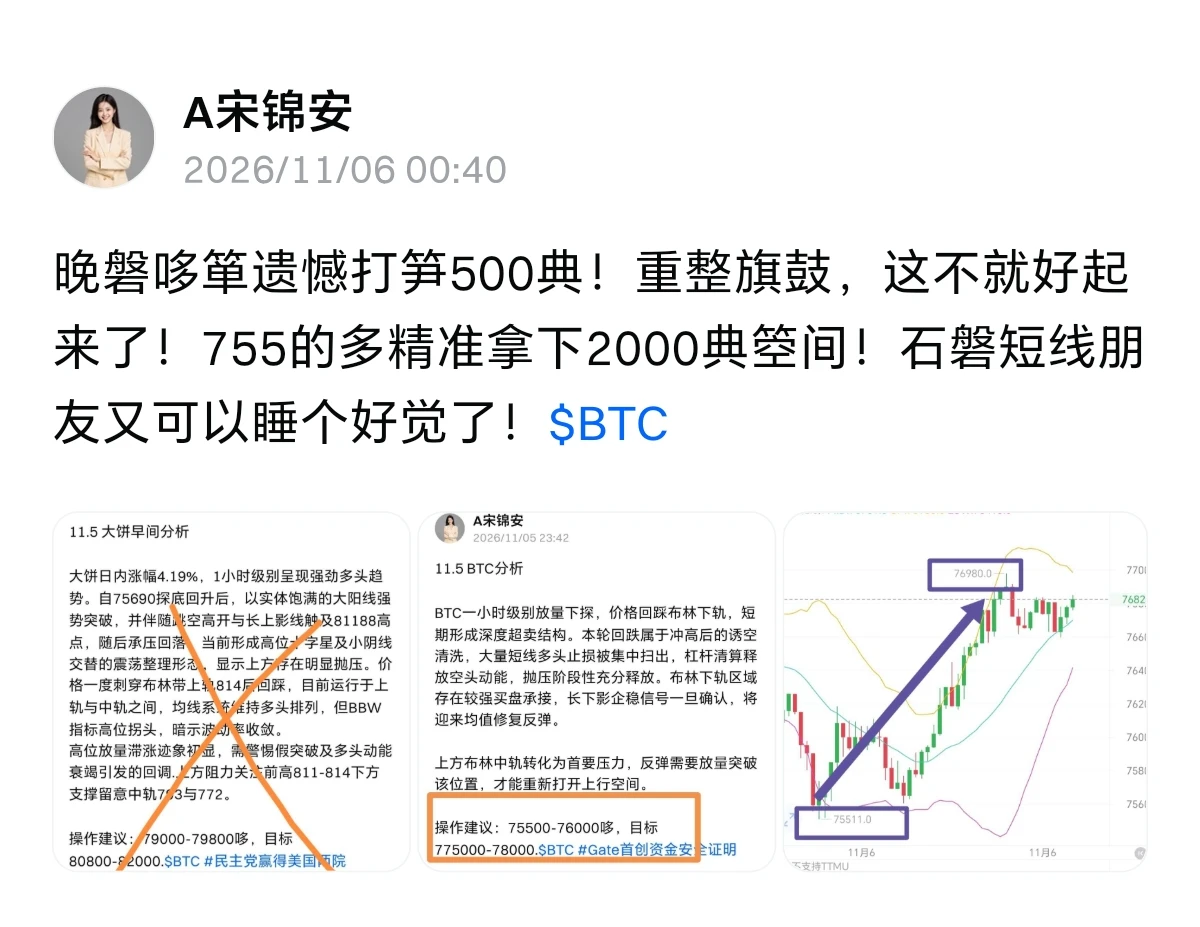
11.6 BTC Analysis

BTC saw a rapid sell-off on the one-hour timeframe, with the price retesting the lower BOLL band. A long lower wick formed intraday, completing a liquidity sweep—a typical door-shaped shakeout pattern. This sharp drop does not signal a trend reversal; rather, the pullback triggered a concentrated liquidation of long stop-losses. After the concentrated release of bearish momentum, the deviation widened significantly, creating strong expectations of mean reversion.
Buying support is gradually emerging at current lows. If the hourly candle closes with a sign of stabilization, a
post-image
BTC-0.67%
What Happens If BTC Breaks Above 82,000?
live-cover
LIVE1,063
#USStocksFaceHistoricSelloff Wall Street had its roughest day in months on 5 November, and the damage was concentrated in the names that carried the AI rally. Closing prints from the Gate feed show the S&P 500 ETF (SPY) at $733.00, down 4.41%, and the Nasdaq 100 ETF (QQQ) at $647.05, down 6.49%. Reuters reported that the Nasdaq 100 fell 6.4% and erased about $2.5 trillion in market value, its deepest one-day drop since "Liberation Day" in April 2025. The sell-off started after the midterm results, when investors began to question how much of the AI data-center buildout could survive a Democrat
  • 1
  • 1
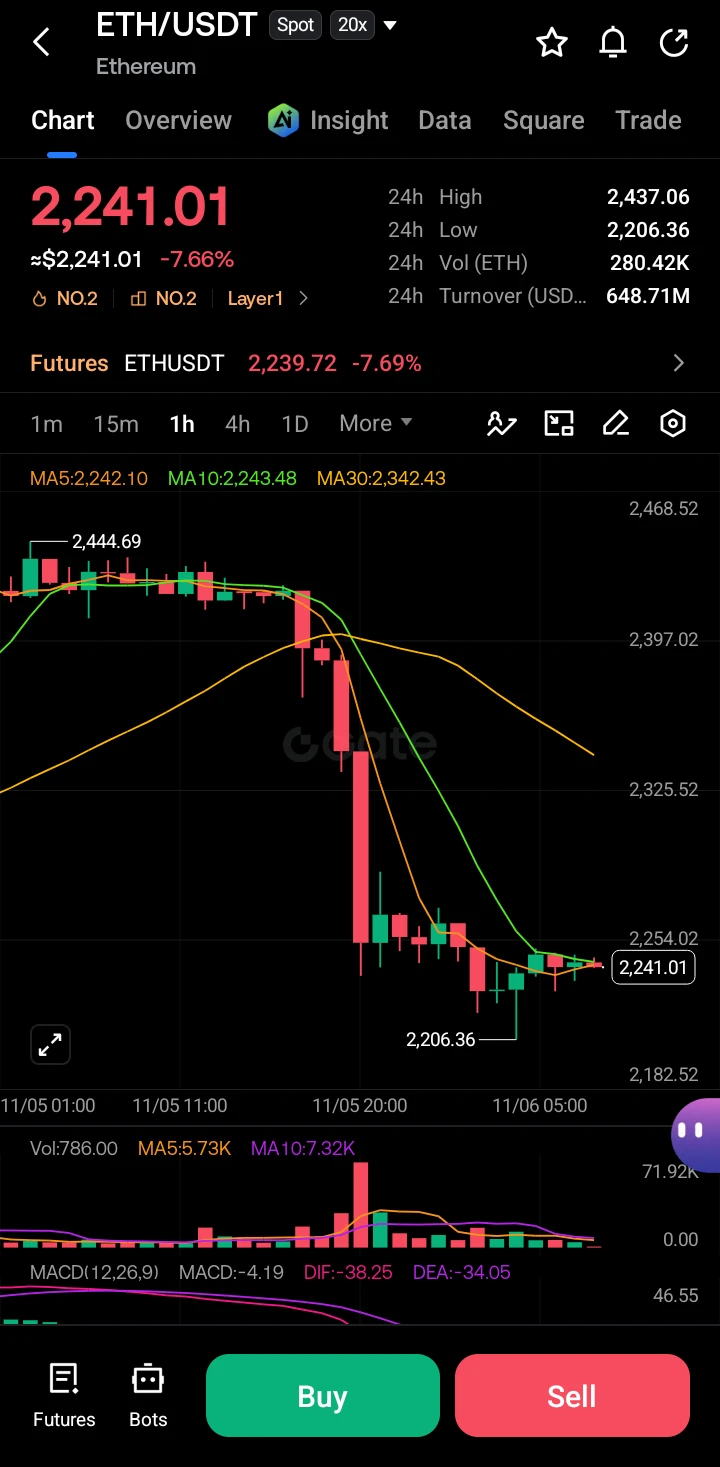
$ETH ‌

ETH/USDT Technical Analysis Update: Short-Term Bearish Structure

Market Overview.

Ethereum (ETH) currently exhibits a pronounced short-term bearish bias, trading at approximately $2,241.01 against USDT. The asset has registered a significant drawdown of -7.66% over the 24-hour period, failing to sustain support near the $2,444 level and establishing a lower high structure. The intraday low of $2,206.36 serves as a critical pivot point for immediate price action.

Trend and Moving Averages
The 1-hour chart reveals a steep downtrend following a breakdown from consolidation. Price acti
post-image
ETH-1.26%
  • 6
  • 2
#Gate2026YearEndGala
Gate's Year-End Gala Is Open: Here's What Creators and Fans Can Actually Win

If you stream, create, or simply support the people who do, Gate's 2026 Year-End Community Gala is the moment to act. The registration window closes on 10 November at 15:59 UTC, which is about six days from now. Two categories, Streamer of the Year and Creator of the Year, run in both a Chinese-language division and a Global division, and each division ranks its top 20 separately.

Where the program stands today
Registration runs from 3 November to 10 November. Qualified applicants move into the
GT-2.41%
DOGE-0.22%
  • 4
  • 1
Gate Live’s daily Red Packet Rain is here! Have you grabbed yours today?
🎙 Catch the latest market moves with pro streamers watching the charts live. Join the conversation, hop on mic, and talk trends & trading opportunities together~

Look for livestreams with the 🧧 icon on the cover, jump in, and grab your red packets!
⚡ Get your fingers ready: https://www.gate.com/live
GateLive
Gate Live’s daily Red Packet Rain is here! Have you grabbed yours today?
🎙 Catch the latest market moves with pro streamers watching the charts live. Join the conversation, hop on mic, and talk trends & trading opportunities together~

Look for livestreams with the 🧧 icon on the cover, jump in, and grab your red packets!
⚡ Get your fingers ready: https://www.gate.com/live

repost-content-media
  • 2
What Is Triangular Arbitrage? How Can You Find Opportunities Using the Price Relationships Between Three Trading Pairs, and Why Can Trading Fees Turn Theoretical Profits Into Losses?

In the cryptocurrency market, price relationships between different trading pairs on the same exchange can sometimes briefly diverge. Triangular arbitrage takes advantage of these discrepancies by completing three consecutive trades to exchange assets, aiming to end up with more of the starting asset. But spotting a price gap does not mean a trade will necessarily be profitable.

First, what is triangular arbitra
post-image
BTC-0.67%
ETH-1.26%
📡 Real-Time Signal Card | Just Captured by BTCSOS
KOL: Bitcoin Fengge Direction: $ETH Long Entry: 2435 Target: 2520 / 2560 Stop Loss: 2360 Time: Not specified (just captured)
Speaking of which, I reposted Fengge’s $ETH trade earlier today, and now he’s back again. He really is diligent 👀
As usual, Sis is just passing this along. Whether to follow and how much to put in is up to you, babe. The market can go crazy, but risk management can’t.
Shared as a personal record, not investment advice. #ethereum
ETH-1.26%
#美股史诗级抛售 #Gate股票畅聊季 #WCTCS9 $NVDA The direct trigger for this sell-off was investors beginning to reassess the policy risks facing the AI industry's rapid expansion after Democrats scored a major victory in the U.S. midterm elections.
Democrats gained ground in Congress and several states, raising market concerns that tighter AI regulation and local restrictions on data center construction could delay investment in U.S. AI infrastructure. UBS analysts estimate that about 30% of the data center capacity expected to be added in the U.S. in 2028 could be affected by potential construction morato
NVDA-9.33%
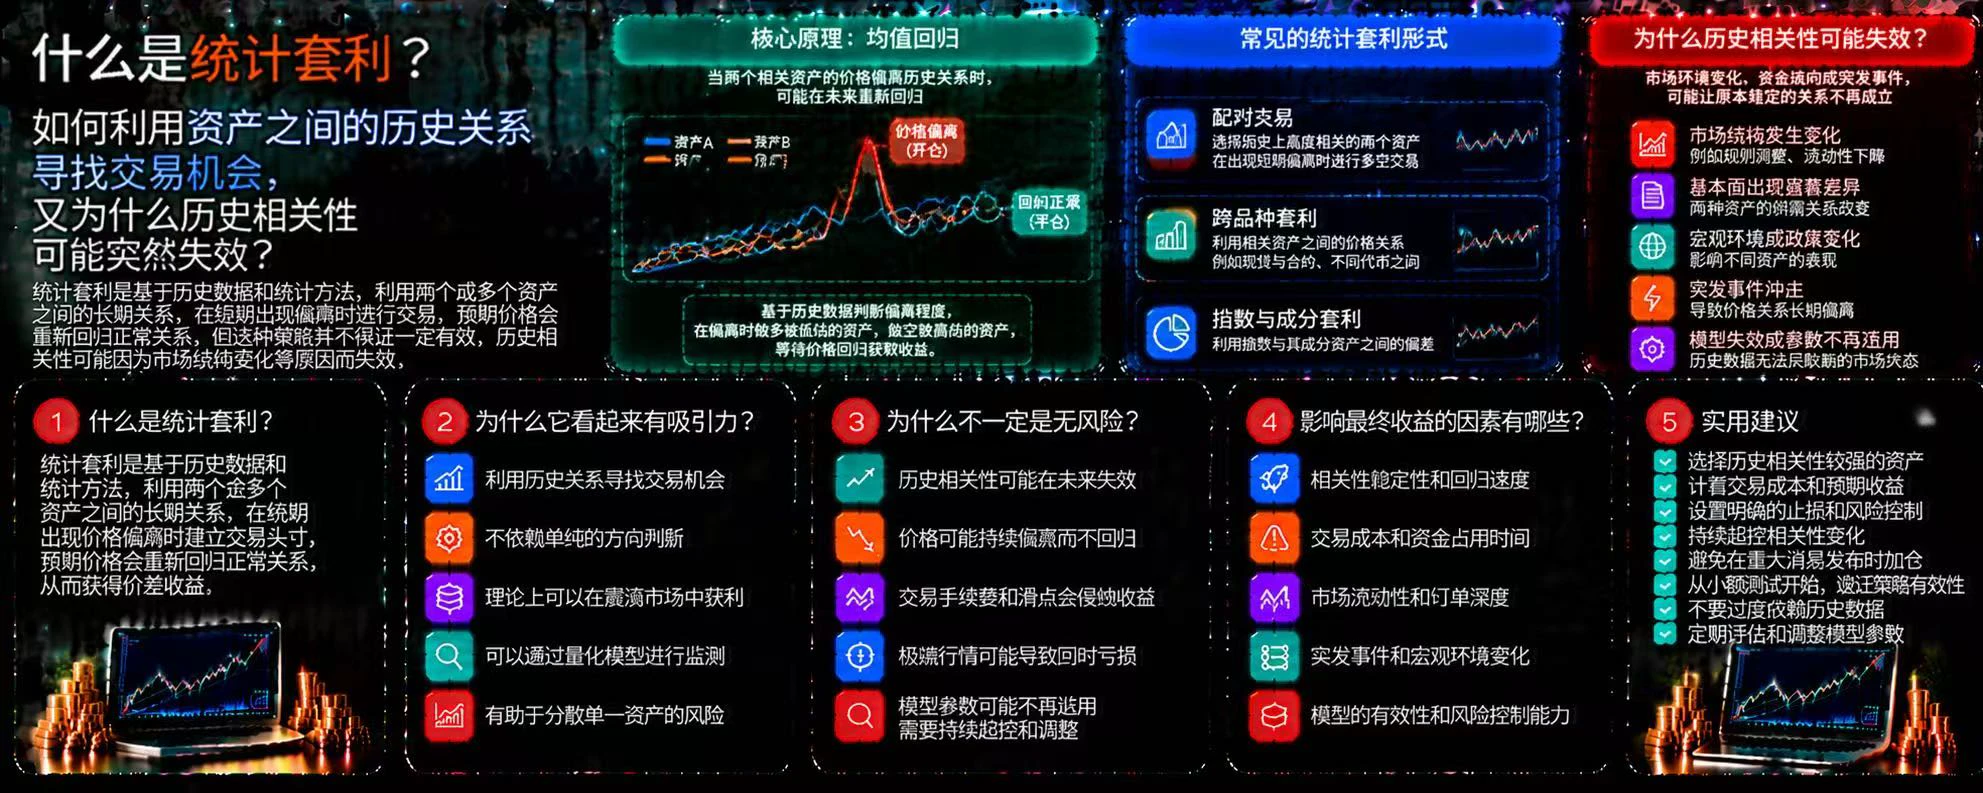
What Is Statistical Arbitrage? How Can Historical Relationships Between Assets Reveal Trading Opportunities, and Why Might Historical Correlations Suddenly Break Down?

In the crypto market, some assets have long displayed similar price movements. When their historical relationship temporarily deviates, traders may try to use that divergence to identify opportunities. This is the basic idea behind statistical arbitrage, but historical patterns are no guarantee of future repetition.

First, what is statistical arbitrage?

Statistical arbitrage is a type of trading strategy that uses historical
post-image
$SOL Solana is still above the 200 EMA on the full timeframe.
As you can see in the picture, it has remained above it throughout its history.

I do swing trading with SOL, but my main strategy is long-term holding.
Indeed, patience pays off.

#SOL $NVDA $AMD
NVDA-9.33%
AMD-17.64%
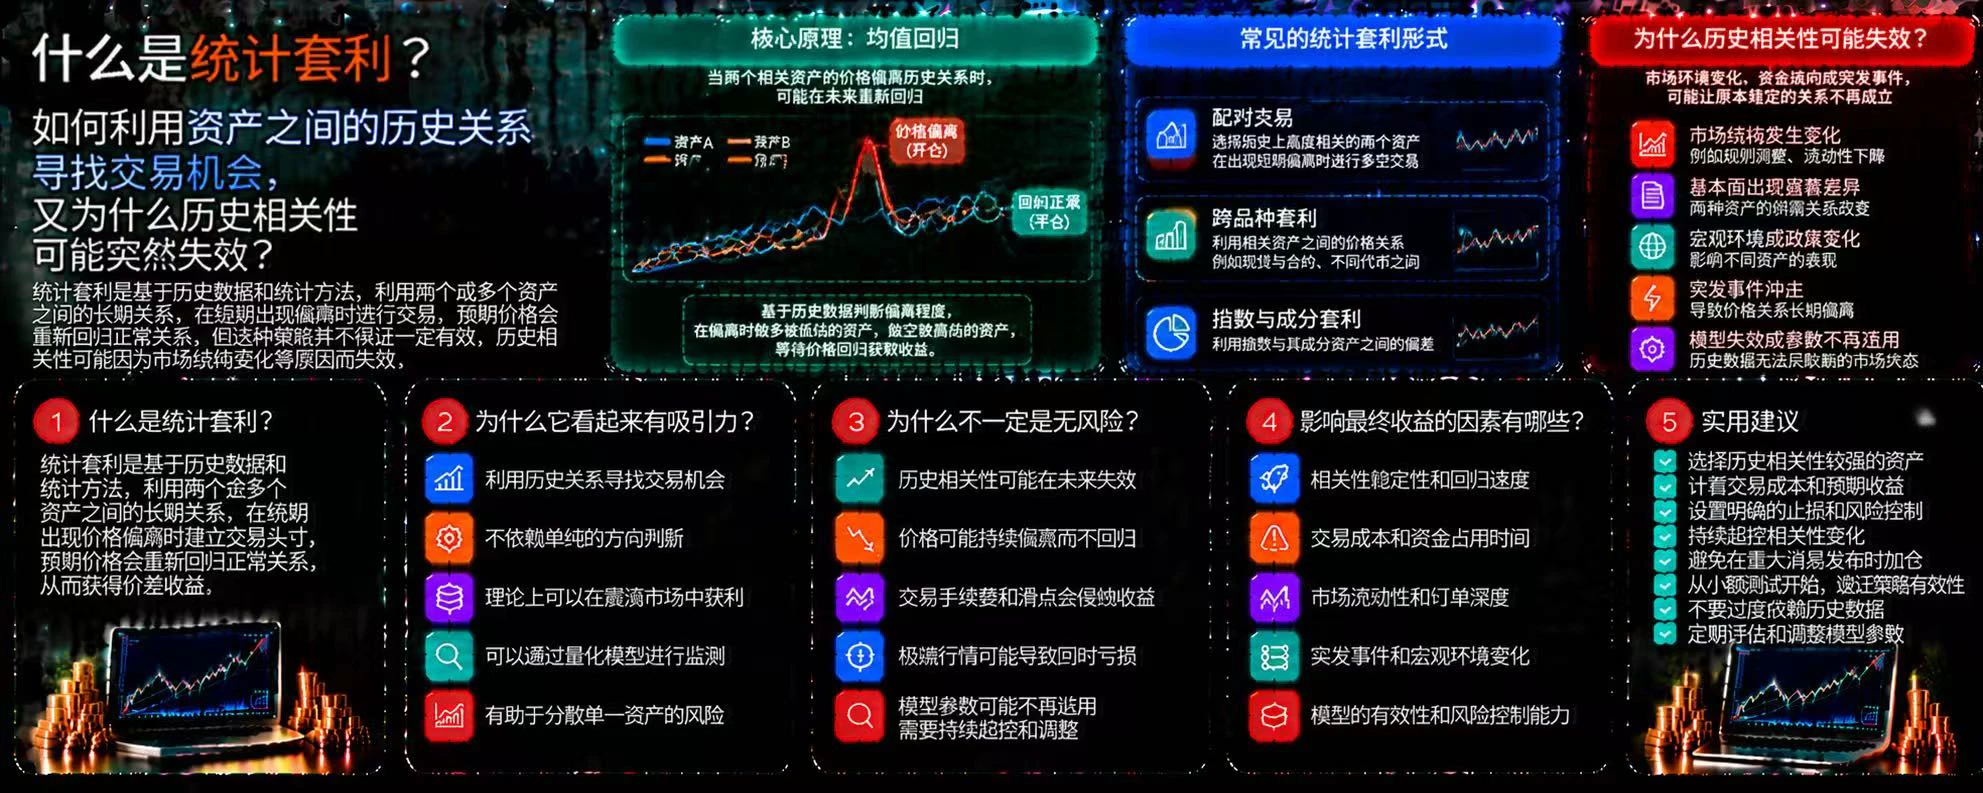
What is statistical arbitrage? How can historical relationships between assets be used to identify trading opportunities, and why might historical correlations suddenly break down?

In the cryptocurrency market, some assets have long exhibited similar price movements. When their historical relationship temporarily deviates, traders may try to exploit the discrepancy. This is the basic idea behind statistical arbitrage, but historical patterns do not guarantee that they will repeat.

First, what is statistical arbitrage?

Statistical arbitrage is a type of trading strategy that uses historical
post-image
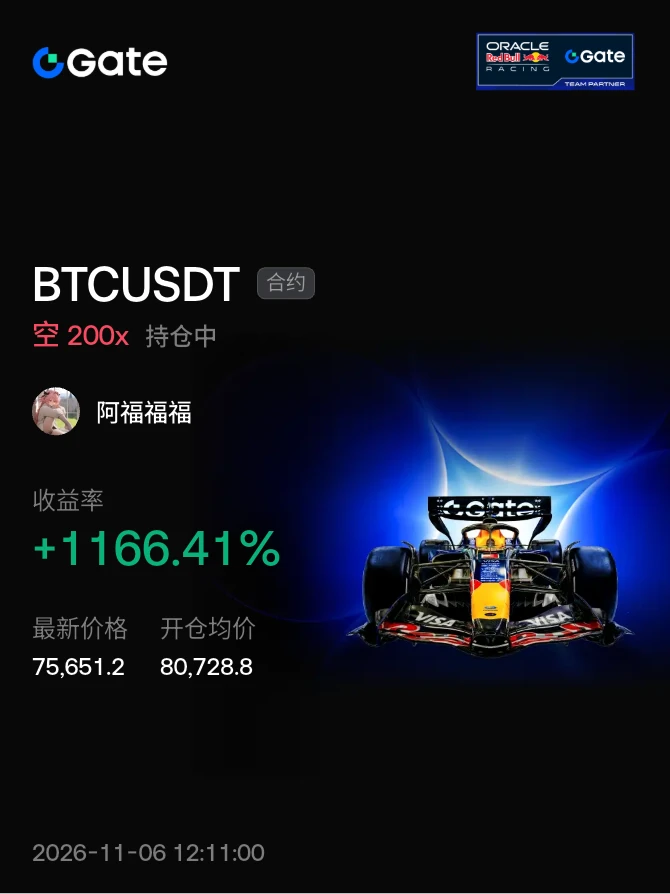
#btc My jaw muscles are exhausted. Now let's see if it gets near 710; if it does, one shot and a new low may be in sight.😀
post-image
BTC-0.67%
Load More

Join 40 M users in our growing community

⚡️ Join 40 M users in the crypto craze discussion

💬 Engage with your favorite top creators

👍 See what interests you

Trending Topics

USStocksFaceHistoricSelloff

987 Views3.48k Discussing

U.S. stocks suffered a sharp selloff on Thursday, with the Nasdaq closing down more than 5% and the Philadelphia Semiconductor Index falling over 12%. AI and chip stocks including $NVDA and $AMD were hit especially hard. Markets are reassessing AI valuations, data-center spending and future returns. Is this just short-term deleveraging, or the start of a deeper correction in the AI trade? Which sectors are you watching next?

GateLaunchesPoSECProofOfSecurity

12.01k Views569 Discussing

USNonfarmPayrolls

9.34k Views3.99k Discussing

View More