
Square
Following
Hot
News
Notifications
Profile
Share your thoughts
placeholder
Article
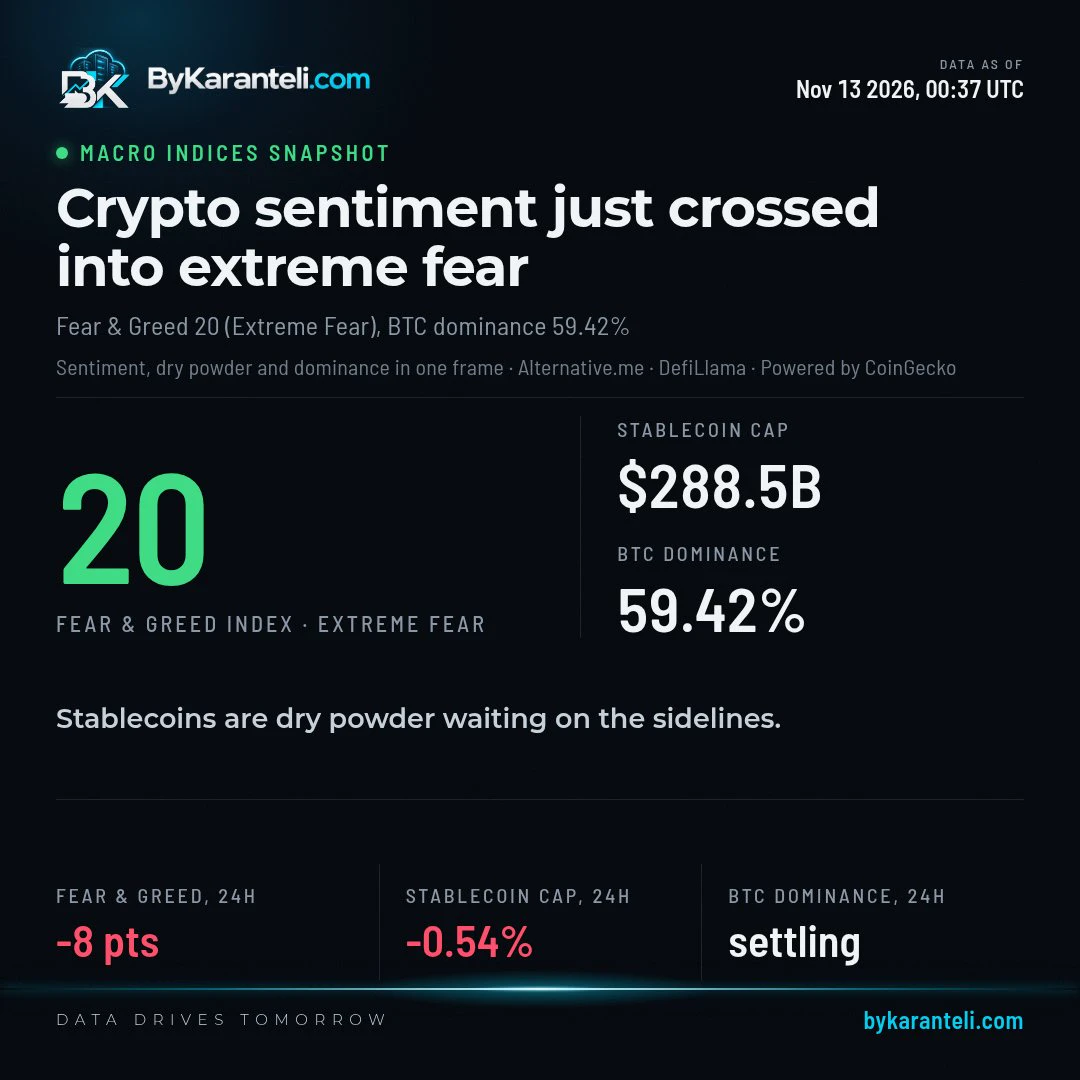
Fear just went extreme across crypto. The Fear and Greed index crossed into its extreme fear zone at 20, a reading built from how the crowd is trading and talking about the market. $BTC
post-image
BTC-0.67%
11,900 paying enterprise customers and 79% of revenue from outside its top five customers are Anthropic’s most solid assets

There’s a figure in Anthropic’s prospectus that deserves more attention than its revenue growth: in the third quarter, 79% of revenue came from customers outside its top five.

Revenue concentration among a small number of major customers is a widespread problem in the AI industry. Microsoft’s revenue share and Azure channel account for a large portion of OpenAI’s revenue, and many model companies essentially derive their revenue from “strategic purchases” by a handful o
AMD+5.86%
Trenches
mihao
m
bade
b
mihao
4Cxj...pump
Market Cap
$.
Change
.
24h Vol
$.
Holders
.
AGT
A
bade
b
AGT
0x5d...e274
Market Cap
$.
Change
.
24h Vol
$.
Holders
.
Max
M
bade
b
Max
5qaP...pump
Market Cap
$.
Change
.
24h Vol
$.
Holders
.
IDOL
I
bade
b
IDOL
0x3b...ab07
Market Cap
$.
Change
.
24h Vol
$.
Holders
.
AI
A
bade
b
AI
2T56...pump
Market Cap
$.
Change
.
24h Vol
$.
Holders
.
London, I’m inside of you!
post-image
Short $MAGMA ‼️ Entry: 0.332 - Current price Take profit: 0.300 Stop loss: 0.364
post-image
MAGMA-0.57%
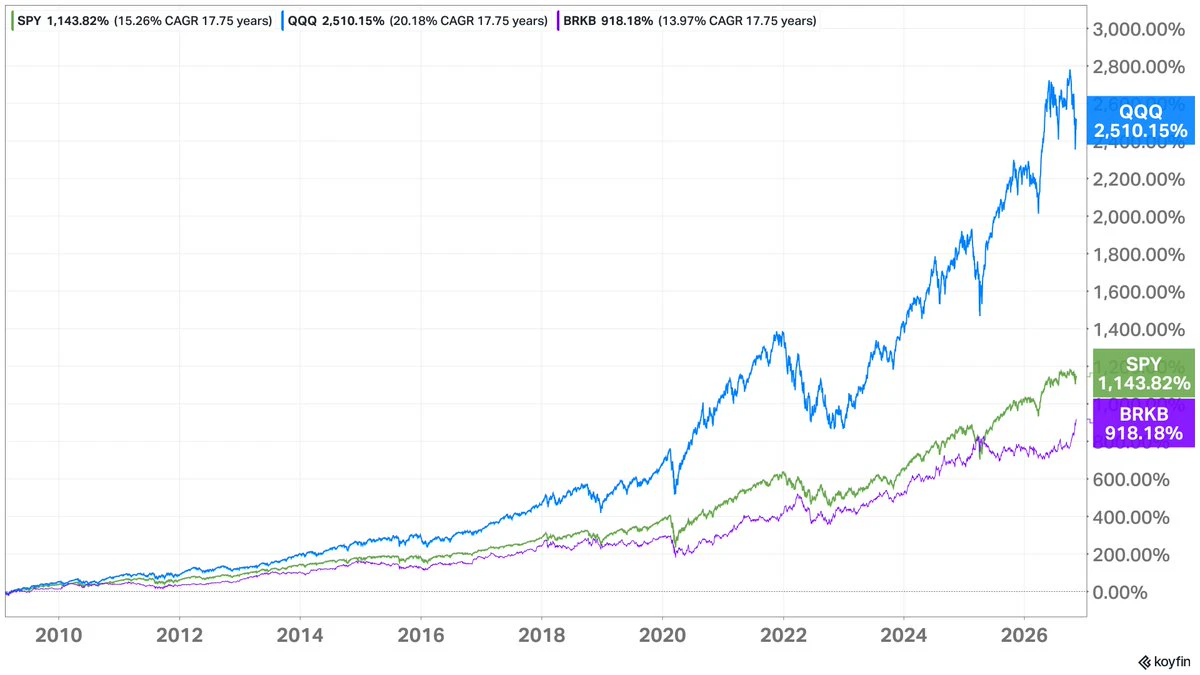
Berkshire’s stock price has continued to rise recently, reaching a new high. This has prompted many people online to ask whether BRK.B is a better choice than SPY for long-term investing.

Berkshire’s strategy isn’t transparent, and outsiders don’t know how it internally decides which investments to keep and which to drop. Since the end of the 2009 financial crisis, BRK.B has actually underperformed SPY overall. This may point to a problem with its strategy, such as Buffett being too conservative. It’s also unclear whether the new CEO will take a more aggressive approach.

I tend to prefer inv
post-image
BRK.B+0.29%
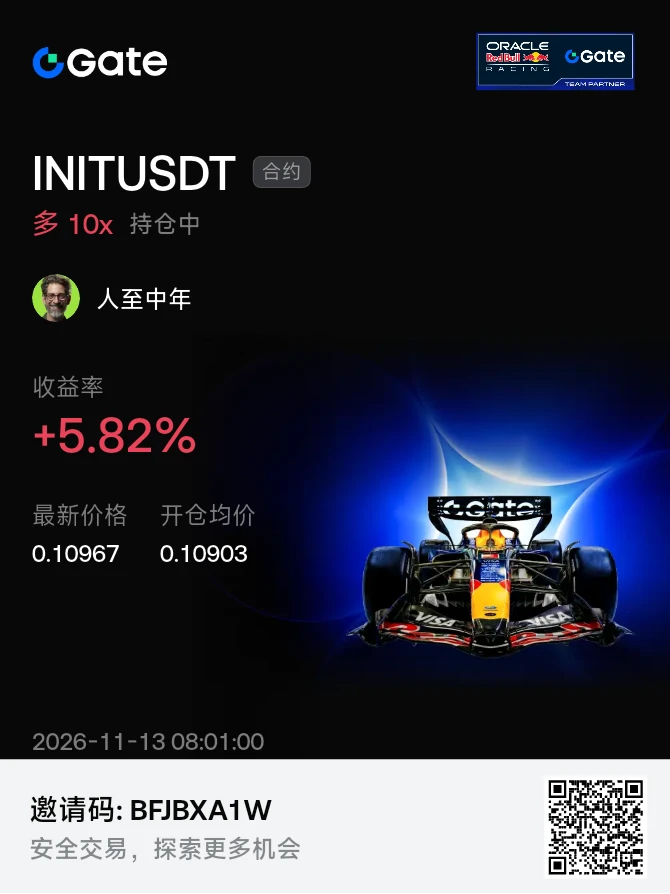
$INIT One long order every day—let's see how low you can go.
post-image
INIT-2.53%
The yearly line was lost yesterday. The first time since this rally began in July.

BTC closed at 71,460 yesterday, while the daily 200-day moving average was at 73,106. It was still at 57.8k in early July, and after rising for more than four months, the price had never closed below the yearly line—until the day before yesterday it was still above it, and yesterday it wasn’t.

The yearly line isn’t some mystical indicator; it’s simply the average cost of everyone who bought over the past six months. When the price falls below it, it’s a clear message to everyone: all those who entered during t
post-image
BTC-0.67%
Wall Street is really getting boxed in by stablecoins this time. Starting January 18, every newly issued coin has to be backed by short-term Treasuries, effectively creating a whole new class of buyers for U.S. debt. After doing this for so long, I’ve learned that position sizing is always more important than calling the direction. This hot trend is shifting from tech to financial infrastructure, and I’m not chasing it. So what’s the conclusion? I haven’t figured it out either.
post-image
  • 1
  • 1
This quarter from $NBIS proves $IREN was spot on with its business model
You can't rely on power providers. You gotta go vertical
Nebius faced delays at data centers it doesn't own or control
Now, the company is taking more control at every step
post-image
NBIS-16.96%
IREN-6.45%
Crypto Market update
live-cover
LIVE624
#Gate股票畅聊季
AI Tech Stocks: A Comparison of AMD and NVDA

Recent data shows two different pictures in AI tech stocks. AMD shows a strong recovery, while NVDA follows a more cautious path.
AMD: Strong Recovery
AMD closed at 583.11 dollars. In after-hours trading, it fell by 2.30 dollars, -0.39%, a limited pullback. In intraday trading, it rose to 585.41 dollars, up 32.44 dollars, +5.86%, a strong gain. The prior close was 552.97 dollars, the open was 569.28 dollars. The 24-hour high was 594.00 dollars, the 24-hour low was 550.64 dollars.

The low on the chart is 400.00 dollars, the high is 648
post-image
AMD+5.86%
NVDA-4.49%
  • 14
btc market update
live-cover
LIVE1,967
#GateGlobalComplianceExpansion #ShareWeekly

Gate’s Expansion Across 81 Regulated Jurisdictions: Why Compliance, Security, and Equal Treatment Must Go Hand in Hand

When we talk about the future of the cryptocurrency industry, global expansion is often measured by trading volume, user growth, new products, and market share. However, I believe there is another factor that deserves just as much attention: the ability of an exchange to operate responsibly under different regulatory frameworks while maintaining transparency and fairness for its entire global community.

Gate’s reported presence a
BTC next door has been stuck above 74,000 all week
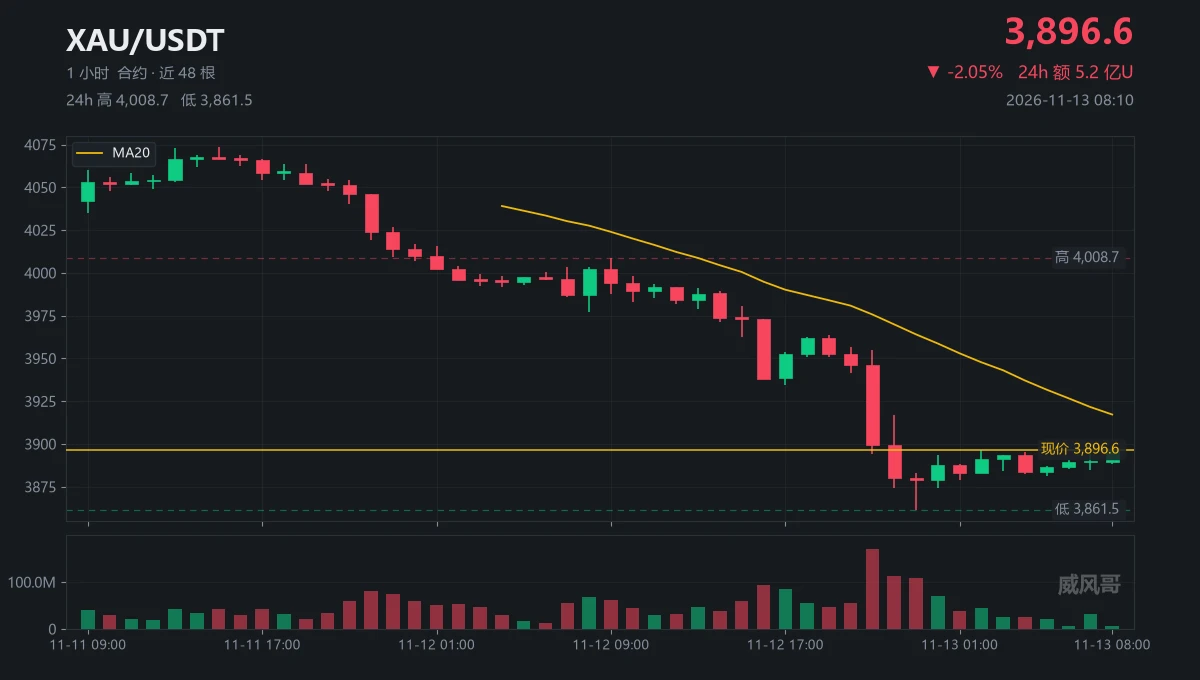
$XAU moved 212 bucks on its own, with no company
Q: Who dumped that candle at 3861.47?
A: 169 million contracts, average volume 48.12 million, 3.52x
Q: Why pick that moment?
A: 391 million contracts crammed into three slots between 21:00 and 23:00
Q: Who caught it on the way down?
A: 264 million contracts over eight hours, only 68% of the dump segment
Retail orders caught it. The same person wouldn’t dump and buy at the same time
Above, from 3899 to 3917, it’s all hands waiting to break even
Funding is still positive; longs are paying overni
post-image
XAU+0.38%
  • 1
Yesterday, we pointed out in “Night Session News” that “ETH’s daytime price action on the 12th was a ‘resistant decline.’ The bulls had no fight left in them; after a brief spike, the price came right back down, indicating that the bears were in control.” The market proved this right: ETH fell from 2050 to 1976, a 74-point drop.

Why will the decline continue in the short term?

1. A severe imbalance between bulls and bears in crypto: Over the past week, ETH has fallen nearly 500 points. “Going down”
has become the “right call,” and there is no such thing as a “technical bottom.” Behind this i
ETH-1.23%
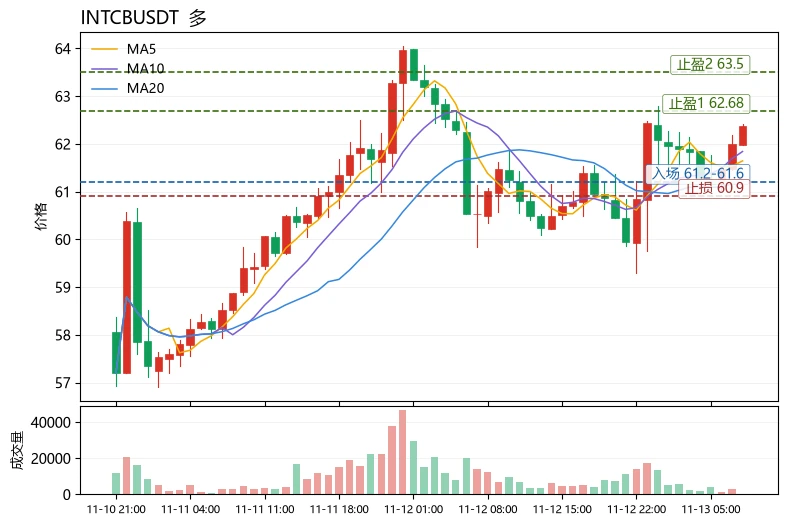
$INTCB Short-term bullish, but this is only a structural recovery amid extreme fear, not a trend reversal. Core logic: The price at 62.37 is above MA5 (61.644) and MA20 (61.253); the MACD histogram at +0.07283 remains bullish, and RSI at 59.6 is not overbought, leaving room to test the upper Bollinger Band at 62.6755. The concern is that the Fear & Greed Index is only 20, and incremental capital remains cautious; the risk of chasing highs is concentrated around wicks and false breakouts. In the tug-of-war between bulls and bears, the 24h gain of +2.77% came with only 10.0M in trading volume, s
post-image
INTCB
INTCBINTEL
Four.meme
MC:$3.22KHolders:4
0.16%
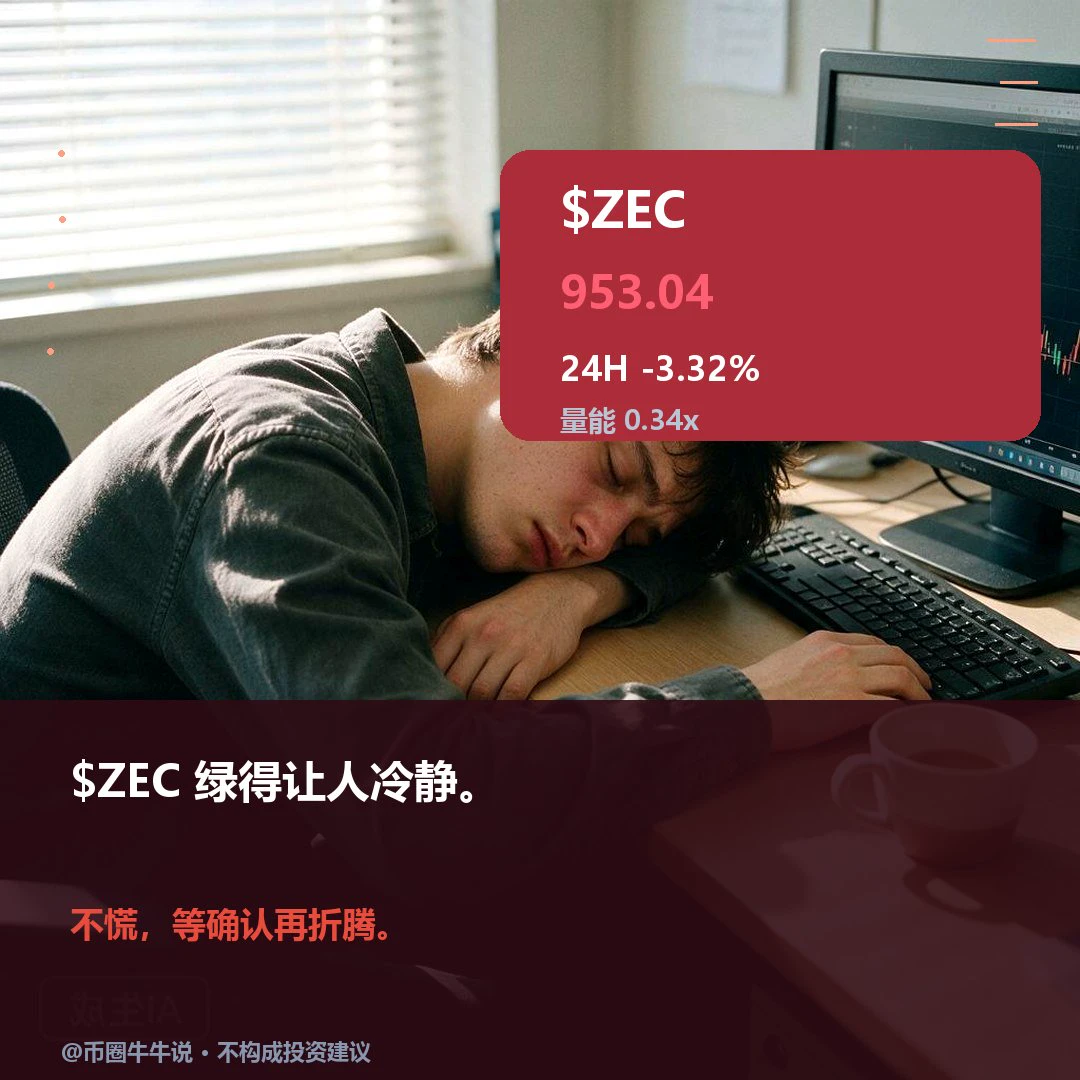
$ZEC is currently trading at 953.04, down 3.32% over 24H, with an intraday range of 931.10–1007.16. Both the 1H and 4H charts are weak, with price below the 1H EMA20 at 963.54 and the 4H EMA20 at 1027.76. The 1H RSI is 34.1 and the 4H RSI is 28.3, indicating insufficient momentum for a recovery. 1H volume is at 0.34x, so any break above resistance lacks participation. Conditional outlook: A recovery is only worth considering if price holds above resistance at 1007.16 on increased volume; if it breaks below support at 931.10 and fails to reclaim it, weakness is likely to continue. The key point
post-image
ZEC+1.16%
#USOctoberPPIComingSoon #ShareWeekly

US Inflation Data, Labor Market Signals, and Nvidia Uncertainty: Three Forces That Could Shake Global Markets

Markets are entering a period where investors need to look beyond daily price movements and understand what is happening beneath the surface. This week, three developments deserve particular attention: US Producer Price Index (PPI), initial jobless claims, and growing speculation surrounding Nvidia’s leadership. Although these events belong to different areas of the economy, they share one important connection: investor confidence.

1. US PPI: Th
NVDA-4.49%
BTC-0.67%
ETH-1.26%
On the morning of November 13, ETH bounced somewhat, but the broader structure remains weak and range-bound for now.

First watch 2026–2030 above. If price can't break through, the rebound could still pull back; below, watch 2006–2010. Holding there leaves room for more back-and-forth trading; if it gives way, next watch 1998–2000.

For now, wait for confirmation at key levels; don't chase gains or sell off in the middle. If price can hold above 2030 on strong volume, then watch 2035–2040 and around 2048.

Today's main focus is which of these two ranges breaks first. I'll update if anything ch
post-image
ETH-1.23%
Will gold break the 3,800 level today? The quant system is focused on gold. Got your bags ready?
post-image
GLDX-0.40%
PAXG+0.37%
Load More

Join 40 M users in our growing community

⚡️ Join 40 M users in the crypto craze discussion

💬 Engage with your favorite top creators

👍 See what interests you

Trending Topics

GateIPOAccessAnthropic

268.2K Views2.5K Discussing

Gate IPO Access Phase 3 features Anthropic (ANT), with USDT subscription interest starting from 100 USDT. Successful allocations will be delivered as real shares to Gate Stock Accounts. Indicative price: $70–$78/share Subscription: Nov 12–17 (UTC+8) Allocation is not guaranteed. Please manage risk accordingly.

USJoblessClaimsTonight

176.3K Views33.3K Discussing

ZECFallsBelow1000

465.5K Views3.9K Discussing

View More