





Square
Following
Hot
News
Notifications
Profile
Share your thoughts
placeholder
Article
My friend catches the most every time.
$SIGN Bulls are poised to move, and a rebound window is opening
Currently, $SIGN is showing signs of stabilizing after an extended period of weakness and decline. Buyers have formed a support defense around $0.0080. If the price can decisively move above the $0.0090 mark, its upward momentum may accelerate significantly.
Long setup reference: Entry range: $0.00870–$0.00890 First target: $0.00920 Second target: $0.00960 Third target: $0.01000 Stop level: $0.00820
$SIGN is currently in an attempted rebound phase. The key is whether the bulls can take $0.0090; once it breaks through, there wil
post-image
SIGN-2.90%
Trenches
FIONA
F
bade
b
FIONA
B34n...pump
Market Cap
$.
Change
.
24h Vol
$.
Holders
.
IDOL
I
bade
b
IDOL
0x3b...ab07
Market Cap
$.
Change
.
24h Vol
$.
Holders
.
PIEVERSE
P
bade
b
PIEVERSE
0x0e...25a9
Market Cap
$.
Change
.
24h Vol
$.
Holders
.
mihao
m
bade
b
mihao
4Cxj...pump
Market Cap
$.
Change
.
24h Vol
$.
Holders
.
CLAUDIA
C
bade
b
CLAUDIA
2j5S...W2ZM
Market Cap
$.
Change
.
24h Vol
$.
Holders
.
My Portfolio is Back to Normal , Thank You $BTC 🫶
post-image
BTC-0.67%
  • 1
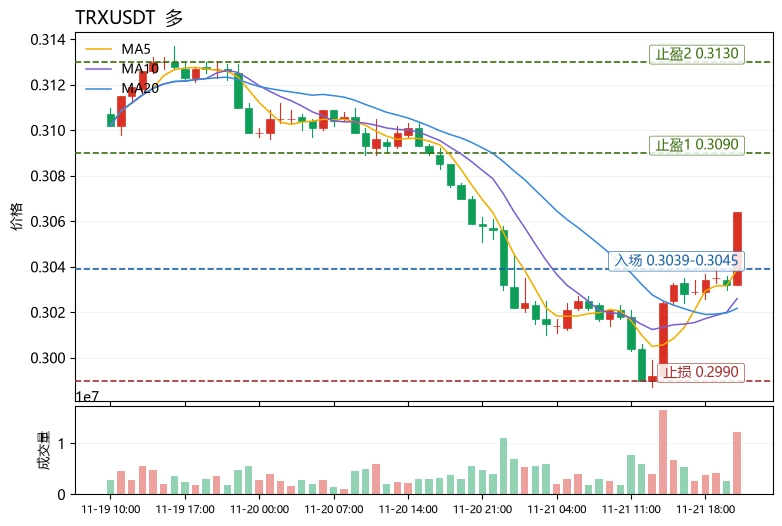
The Extreme Fear Index is only 12, yet $TRX has turned green against a positive funding rate—today’s most unusual market detail. Extreme fear and leveraged longs coexisting indicate that long positions are already quite crowded. TRX is currently at 0.3064, above the Bollinger upper band at 0.305269. MA5 has crossed above MA20, but the 30-candle range is only 3.49%, with volatility compressed to an extreme; once the market picks a direction, slippage will increase. A funding rate of +0.0083% means longs have to pay to hold their positions. This is the starting point for the worst-case scenario
post-image
TQQQB
TQQQBTQQQB
Four.meme
MC:$3.36KHolders:2
0%
TRX+0.42%
PROM+0.45%
$ADA Is Strong in the Short Term but Weak on the 4-Hour Chart—Which Will Shift First?
$ADA is currently trading at 0.1445, up 2.555% over 24 hours, with an intraday range of 0.1333‑0.1456. The 1-hour chart shows strength: the price has moved above the EMA20 (0.14175), RSI14 is at 52.23, in neutral-to-bullish territory, and the volume ratio of 1.22 is slightly above average, suggesting signs of active buying support in the short term. The 4-hour chart, however, remains weak: the price is still below the EMA20 (0.14638), and RSI14 is only 35.94. While it is not deeply oversold, momentum is insuf
post-image
ADA-1.48%
U.S. Elections: The Market Is Always Stormy Afterward, 4 Out of 4 Times
#bitcoin #trading #crypto #indicators #cryptocurrency
post-image
BTC-0.67%
  • 1
$MUU Micron’s latest earnings report was very strong, with record revenue and profits, while HBM shortages supported rapid profit growth. But the stock posted seven straight down days, getting cut in half from 1213 to 594, a 51% drop.

How many people were anchored by “the earnings are so good, it should rebound now” and went long above 11? But the AI infrastructure sell-off spread to memory chips, and the Philadelphia Semiconductor Index plunged more than 10% in a day. All the bulls got while waiting was lower lows.

I didn’t wait for the earnings narrative to recover. I went long only after
MUU-1.34%
BTC-0.65%
ETH-1.23%
$BTC | Bounce harder please.
post-image
BTC-0.67%
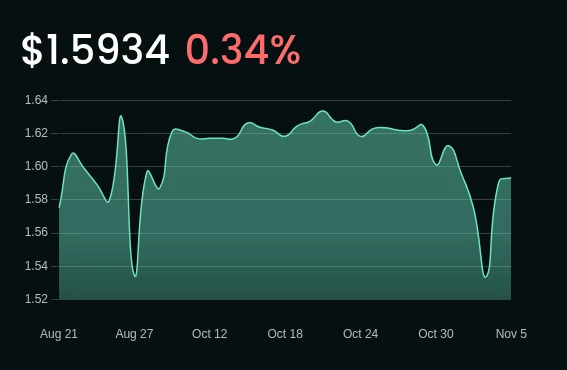
Kira's portfolio update: Over 3 months, we're at $1.59 with a -0.34% dip but holding strong with an annualized +11.72%! Navigating DeFi dynamics and hunting for alpha. 🚀 #Crypto #Trading #Portfolio
Ready to start your journey?
post-image
$ETH is currently in a tricky position, showing strength on the one-hour chart but weakness on the four-hour chart. This divergence across timeframes makes it difficult to judge the next move. The 24-hour decline has reached 3.24%, with the price falling from a high of 1759.63 to its current level of 1698.53. The one-hour RSI is as high as 66.17, while the four-hour RSI is only 37.12, giving completely opposite signals. In this situation, we need to wait for the price to choose its own direction.
I’d rather view this as a direction that hasn’t been confirmed yet, instead of rushing to label i
post-image
ETH-1.26%
🔹 NVIDIA Interim CEO Colette Kress Faces a “Glass Cliff” as She Must Deal With Jensen Huang’s Legac
live-cover
LIVE1,873
BTC-0.67%
XAUUSD-2.40%
XAU+0.38%
ETH-1.23%
NVDA-0.35%
#黄金逼近3500美元关口 Gold has fallen alongside the stock market this time because cash is scarce and rate expectations have turned tighter, temporarily pushing safe-haven demand aside. $3,500 is the most important level to watch right now, but it is more a test of whether prices can stop falling than a firm support level. A genuine reversal will likely have to wait for rate-hike expectations to ease first.

Why the safe-haven effect has temporarily failed
· Rate-hike expectations are weighing on gold: The market has priced in about a 96% chance of a 25-basis-point rate hike in December. U.S. Treasury
post-image
ThisIsTranslateContent:
#黄金逼近3500美元关口 Gold is falling alongside stocks this time because cash is scarce, rate expectations are tightening, and safe-haven demand has temporarily taken a back seat. $3,500 is the most important level to watch right now, but it is more a test of whether prices can stop falling than a firm support level. A real reversal will likely have to wait until rate-hike expectations ease.
Why safe-haven demand has temporarily failed
· Rate-hike expectations are weighing on gold: The market has priced in about a 96% probability of a 25-basis-point rate hike in December. The real yield on U.S. Treasuries has risen from about 1.7% to around 2.9%, reducing the appeal of non-yielding gold.
· Institutions need cash: As AI tech stocks fall and Anthropic's listing siphons off funds, leveraged institutions need to meet margin calls, so they sell the easiest assets to liquidate first: gold.
· Technical breakdowns amplify selling: After $3,800, $3,700, and $3,600 were breached in succession, stop-losses and long-position reductions triggered a cascade of selling.
Can $3,500 hold?
· It has already been tested intraday: On November 20, gold hit a low of $3,502.93 and closed at $3,537.87, so it has not truly broken below the level yet.
· How far prices recover will determine whether the decline has stopped: Regaining $3,600–$3,700 would only mean the pace of the decline has slowed; reclaiming $3,800 while real yields and the dollar stop worsening would count as a short-term recovery.
· A break below could lead to the next level: If $3,500 fails to hold, there are no obvious round-number levels of support below, and prices could continue to fall.
Should we wait for rate expectations to change?
The main pressure on gold prices right now comes from the market repricing Fed policy. Rate-hike expectations are unlikely to ease significantly before the December policy decision. A more cautious approach would be to wait until the market starts pricing in a “pause in rate hikes” or “rate cuts”—for example, if rates are not raised in December, the dot plot is revised down, inflation falls significantly, or U.S. Treasury real yields turn lower again.#WCTCS9 $XAUUSD ‌

repost-content-media
PAXG+0.37%
ANT-8.68%
  • 1
Good morning friends! Happy Saturday!
Who is awake and grinding?
Have a blessed day 🩵
post-image
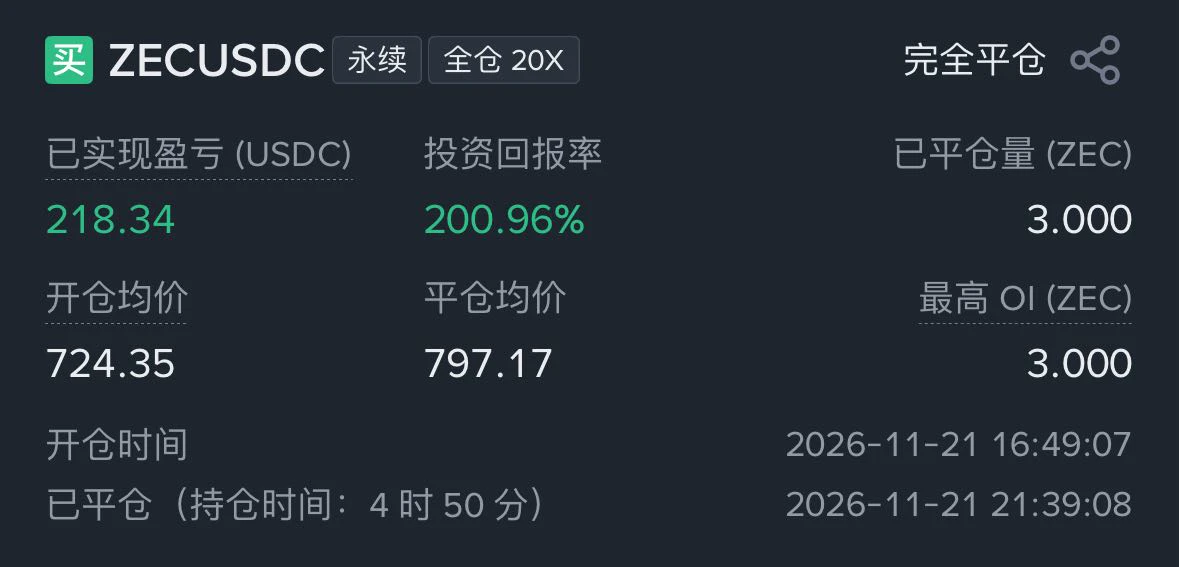
$ZEC Going long is actually quite simple. Let me briefly explain the logic.

ZEC's own structure has reached the area near the previous high on the 680-day line, a level that is very likely to provide support.

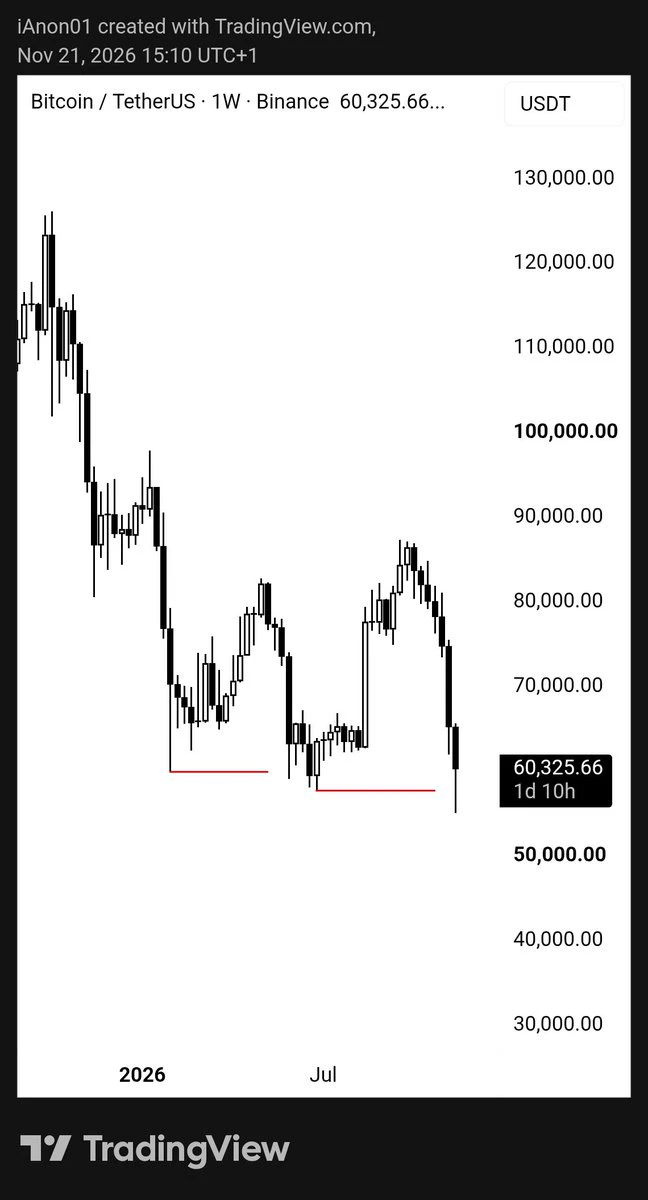
BTC fell all the way from 60,000 to 55,000. When it made its final low at 55,100, ZEC did not follow, showing relative strength.

BTC fell more than 10% over the weekend. Especially after the extremely steep one-way decline on both the weekly and daily charts, the demand for a rebound is quite strong. Perhaps all it takes is a 1-hour rebound to give ZEC a chance to shine.

The initial p
post-image
ZEC+1.29%
  • 1
Conviction or Stupidity?
post-image
Those who shorted BTC at 61000 should set a breakeven stop-loss, and those who aggressively shorted ETH at 1715 should reduce their position and set a breakeven stop-loss
post-image
ETH-1.23%
  • 3
  • 1
Back at the highs and acting like it owns the place. You really going to break through this time, $TRUMP ?TP: 0.908SL: 0.838Also active:

$DODOX : Current Price 0.037007 - 24h Change: +15.98%
$SOL : Current Price 70.82 - 24h Change: +0.50%
post-image
DODOX
DODOXDODOX
Pump.Fun
MC:$2.22KHolders:87
32.76%
TRUMP-0.95%
SOL-0.77%
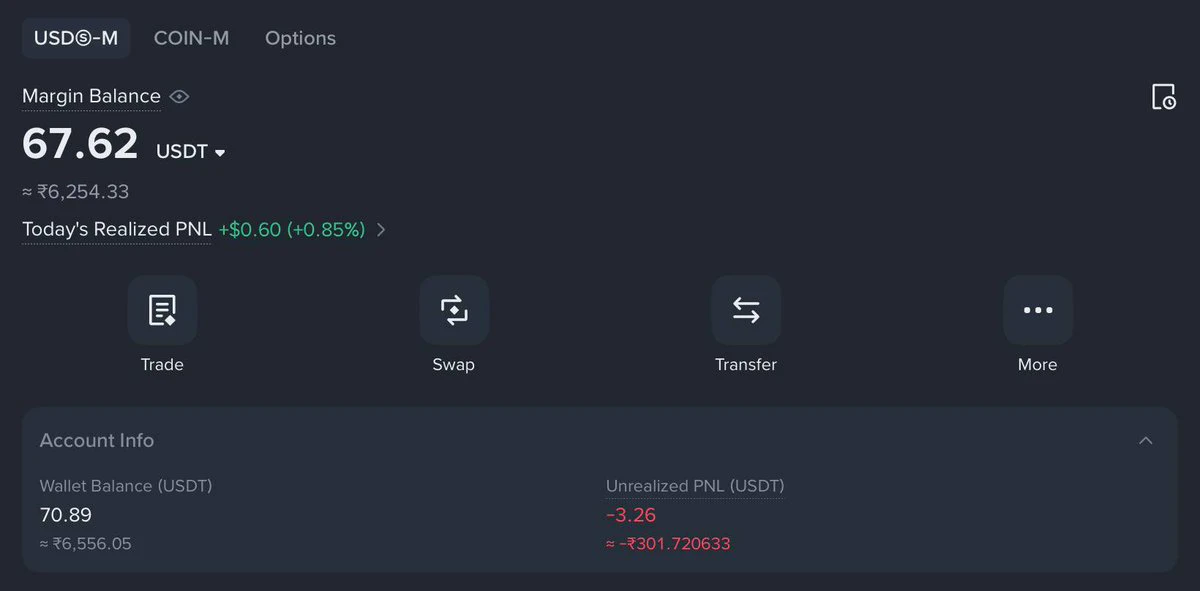
I'm exhausted. My Gate.io account was registered 2 months ago
My account's maximum unrealized loss was $600
After working hard these past few days💪
I got back on my feet. My account is currently $150 in net profit
Steady and solid, slow is fast. Keep it up👏
#BTC #ETH #纳斯达克 #XAU
BTC-0.67%
ETH-1.26%
NAS100-4.60%
XAU+0.38%
  • 1
Whale adds 10.2 million in long sliver position
live-cover
LIVE2,002
BTC-0.67%
$ETH A small ETH long—love me a little more
post-image
ETH-1.26%
Load More

Join 40 M users in our growing community

⚡️ Join 40 M users in the crypto craze discussion

💬 Engage with your favorite top creators

👍 See what interests you

Trending Topics

BTCBreaksBelow60K

2.1M Views29.7K Discussing

BTC fell below $60,000 on November 20 for the first time since July, alongside a tech stock selloff and broader pressure on risk assets. Will $60K become resistance, or can BTC quickly reclaim it? What price or volume signals would convince you that selling pressure is easing?

GateDirectIPOPhase3ANTAllocates92100Shares

770.5K Views4.9K Discussing

NvidiaDropsNearly14Percent

323.3K Views7.5K Discussing

View More