Share crypto content and earn up to 60% commissions through content mining.
placeholder
gatefun
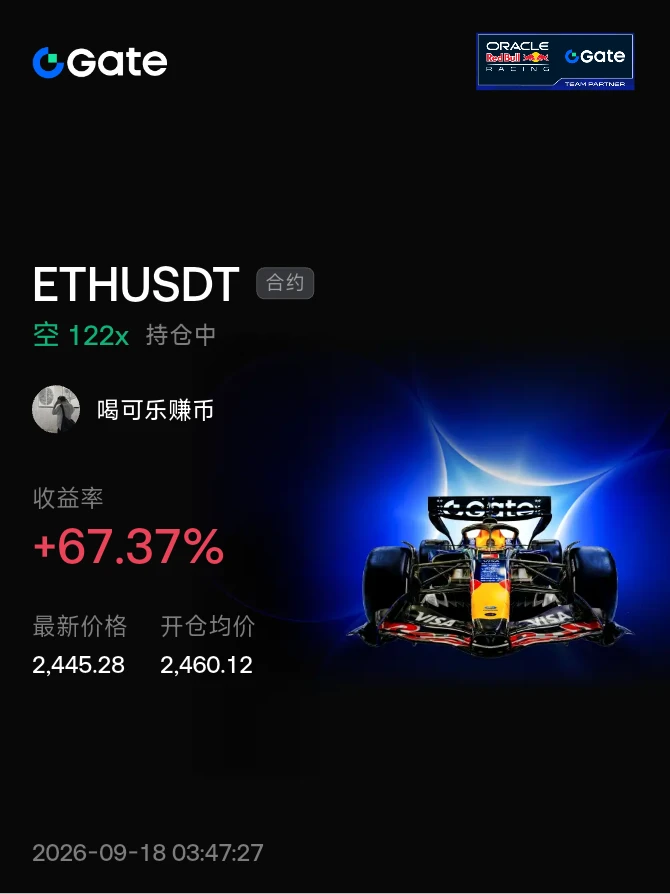
Today’s daytime livestream call identified a minor top, so everyone kept entering shorts around 81000. We caught an ETH short at 2529, and for gold we took the short at 4696 from yesterday’s subscriber update and the short at 4655 given during the livestream. The BTC subscriber update gave a short at 80900; watching the market, the 400-point rebound from 79000 should have provided an opportunity to move the stop loss to breakeven. The ETH afternoon subscriber update also gave a short at 2509. The long at 2480 was stopped out for an 8-point loss. Long around 2460. Bottom-fishing at 2440 was hig
ETH-0.49%
GLDX0.41%
PAXG-0.33%
BTC-0.08%
SOL1.81%
View Original
post-image
post-image
  • Reward
  • 1
  • Repost
  • Share
GateUser-7f912240:
How do I subscribe via Apple?
#SPCX
(SpaceX) | August 25, 2026
Price structure: SPCX is currently around $138, after opening near $137 and trading roughly between $136 and $140 today. The important detail is that price is recovering after yesterday's $135 close, but it is still sitting close to the IPO price rather than back near the much higher June levels. The current tape looks like a recovery attempt inside a volatile post-IPO consolidation, not yet a confirmed long-term reversal.
The weekly structure tells a more interesting story. SPCX closed at $136.97 on August 21, fell to $135 on August 24, and is now back aroun
SPCX1.50%
post-image
  • Reward
  • Comment
  • Repost
  • Share
$SOL Signal】1H Dip Reclaimed, Bulls Defend and Snipe
$SOL The $SOL
1H timeframe dipped to 96.17 before quickly reclaiming, with the current price at 98.08 and dense bids absorbing around 97.7. The 4H MACD histogram is -0.0880, with bearish momentum narrowing, while the 1H histogram also contracted to -0.4787. Price is above the 1H Bollinger lower band at 96.22, while the middle band at 99.48 is creating short-term resistance. Order book depth imbalance is 8.04%, the buy ratio is 1.17, and the funding rate is stable at 0.01%. RSI is 48.25 on the 1H and 62.65 on the 4H, with market sentiment ne
SOL1.80%
View Original
post-image
  • Reward
  • Comment
  • Repost
  • Share
With this trend, I don’t even need to think—the account is dancing on its own. 💃 While everyone was still watching from the sidelines, I stared at the market for a long while. The bottoming dragged on and made me sleepy, but it stubbornly held without breaking down, while buying interest kept quietly increasing. I thought, isn’t this basically handing me tokens? So I decisively opened a long and took a position. 😏
Now $XPL /XPL has risen from 0.08436 to 0.09357, delivering a +769.31% return. Feels good, brothers! This was a free win—really sluggish at first, but once it broke out, it felt ama
XPL-5.72%
XRP-2.52%
ETH-0.54%
View Original
post-image
  • Reward
  • Comment
  • Repost
  • Share
The 8.25 trading plan went very smoothly overall! The subscription updates indicated that shorting at high levels after the market topped would be profitable, and both the BTC 80,900 short and ETH 2,509 short generated substantial profits! Bitcoin gained 2,000 points and Ethereum gained 70 points! The long-held gold 4,696 short also gained nearly 100 points, while the SOL breakdown short is currently up 3 points. U.S. stock trading also went smoothly, with all positions in profit! Subscribe to 3gt and get on board now—let’s double our accounts together! #英伟达财报周
BTC-0.08%
ETH-0.49%
SOL1.81%
NVDA1.76%
View Original
post-image
post-image
  • Reward
  • Comment
  • Repost
  • Share
Retail investor: I trade weeklies on the Nasdaq $Q. Just need to read the short term move.
Me: Pull up the 5 day chart. What's the story there?
Retail investor: ...it's just noise. Up Monday, dumped Tuesday, bounced Wednesday.
Me: Right. Now pull up the 5 year. (screenshot below)
Retail investor: Oh. Up & to the right. Obviously.
Me: Same index. Two completely different games. One is unpredictable garbage. The other is companies earning more money every year & the share price following that.
Retail investor: So the week is random & the years aren't.
Me: Go buy a business in the real world and
NDAQ0.20%
post-image
  • Reward
  • Comment
  • Repost
  • Share
#BTC突破80000美元,能否站稳新关口
Focus on the current adjustment in BTC's 1-hour chart. The 15-minute chart within the 1-hour timeframe will determine how the 1-hour chart evolves.
1. If the price directly breaks above the zero line at this 15-minute level, the 1-hour chart will initiate a rebound. After the rebound begins, watch how far the rebound strength can take the 1-hour chart.
2. If the rebound momentum is insufficient at this 15-minute level and the price does not fall below $78,500, the 1-hour trend will continue to rebound. Then watch the rebound strength.
3. If the rebound at this 15-minute
BTC-0.13%
View Original
post-image
  • Reward
  • Comment
  • Repost
  • Share
I didn’t do anything—just went to the restroom, and when I came back, the K-line had already done the work for me. 🧐 Before the market had fully started, $ONDO was still grinding along the bottom. I checked that the pullback had held without breaking down, and buying pressure was also strengthening, so I added to my long position. When I came back from the restroom, it gave me the answer directly. That’s just how unreasonable K-lines are: when you watch them, they dawdle; the moment you walk away, they take off.

ONDO rallied from 0.3261 to 0.3719, with +678.33% in hand. Feels good, brothers
ONDO-2.35%
SOL1.80%
BNB-1.14%
View Original
post-image
  • Reward
  • Comment
  • Repost
  • Share
At the beginning of the rally, #Ethereum, which broke the downtrend before Bitcoin, has now also broken the 2400$ resistance. Looking at Bitcoin, it has a more bullish structure and can continue this rally up to 2950$. It will be important to hold the 2400$ level during this process. #ETH
Not investment advice.
BTC-0.08%
ETH-0.49%
View Original
post-image
  • Reward
  • Comment
  • Repost
  • Share
【$STAR Signal】Long + 1H breakout continuation
$STAR RSI 1H 71.04, price 0.1585, 1H breakout above the previous high on increased volume. The 4H MACD histogram is expanding, and the Bollinger Band upper rail at 0.1557 has been breached. Order book depth imbalance is -42.32%, with sell-side thickness dominant, but the price is holding above 0.156. OI is stable, and the funding rate at 0.0945% is near elevated levels, with no short squeeze triggered yet. The risk-reward ratio for chasing longs at this level is average, but the breakout structure is intact, so short-term sniping requires quick ent
BTC-0.08%
ETH-0.49%
SOL1.81%
ALIGN-9.60%
View Original
post-image
  • Reward
  • Comment
  • Repost
  • Share
🔥Before I knew it, my subscription has reached its 4th year. The year's lowest price of 5.5gt at half price ends tonight‼️ Both longs and shorts profited this month‼️ Ping guo can be accessed by clicking 👇
————————————————
🎉https://www.gate.com/zh/profile/Clear spring flows beneath the rocks
————————————————
🔥 Last week, going long at 62800/1865 and 81300/2545 brought in a big profit of 1.23 million
🔥 Shandi shorted at 1820 and covered at 1420, doubling the position and pocketing 970k
🔥 Went long at 75600/2350 yesterday, then at 81300/2530 today for another profit
#老用户重回瓜分1BTC
View Original
post-image
post-image
  • Reward
  • 10
  • Repost
  • Share
LoveDudu,LoveHealth:
Enter the market to buy the dip 😎
View More
Crypto Market Updates
gate liveLIVE
1,971
live-coin
  • Reward
  • 2
  • Repost
  • Share
CryptoMishu:
To The Moon 🌕
View More
- $ETC is holding around $7.91 after a strong move toward $8.10.
- Buyers are still showing decent strength near support.
- A clean break above $8.10 could open the way higher.
- Watch $7.82–$7.90 as key support.
- Stay patient and avoid FOMO while waiting for confirmation.
ETC1.63%
post-image
  • Reward
  • Comment
  • Repost
  • Share
#GateStockInsightsChallenge $SNDK
🚨 SNDK's correction is a test — and I am watching the buyers.
SanDisk has experienced another major pullback, closing August 24 at around $1,493.12, down 6.45%, after reaching an intraday low of approximately $1,416.56. The selloff spread across the memory-chip sector, making this much more important than a single-stock correction.
But my conclusion is different from simply calling the sector bearish.
I believe the market is currently testing whether the enormous AI-memory rally can justify its valuation.
SanDisk still has impressive fundamentals. FY2026 r
SNDK-0.27%
post-image
Yusfirah
#GateStockInsightsChallenge $SNDK
🚨 SNDK's correction is a test — and I am watching the buyers.
SanDisk has experienced another major pullback, closing August 24 at around $1,493.12, down 6.45%, after reaching an intraday low of approximately $1,416.56. The selloff spread across the memory-chip sector, making this much more important than a single-stock correction.
But my conclusion is different from simply calling the sector bearish.
I believe the market is currently testing whether the enormous AI-memory rally can justify its valuation.
SanDisk still has impressive fundamentals. FY2026 revenue reached around $20.25B, up approximately 175% YoY, while data-center revenue jumped 437%.
That gives the long-term story credibility.
But the chart is currently asking for patience.
My most important level is $1,400–$1,450.
If SNDK holds this area, forms a higher low and reclaims $1,500–$1,535, I would see the correction as potentially transitioning into accumulation.
Above $1,600, my bullish conviction increases.
My targets:
$1,650 → $1,800 → $2,000
If momentum becomes extremely strong again, I would reassess higher targets rather than blindly predicting them today.
My downside plan is equally clear.
If $1,400 fails decisively, I step back.
If the broader memory sector continues falling together, I reduce risk.
If buyers return, I scale in.
This is my experience-based approach: I don't need to catch the exact bottom. I need to identify a level where the potential reward is worth the risk.
So, is the SNDK drop an opportunity?
Potentially yes.
Is it safe to buy immediately?
No.
The opportunity becomes more attractive when support holds and the price confirms a recovery.
That is the setup I am waiting for.
My current sentiment:
Short term — cautious.
Medium term — cautiously bullish.
Long term — constructive on AI-driven storage demand.
SNDK remains one of the most interesting names in the memory-storage sector, but today's market is teaching us an important lesson:
A strong company can still be a bad trade at the wrong price.
I want the right company, the right level and the right risk/reward.
For me, the roadmap is clear:
$1,400–$1,450 support → $1,535 recovery → $1,600 breakout → $1,650 → $1,800 → $2,000.
Now I am waiting to see which side wins: the sellers defending the correction, or the buyers who believe the AI-storage story is still only getting started.
#MemoryStocks #StockInsights
repost-content-media
  • Reward
  • Comment
  • Repost
  • Share
XRP price forms bullish pennant after 51% rally, is $2 next?
XRP price consolidated near $1.48 on Aug. 25 after gaining about 51.5% in seven days, with its 4-hour chart forming a potential bullish pennant that could support another advance if buyers clear resistance near $1.56.
XRP price rallied from about $1.00 to an intraday high near $1.69 over seven days.
The 4-hour chart shows a bullish pennant, with price compressing between converging trendlines.
A confirmed break above $1.56 could expose resistance at $1.66, $1.76, and $1.86.
Liquidation clusters near $1.55 and between $1.42 and $1.45
XRP-2.50%
post-image
  • Reward
  • 3
  • Repost
  • Share
SIMSwapAlarm:
The move from $1 to $1.69 is already over 50%. It is now consolidating in a flag pattern. If you’re truly bullish, wait for the 4-hour close to hold above 1.56. The entire 1.66–1.86 range above is packed with short stop-loss orders. If price fails to break through, beware of a pullback to the liquidation cluster at 1.42–1.45, where wicks are likely.
View More
WLD 4H Chart Hides Danger; SHORT Signal Is Active

$WLD /USDT - SHORT

Trade Plan:
Entry: 0.3920 – 0.3962
SL: 0.4142
TP1: 0.3791
TP2: 0.3690
TP3: 0.3540

Why watch this setup?
- WLD is currently priced at 0.3941, in a 1D range, with bearish momentum prevailing on the 4H.
- The 15-minute RSI is only 39.11; the market is not yet oversold, so room remains to the downside.
- Key levels: A break below 0.3920 would accelerate the move, while TP1 at 0.3791 is the first gate.
- Why now? The range is nearing its end, the 4H direction is turning downward, and SL 0.4142 provides a clear risk boundary.
WLD-2.80%
View Original
post-image
post-image
  • Reward
  • Comment
  • Repost
  • Share
SanDisk analysis in the early hours of the 26th
SanDisk weakly rebounds amid capital outflows; the rebound is fake, while a bull trap is the real move
Personal suggestion: Short around 1520, stop-loss at 1540, target 144-147
SNDK-0.27%
View Original
post-image
  • Reward
  • Comment
  • Repost
  • Share
HOT TOPIC PREDICTION
gate liveLIVE
1,378
live-coin
  • Reward
  • Comment
  • Repost
  • Share
Had the major monthly Alt refresh yesterday..
56 in the database..
2 removed..
3 Rated Top...
ALT-2.19%
post-image
  • Reward
  • Comment
  • Repost
  • Share
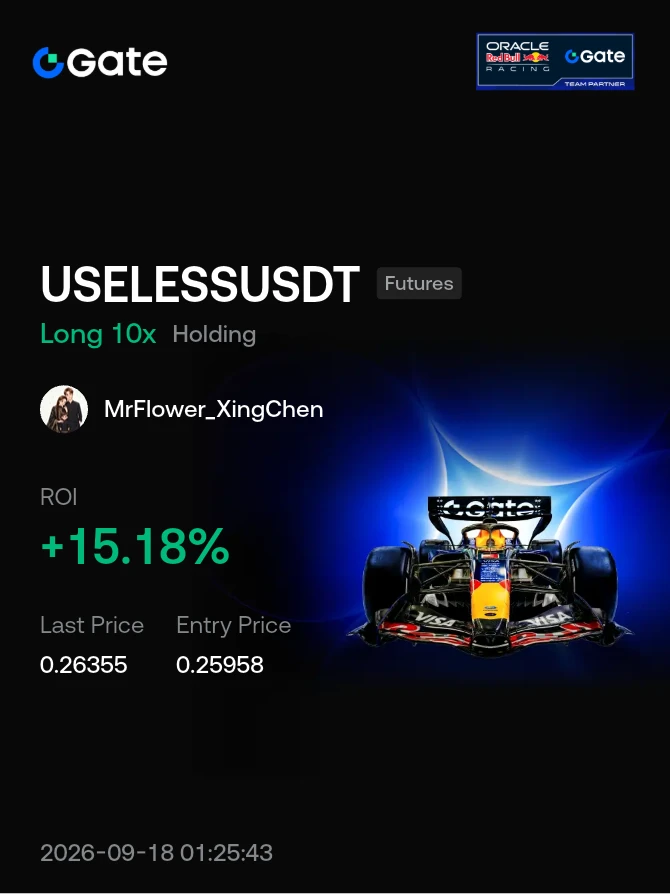
How is this a rebound? This is CPR for my empty account, isn’t it? A few days ago, I deliberately took one last look at the chart before bed. $NIL Every push upward kept falling just short, while selling pressure grew heavier and heavier—a classic price-volume divergence. I already knew then: don’t rush to enter; wait a little longer.
When I opened my eyes this morning, I had my answer. The short position opened at 0.07288 is now at 0.04168, with unrealized gains of +2061.64% on paper. This is one satisfying meal. 🔥
First close 80% and pocket the profits. Move the stop-loss on the remaining 2
NIL-3.85%
BTC-0.13%
ZEC-3.12%
View Original
post-image
  • Reward
  • Comment
  • Repost
  • Share
Load More

Join 40 M users in our growing community

⚡️ Join 40 M users in the crypto craze discussion
💬 Engage with your favorite top creators
👍 See what interests you
  • Pinned