

Square
Following
Hot
News
Notifications
Profile
Share your thoughts
placeholder
Article
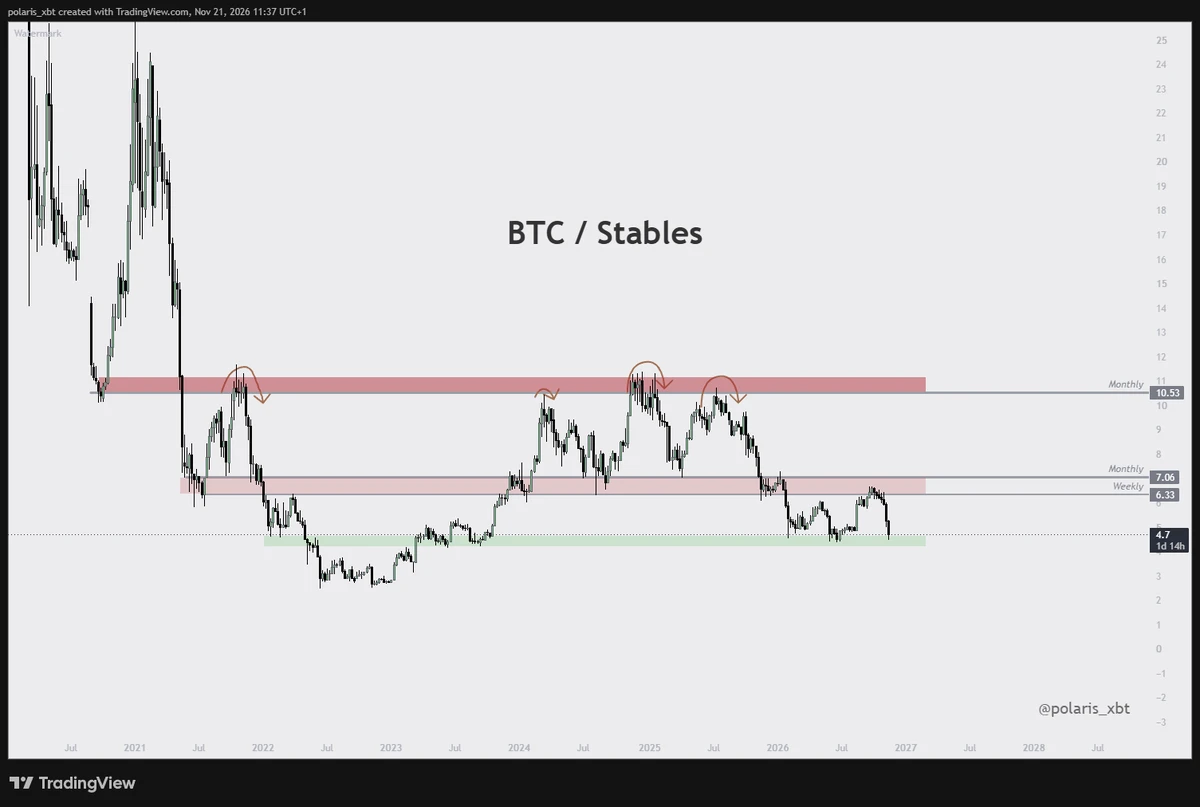
$BTC vs Stables
Divide BTC market cap by stablecoin market cap and you get this chart.
▫️ We're at big support, the same level that marked prior lows
▫️ We essentially had a triple top
▫️ Why couldn't we have a triple bottom?
post-image
BTC-0.67%
  • 2
market prediction
live-cover
LIVE1,974
BTC-0.67%
SOL-0.77%
XRP-1.15%
USDC+0.01%
HYPE+0.24%
Trenches
FIONA
F
bade
b
FIONA
B34n...pump
Market Cap
$.
Change
.
24h Vol
$.
Holders
.
PIEVERSE
P
bade
b
PIEVERSE
0x0e...25a9
Market Cap
$.
Change
.
24h Vol
$.
Holders
.
mihao
m
bade
b
mihao
4Cxj...pump
Market Cap
$.
Change
.
24h Vol
$.
Holders
.
CLAUDIA
C
bade
b
CLAUDIA
2j5S...W2ZM
Market Cap
$.
Change
.
24h Vol
$.
Holders
.
IDOL
I
bade
b
IDOL
0x3b...ab07
Market Cap
$.
Change
.
24h Vol
$.
Holders
.
CRYPTO MARKET UPDATE
live-cover
LIVE1,802
BTC-0.67%
Isn't this performance pretty good? It perfectly captures CZ's sinister, treacherous, hypocritical, and shady nature.
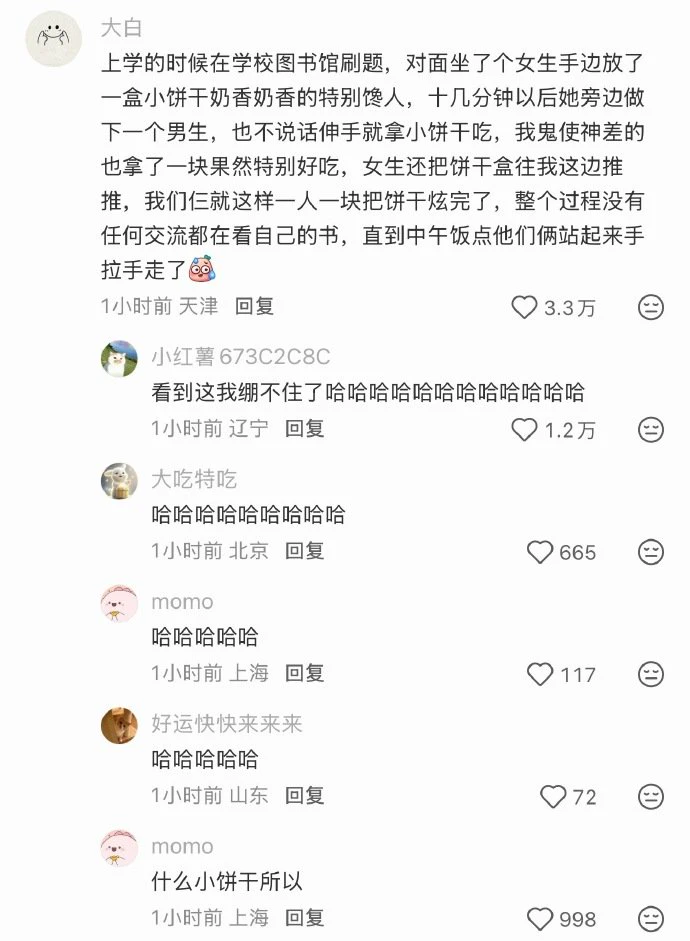
What brand are those little cookies? I want to try them and see how good they are.
post-image
#英伟达单日重挫近14% If I could choose just one metric to judge whether AI stocks are worth repositioning in, I’d look at AI investment returns and free cash flow. It best answers the question: “Has the money burned turned into real cash?”

Why this metric
· Revenue growth can be misleading: Nvidia’s third-quarter revenue grew 103% year over year, yet its stock still fell for consecutive days. No matter how many orders there are, they have to translate into profits and cash.
· Free cash flow is the most honest measure: it’s the money earned from operations, minus spending on data centers and equipment
post-image
NVDA-13.84%
  • 4
Someone told me a 16% drop means the chart pattern is broken. I replied: before deciding whether the pattern is broken, you have to look at where it fell. $SOXS is now at 81.3, with a 24-hour high of 85.03 and a low of 66.24, swinging by more than 20 points, with trading value of 2.598 billion. With volume like that, it’s not retail traders messing around.
My rule is: First, look at where it fell—is it an area that’s been tested repeatedly before? Only areas that have been tested count as levels; everywhere else is just passing through. Second, see whether the move played out in a single day.
  • 3
$ETH This sharp drop formed a long lower wick, with buyers stepping in at the low. It looks like panic selling flushed out leverage, followed by a quick recovery of part of the losses. The 1-hour chart is oversold, and shorts are crowded in the short term, making this a good setup to play an oversold relief bounce. The wick low is the support level to defend; as long as it doesn’t break below that low again, there’s a chance of a rebound. Long!⬇️⬇️⬇️$BTC
post-image
BTC-0.67%
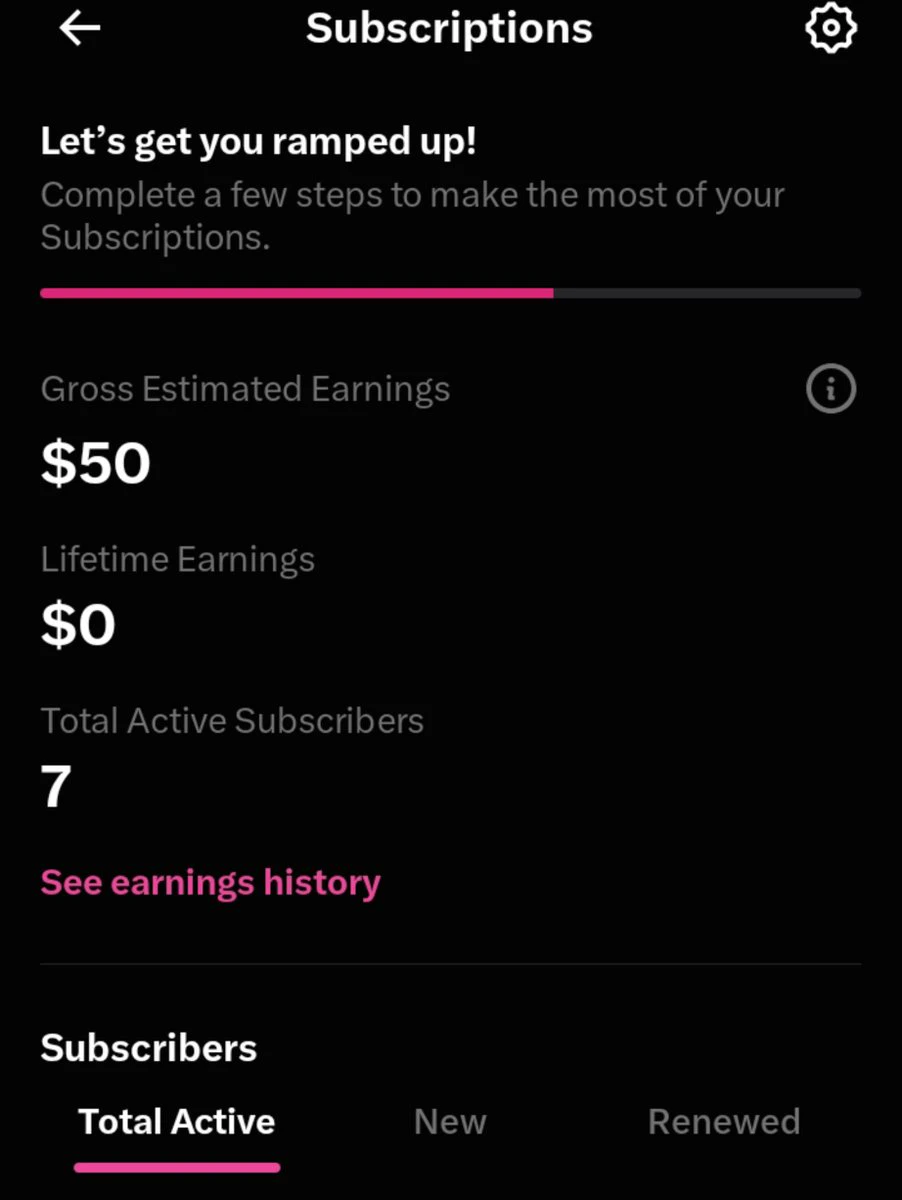
New Subscriber 👨‍🍳♥️ thank you for your Support
post-image
#BTC跌破6万美元关口 #作手分析
🔥 BTC hits a new low, falling to $55,123! The 411-day bear market has entered a key window, and the trader believes it’s time to buy spot in batches!
Trading focus: $BTC $ETH $SOL

BTC has once again set a new low for this bear market!

On November 21, BTC fell below the $57,813.4 low set on July 1, reaching a low of $55,123, while market sentiment remained in extreme fear.

Since its all-time high of $126,193 on October 6, 2025, this correction has lasted 411 days, with a maximum drawdown of about 56.3%.

How much longer will this bear market last?

I. The historical p
Do you think BTC's current bear market is nearing its end?
A. Spot buying the dip begins in batches
B. Buy after the weekly chart stabilizes
C. The bear market is not over; it will make new lows
D. Continue to wait and see, and await confirmation
40 Participants
Ends In 8 Day
BTC-0.65%
ETH-1.23%
SOL-0.74%
  • 6
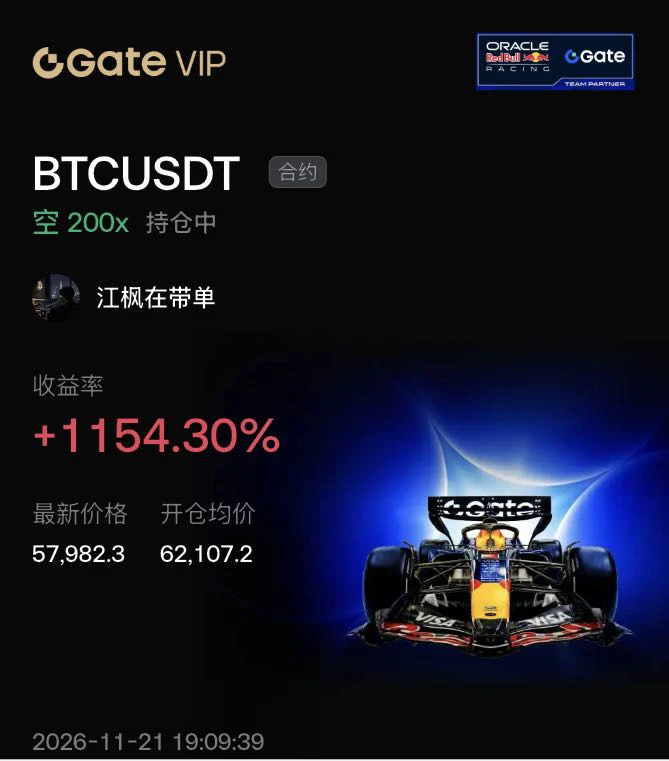
$BTC Bitcoin faces huge selling pressure! Will bears push BTC below $56,000? Trading strategy: Short entry range: $57,900–$58,100 Take-profit 1: $57,000 Take-profit 2: $56,000 Take-profit 3: $54,821 Stop-loss: $59,500 After falling more than 6% in 24 hours, Bitcoin remains under heavy bearish pressure. The price is struggling below the $58,700–$59,450 resistance zone. A confirmed break below this range could trigger another strong sell-off, pushing it toward lower support levels. Trade here $BTC 👇
post-image
BTC-0.65%
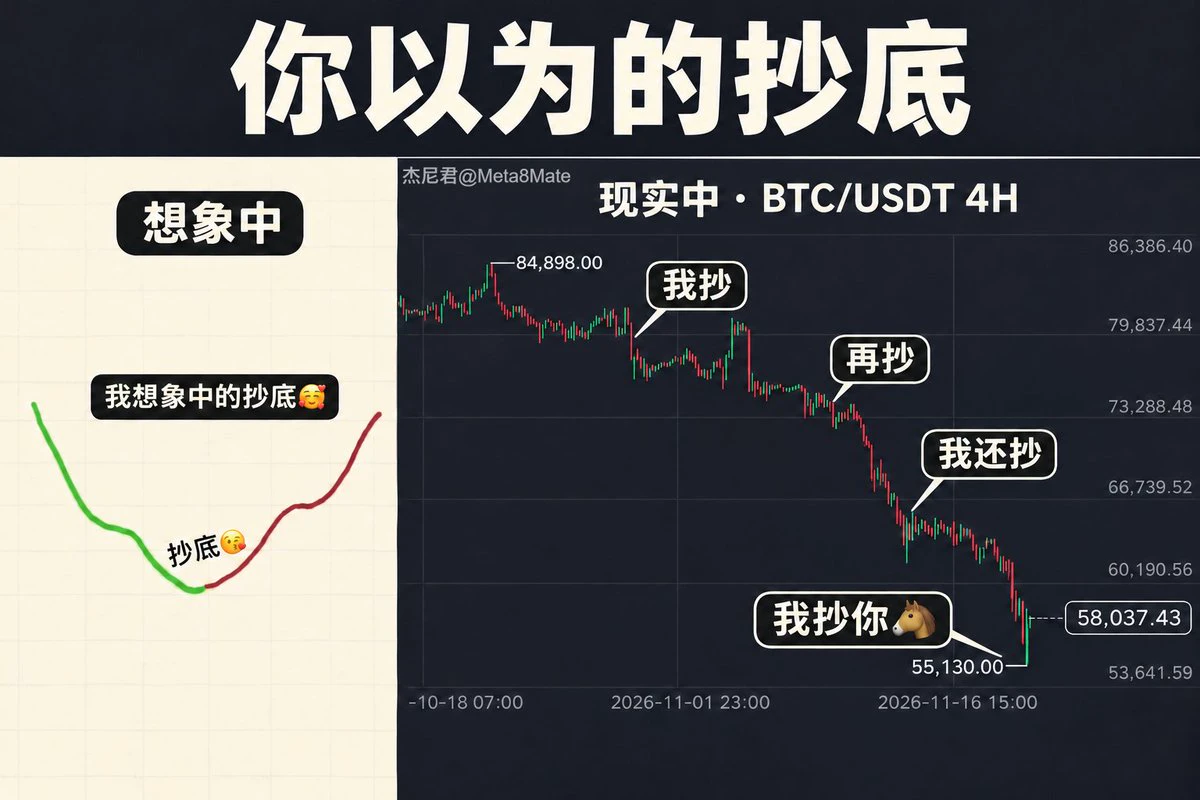
This downturn,
retail investors be like:
post-image
#BitcoinUnderPressure: Can BTC Recover or Is More Downside Ahead?
Bitcoin (BTC) is facing intense selling pressure, with its price currently trading around $57,800–$58,000, according to the latest available market data on November 21, 2026.
The recent decline reflects growing uncertainty across global financial markets, rising Treasury yields, concerns about Federal Reserve policy, and weakening investor confidence in high-risk assets. Bitcoin has also experienced significant liquidations, increasing short-term volatility.
What Comes Next for Bitcoin?
In the short term, BTC could test the $55,
BTC-0.67%
  • 3
Bitcoin $BTC has fallen this far, but the biggest players are still in ETFs.

On November 20, IBIT alone saw $541 million in outflows, its largest single-day outflow since the fund launched in 2024. All Bitcoin ETFs combined saw $582 million in outflows that day. Cumulative outflows in November reached $2.9 billion, and net outflows for the year have exceeded $3 billion.

Retail panic comes in waves, but institutions pulling out continuously creates structural selling pressure. Every time prices try to rebound, redemption orders push them back down.

One other interesting thing: Anthropic’s I
post-image
BTC-0.65%
ETH-1.23%
  • 1
Long $IDOL price has broken above the consolidation range (BOS), is above all EMAs, and remains in an uptrend. Prioritize going long when price pulls back to the support area. Entry 1: 0.02320 – 0.02380 Entry 2: 0.02240 – 0.02320 Entry 3: 0.02170 – 0.02240 Take profit 1: 0.02688 Take profit 2: 0.02913 Take profit 3: 0.03098 Stop loss: 0.02145 Note: This is a reference plan based on the chart provided. If the price breaks below the 0.02145 support level, Entry 3 may become invalid; all three orders should not be opened simultaneously without managing the total risk.
post-image
IDOL-6.71%
🔥🔥🔥 Hot, hot, hot 🚨🚨🚨$Lobster market remains weak, but has seen a slight rebound; there are gains and losses, and short-term swing trading looks decent, so you can gradually start shorting with a small position. $PIEVERSE has reached Alpha level, and the price may see a rally, making it seem like a good opportunity for a swing long. $BTW seems to be showing signs of a gradual, slight decline, so you can gradually shift to shorting. 📈📈📈
post-image
PIEVERSE+0.58%
BTW-7.42%
The meaning of life is to feel good!
It doesn’t matter whether you’re poor or rich. If you want to enjoy life, you can do this. Get your priorities backward, and you’ll suffer.
post-image
Load More

Join 40 M users in our growing community

⚡️ Join 40 M users in the crypto craze discussion

💬 Engage with your favorite top creators

👍 See what interests you

Trending Topics

BTCBreaksBelow60K

2.1M Views29.4K Discussing

BTC fell below $60,000 on November 20 for the first time since July, alongside a tech stock selloff and broader pressure on risk assets. Will $60K become resistance, or can BTC quickly reclaim it? What price or volume signals would convince you that selling pressure is easing?

GateDirectIPOPhase3ANTAllocates92100Shares

754.6K Views4.8K Discussing

NvidiaDropsNearly14Percent

316.8K Views7.5K Discussing

View More