






Square
Following
Hot
News
Profile
Share your thoughts
placeholder
Article
The more gold prices fall, the more aggressively China buys. From March to July, its purchases rose from 4.98 tons to 19.91 tons. This isn’t bottom-fishing; it’s welding a floor under gold prices. Ahead of the Fed decision, the market is already pricing in expectations. True liquidity providers only watch who is quietly absorbing the supply. Those holding gold should weigh this for themselves. If you have anything to add, see you in the comments.
post-image
GLDX+1.96%
PAXG+1.38%
Careful, @crocat_x is an impersonator and most likely a rug!
Report.
The official crocat:native X is @CroCat_Token with CA 0x7Eb480c734eC5f6bd2B918F7393b59D59913DFFA
This is a good reminder as Cronos is getting more succesful, rugs and rats are also coming back.
Invest with eyes open, very easy to run in to these!
post-image
CRO+0.31%
$ICNT Up 21% in half a day, it surged straight from 0.1015 to 0.1371, with 13.7M in trading volume pouring in. That’s not the kind of volume retail investors can generate. I took a quick look on-chain just now: the top 10 addresses’ holding concentration hasn’t declined, indicating this move is not distribution but someone accumulating. On the macro side, here’s an anchor: during the week when the Fed minutes leaned hawkish, the 30-day correlation between altcoins and the Nasdaq surged to 0.78. Small-cap assets like ICNT have higher beta, so as long as rate-hike expectations don’t rebound, it
ICNT+23.90%
US economic data delivered a clear message: inflation is running hotter than expected, yet consumer demand and parts of the manufacturing sector remain surprisingly resilient.
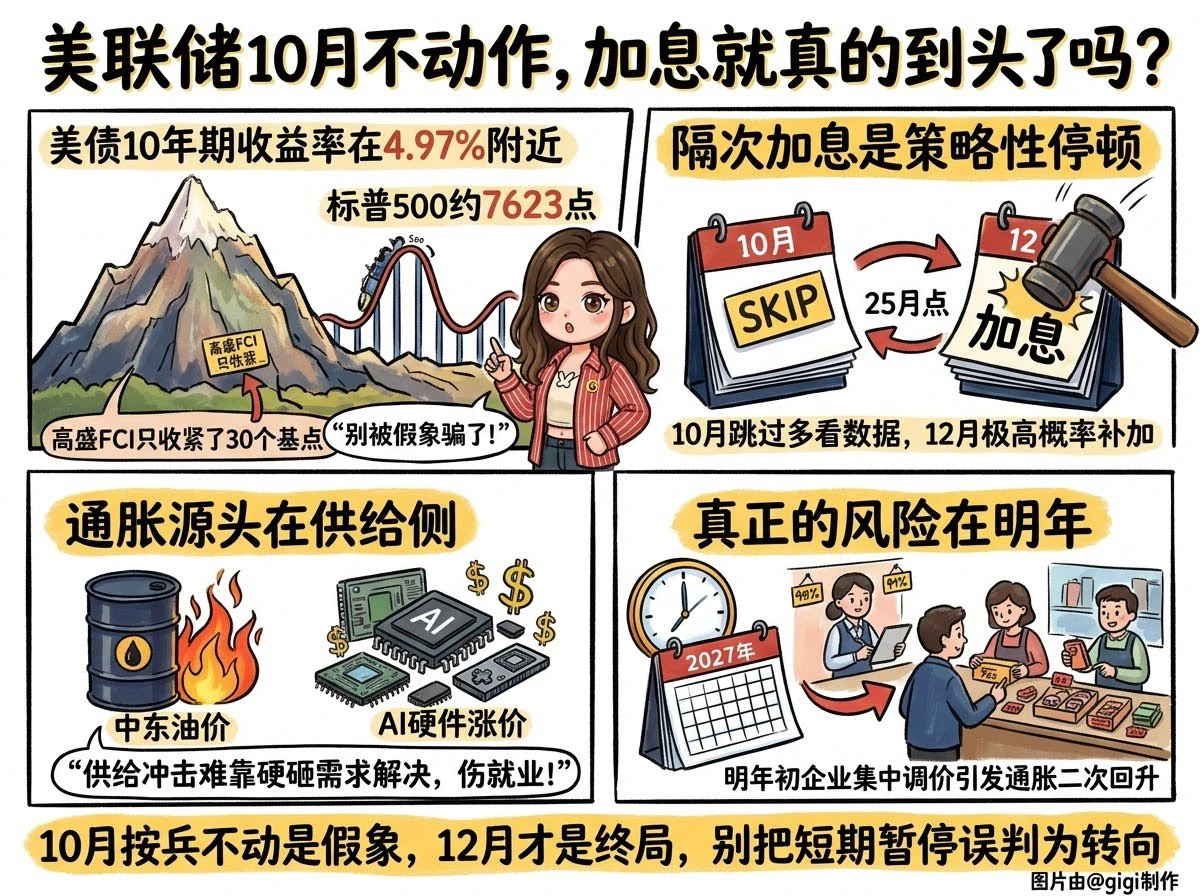
🔹 This combination creates a difficult position for the Federal Reserve. After Wednesday's above-forecast CPI, today's producer-level data reinforced the case for rates staying higher for longer.
📊 The data on the table:
🔹 Core PPI: +0.7% MoM (forecast: +0.3%). The largest monthly increase since March 2022.
▪️ Headline PPI: +1.3% MoM (forecast: +0.6%), +6.3% YoY (forecast: +5.3%). The highest annual reading since Dece
post-image
User_any
✨ US equity futures traded mixed on October 15 as technology and AI-related stocks faced renewed pressure.
🔹 Futures tied to the tech-heavy Nasdaq 100 fell about 1.2%, while S&P 500 futures slipped 0.3%. Dow Jones Industrial Average futures held relatively firm, trading slightly positive. The divergence reflects a selective risk rotation rather than a uniform selloff.
📊 The data behind the market's sharp reaction:
🔹 Inflation pressures are broadening
▪️ US September PPI rose 1.3% month-over-month and 6.3% year-over-year, far exceeding the 5.3% forecast and marking the largest annual increase since December 2022.
▪️ Core PPI, excluding food and energy, rose 0.7% MoM and 5.0% YoY, also above expectations.
▪️ The September CPI report released a day earlier showed headline inflation accelerating to 3.7% YoY, with core CPI at 2.6%.
▪️ Energy prices surged 10.8%, accounting for over 80% of the goods price increase, with gasoline jumping 20.3%.
🔹 AI and semiconductor stocks face a reality check
▪️ Memory chip names continued to slide, with Micron down about 4% and AMD falling roughly 3.5% premarket. CoreWeave dropped another 5% after plunging 15% on Wednesday.
▪️ Investor concerns focus on whether the massive capital expenditures required for AI data centers will generate sufficient returns, particularly as debt-financed expansion raises sustainability questions.
▪️ Reports of progress by China's CXMT on next-generation DRAM technology have also pressured memory stocks by raising competitive concerns.
🔹 TSMC's cautious 2027 guidance amplifies uncertainty
▪️ TSMC reported its sixth consecutive quarter of record profit, with net income up 69% YoY to NT$763.1 billion. It raised its 2026 revenue growth forecast to approximately 44%.
▪️ However, CEO C.C. Wei struck a cautious tone on 2027, citing macroeconomic uncertainties and rising component costs affecting price-sensitive end markets.
▪️ The cautious outlook, despite strong AI demand, reinforced concerns about future growth visibility across the semiconductor supply chain.
⚖️ Structural perspective:
🔹 From a long-term structural perspective, the current market dynamic reflects a recalibration of valuations rather than a deterioration in underlying industrial demand. TSMC's cautious 2027 planning is best understood as prudent expectation management amid macro uncertainty, not a signal of weakening AI fundamentals.
▪️ The transmission chain from energy costs to broader pricing is becoming clearer: crude oil → gasoline → transportation and warehousing services → wholesale and retail margins. This broadening inflation narrative keeps the Fed's restrictive policy path in focus, pressuring high-duration growth assets.
▪️ Meanwhile, capital is rotating defensively — into Treasuries and dividend-paying instruments — rather than exiting risk entirely. The 10-year Treasury yield dropped sharply to around 5.05%, a three-week low, reflecting strong safe-haven demand.
▪️ Bitcoin fell to near $80,500, down about 3.6% over 24 hours, with market-wide liquidations approaching $977 million, predominantly from long positions. The $80,000 level remains a critical support zone to watch.
▪️ Gold recovered above $4,150, up over 1.3%, as falling yields and a softer dollar supported precious metals despite the hot inflation print.
▪️ The dollar index retreated from its 18-month high toward 102.0, giving back most of its post-CPI gains as rate-hike expectations eased slightly.
🔹 The key variable ahead is whether the Fed signals patience at its October 27-28 meeting or adopts a firmer tone. Markets currently price roughly a 49% probability of an October hike, up sharply from about 22% before the CPI data. Until that guidance arrives, markets are likely to remain in a selective recalibration phase.
💬 When inflation pressures broaden beyond energy and AI valuations face scrutiny, do you prioritize defensive positioning or long-term structural exposure? 👇
#USStocks #Inflation #USSeptemberPPIBeatsExpectations
#美国9月PPI大超预期 #USSeptemberCPITopsEstimates
Not financial advice.
repost-content-media
BTC+0.30%
ETH+1.38%
XAU+1.54%
XAG+3.23%
XRP+0.90%
  • 5
  • 4
Gold has climbed back above 4150, while silver is hovering around 57. The dollar has weakened, and Treasury yields have pulled back a bit too.
But don’t celebrate too soon. Oil prices are still rising, and inflation hasn’t gone anywhere. This rebound looks more like a breather than a turnaround.
What I’m watching is whether gold can hold above 4150 if oil surges again next week.
If you see it differently, tell me why.
post-image
GLDX+1.96%
PAXG+1.38%
Bitcoin is BACK over $82,000!!
We are so back!!
post-image
BTC+0.30%
$XPL #XPL
Rising towards resistance of symmetrical triangle.
Breakout could follow our projection for a solid bullish rally✍️
XPL+7.58%
  • 1
Intraday, Ethereum pulled back toward around 2480, hitting a low of 2322 before recovering and rebounding, but the broader bearish trend remains unchanged. The rebound is only a brief bounce during the decline, with clear overhead selling pressure.
From the current chart, the main bearish structure on the daily timeframe remains intact. This rebound is merely a brief recovery after the rapid dip, while MACD remains bearish.
On the 4-hour timeframe, the price has risen close to the upper Bollinger Band, while bullish momentum is gradually fading and the rebound is weakening. On the 1-hour timef
post-image
ETH+1.38%
before you ask me
were you invit...
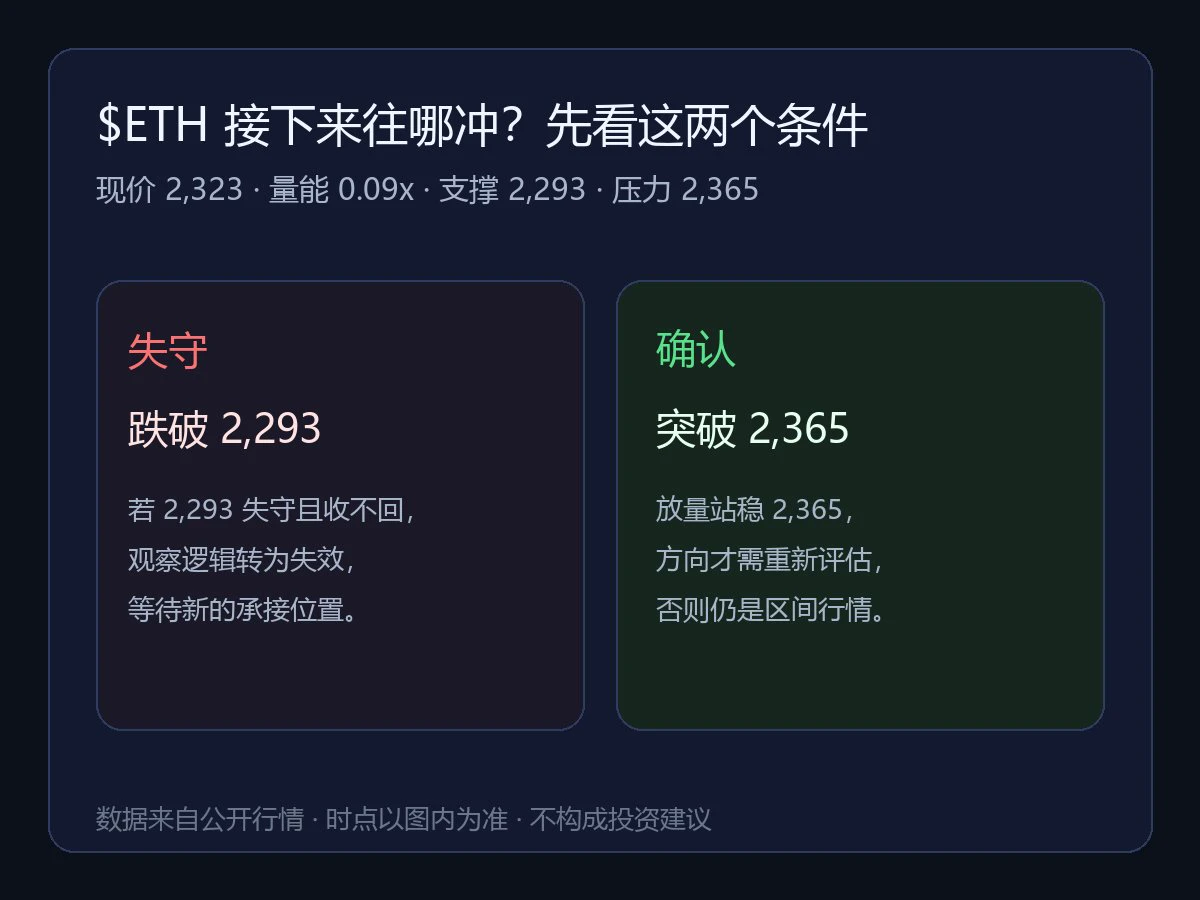
I turned off the $ZEC gainers-and-losers rankings first, and only one issue is left on the chart: $ZEC remains strong, while the crowded positioning is already out in the open.
$ZEC is currently at 1,241.91, up 8.09% over 24 hours. The 1-hour support is 1,075, resistance is 1,248.4, and current volume is 0.55 times the average volume of nearly 20 candles.
My view for now is this: I acknowledge that the trend is strong, but what matters next is not how much higher it can go, but whether anyone steps in during the first pullback. Moving higher does not count as a win just because it touches 1,2
post-image
ZEC+8.67%
Bullish on $SOCKS
post-image
US oil is pumping
And you still believe in the BTC pump?
BTC+0.30%
2026 Topps Update has been out for ONE DAY and people have already found two major player identification errors.
1) Kevin McGonigle’s Black Gold rookie insert features Jace Jung photo instead of McGonigle.
2) The Detroit Duo card appears to feature the wrong player labeled as Gleyber Torres.
How does @Topps let something like this get through quality control?
Layout: Bitcoin, Ethereum, Dogecoin
live-cover
LIVE880
  • 4
[New Streamer] Whales Moves in Sync!
live-cover
LIVE1,016
An unpopular take: $INJ ’s current +10.99% gain is not as conclusive as it looks.
$INJ is currently at 8.423, up +10.99% over 24 hours. The 1-hour support is 7.061, resistance is 8.562, and current volume is 0.77 times the average volume of the past 20 periods. What is truly useful in these numbers is where 7.061 and 8.562 are containing the range.
This is where I currently stand: I acknowledge that the trend is strong, but what matters next is not how much higher it can surge, but whether buyers step in during the first pullback. The 1-hour trend is strong, with an RSI of 86; the 4-hour trend
post-image
INJ+10.47%
BREAKING: Centrifuge tokenizes New York Life Investment Management's actively managed U.S. high-yield corporate bond strategy as $HYB on Stellar.
Allowing the freely transferable $deHYB token to serve as collateral across lending and fixed-rate markets in DeFi.
@StellarOrg
CFG-4.76%
XLM+0.38%
We could have been a beautiful combo, you and I...
post-image
In 2006, bored out of my mind, I went online for the first time and casually bought 1,000 Bitcoin.
Back then, Bitcoin was worth jack shit, so I just treated it like in-game currency.
post-image
BTC+0.30%
Load More

Join 40 M users in our growing community

⚡️ Join 40 M users in the crypto craze discussion

💬 Engage with your favorite top creators

👍 See what interests you

Trending Topics

USSeptemberPPIBeatsExpectations

91.35k Views1.88k Discussing

US September PPI came in at 6.3% YoY, well above the 5.3% market expectation, pointing to renewed producer-side inflation pressure. Weekly jobless claims were 199K, broadly in line with forecasts. Could hotter inflation further reduce room for rate cuts, and what does it mean for $BTC, US stocks, and gold?

DrLinHanSpeaksAtOxfordUnion

135.63k Views1.86k Discussing

JapanAndKoreaStocksPlunge

47.27k Views1.76k Discussing

View More