Square
Following
Hot
News
Profile
Share your thoughts
placeholder
Article
US Initial Jobless Claims
live-cover
LIVE1,564
$BTC Bitcoin At $82,400: Breakout Loading Or A Bear Trap
BTCUSD Perpetual Futures | 1-Hour Chart | October 16, 2026
Bitcoin has staged a sharp recovery from the $79,800 region, but the price is now consolidating around a critical decision zone near $82,400–$82,420. The next move may depend on whether buyers can defend this level and push toward overhead resistance—or sellers regain control.
Bullish Setup — Buy on Confirmation
Trigger: sustained move above $82,420–$82,500, followed by a successful retest.
- Target 1: $83,025
- Target 2: $83,825
- Target 3: $84,687
Bearish Setup — Sell on Brea
post-image
BTC+0.61%
#美国9月PPI大超预期 #每周来晒 September PPI Surges to Four-Year High—Will the Fed Take Drastic Action in December?
Following Wednesday’s hotter-than-expected CPI, the PPI once again confirmed mounting inflationary pressure. U.S. PPI rose 6.3% year over year in September, far above the expected 5.3%, marking the largest increase since December 2022; it rose 1.3% month over month, also well above the expected 0.5%, marking the largest increase since March 2022. Core PPI, excluding food and energy, was also strong. It rose 5% year over year and 0.7% month over month, both above expectations.
Energy Drives P
GAS+0.77%
CME+1.39%
C+0.76%
Guys, look at the chart for $METAX —it’s basically a “roller coaster” heart-pounding ride. Just a few candid thoughts:
1. News-driven hype drew a door: The chart shows the news “Meta launches Muse Spark Open.” This move from 710 to 773 was purely an emotional reaction to the news. Veteran bagholders know that once bullish news becomes reality, it often marks a temporary top. Whatever goes up that way can come crashing down the same way, taking you straight back to 715.
2. The current 735 is an awkward spot: After dropping nearly 8%, it is now consolidating and recovering around 735 on declinin
post-image
METAX+1.12%
  • 2
  • 2
Good morning, $DOGE family! ☕️
Gm C X 👊📉
Happy Friday! 🙌🌞
Dogecoin to the moon! 🐕🚀🌙
post-image
DOGE-0.29%
10.16 Friday morning market overview: BTC M-top correction complete
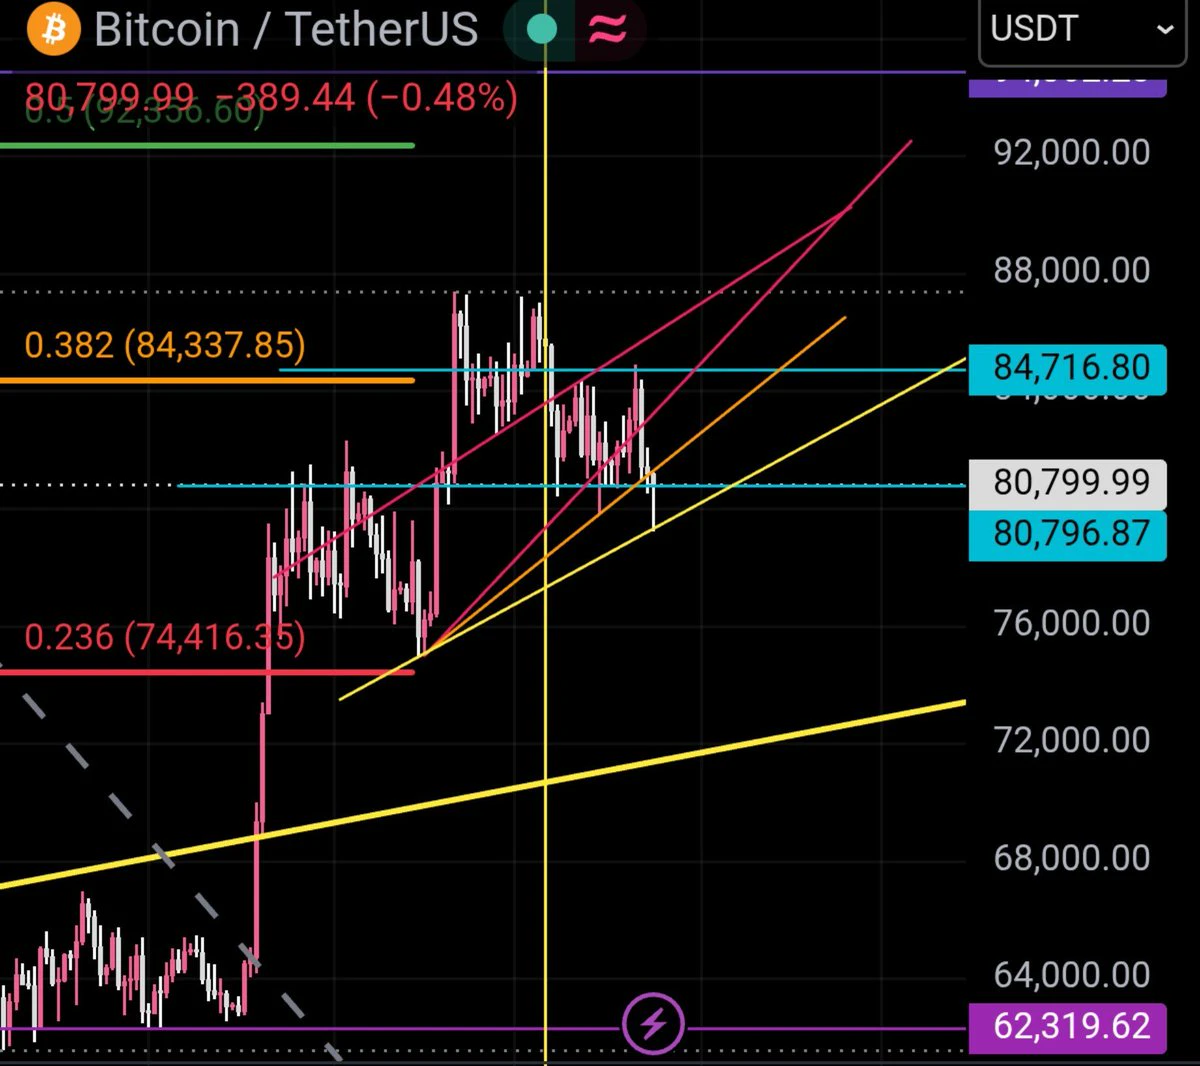
BTC formed a long lower wick and a small-bodied bullish candle this morning, with the market difficult to read
Last night, affected by the PPI data, BTC wicked down to 7.97, breaking below the previous low of 8 before this rebound;
After the data was released, total liquidations across the network over 1H reached $476 million, with long liquidations accounting for as much as $457 million, mainly concentrated in ETH and BTC
When news-driven moves quickly wick downward and then rebound, the purpose is to liquidate bo
post-image
BTC+0.61%
  • 7
Congrats on making money—you cleaned up on both longs and shorts
This early in the morning, am I seeing things?
Looks like my perspective still isn’t broad enough.
post-image
Wow, weren’t Huang Zitao and Xu Yiyang just putting on a show this whole time?
It feels like they update videos every day, yet I’ve never seen Xu Yiyang looking pregnant—how come their child is suddenly already this big
post-image
Most funds are betting that BTC will hold above $85,000 in October, and this expectation is already fully priced in, leaving limited room for upside speculation.
A breakout above $87,500 and a deep drop to $77,500 offer better odds, representing moves that deviate from mainstream expectations; when the market is unanimously bullish, beware of reversal risk if expectations fail to materialize.
post-image
BTC+0.62%
$SNDK
Is it forming a triangle consolidation or a double top? That’s the million dollar question. Even if we don’t know the answer, we can make decisions based on the possibilities. We’ll find out soon
post-image
SNDK-0.56%
According to Jin10 Futures on October 16, overnight crude oil prices remained volatile in a high range, while fuel oil costs improved amid steady demand from refineries for secondary raw materials. Processors showed reluctance to sell at lower prices, indicating firm market support for fuel oil
post-image
#每周来晒
When I look at inflation data, I don't focus only on whether the number goes up or down. I want to understand what is driving the move, how the Federal Reserve might interpret it, and what the market could do next. September's US PPI gives us a good reason to look beyond the headline.
US producer prices rose 1.3% month over month in September, significantly above the approximately 0.6% increase expected by the market. Annual producer-price inflation accelerated to 6.3%, compared with 5.6% in August. That's a meaningful surprise, and it puts the inflation outlook back under pressure.
The
post-image
BTC+0.62%
GAS-0.41%
  • 1
$GRASS BOOM is about to explode, the pullback is over, liquidity is returning, continue to take off🤩
Go long now🔥🔥Target 1: 0.69 Target 2: 0.72 Target 3: 0.77 Stop-loss: 0.632$AG $SIREN
CPIWatch
post-image
SIREN+26.32%
  • 1
Breaking 🚨Morgan Stanley predicts that quantum computing could grow into a $100 billion industry 🚀This prediction reflects accelerating research breakthroughs and continued growth in corporate investment. Quantum hardware suppliers are competing to increase the number of qubits, while financial companies are optimistic about its unprecedented data-processing capabilities. If this prediction becomes reality, the field could reshape everything from cryptography to artificial intelligence 🔥Stay tuned for further developments 📈$BA, $ZRO , $AGT
post-image
BA+2.19%
ZRO+14.64%
AGT+101.31%
Gold’s first win of the day
Short at 4157, exited at 4150, 7 points, 972🔪$XAUT
post-image
XAUT+0.40%
Altcoins Under Pressure! Is Bitcoin Dominance Set to Rise?
live-cover
LIVE2,060
$PI Still weak as hell—it can't even break through the 4-hour timeframe, let alone the higher timeframes. Don't expect it to recover within 3 years; it'll be good enough if it can finish the mapping.
PI+1.56%
  • 3
Touched 1253.76 and pulled back again—just missing that final push?
$ZEC Here’s the move from overnight, laid out by time
20:00 Dipped to 1065.5, with volume nearly three times the previous candle
23:00 A candle at 1180.15, with the strongest volume of the rebound
05:00 Touched a high of 1253.76, then pulled back from the long upper wick
Now stuck at 1221.5, moving sideways on declining volume
Two hurdles above: 1253.76 and 1285.14
One line below: the 20-day moving average at 1160.65
Scenario one: Only a high-volume reclaim of 1253.76 creates a chance to break through 1285.14
Scenario two: If
post-image
ZEC+7.83%
  • 1
Does the Grok Bot with a badge seem unusable?
Can only Bots that you subscribe to yourself be used?
Load More

Join 40 M users in our growing community

⚡️ Join 40 M users in the crypto craze discussion

💬 Engage with your favorite top creators

👍 See what interests you

Trending Topics

USSeptemberPPIBeatsExpectations

91.35k Views1.9k Discussing

US September PPI came in at 6.3% YoY, well above the 5.3% market expectation, pointing to renewed producer-side inflation pressure. Weekly jobless claims were 199K, broadly in line with forecasts. Could hotter inflation further reduce room for rate cuts, and what does it mean for $BTC, US stocks, and gold?

DrLinHanSpeaksAtOxfordUnion

135.63k Views1.86k Discussing

KOSPIJumps3.3%

47.29k Views1.87k Discussing

View More