Square
Following
Hot
News
Profile
Share your thoughts
placeholder
Article
$ORCA Conclusion first: bearish in the short term; rebounds are opportunities to short, but do not chase shorts—wait for a rebound.
From a fund-flow perspective, ORCA fell 17.09% over 24h, with a trading volume of only 13.7M USDT, indicating a decline on shrinking volume. However, the funding rate is -0.0392%, meaning shorts are paying longs, which shows that short-side positioning in the derivatives market is already overcrowded. The typical risk of this structure is that once spot selling pressure is exhausted, short covering can easily trigger an upward wick, so entry position is more impor
post-image
ORCA-17.67%
PUMP-10.24%
$JCT Quickly, quickly, open a short! This is a selling opportunity from the top,
I’ve already entered a short with 1 thousand—come on, let’s make profits!Target: 0.0020
post-image
JCT+58.08%
Layout: Bitcoin, Ethereum, Dogecoin
live-cover
LIVE880
  • 6
Sister U 10.9 Friday $BTC Strategy
Entry conditions: Revisit the 80700–89999 range, with the 4-hour candlestick closing with a long lower wick indicating a halt to the decline, accompanied by increased buying volume providing support; after confirming stabilization, cautiously enter a small long position.
Stop-loss: If the price decisively falls below 80000 and the support is completely broken, immediately abandon the long bias and exit.
First take-profit target: 82800
Second take-profit target: 84000
Market logic: The market has continued to retreat from the high of 87239, and after bearish
post-image
BTC-1.78%
The past few days I've been off the charts, really sick and had to spend some time with family (you know the feeling). I should be back better and active from this weekend or Monday at most.
post-image
This is purely the market being in a good mood and casually tossing out some coins that happened to land right on my head.

When the sell-off first hit in the morning session, others were still waiting for a rebound. I saw clear resistance above $CELO , with sell orders coming in wave after wave while trading volume failed to keep up. The rebound was weak, and the short thesis was as natural as breathing.

From 0.11309 to 0.09123, +934.71% delivered straight to the target. Nailed it. The long wait paid off—the earlier action was genuinely sluggish, but the result feels great.

Managing risk
post-image
CELO-2.27%
DOGE-4.90%
SNDK-5.11%
$SAND is currently the weakest of the three candidates, but precisely this combination of oversold conditions and negative funding gives me a reason to go long in the short term.
First, looking at relative strength: SAND fell 14.20% over 24h, significantly more than $CRV ’s 10.60% and $XRP ’s 2.41%; although the RSI of 35.5 has not reached an extreme, combined with the 25.66% amplitude across 30 candlesticks, it shows that selling pressure has been released in a concentrated manner. By comparison, $XRP ’s RSI is 47 and its MACD histogram remains positive, making it a relatively resilient asse
post-image
SAND-14.08%
CRV-10.85%
XRP-2.53%
The Federal Reserve's September meeting minutes reshaped market expectations regarding the interest rate path. The 25 basis point rate hike decision at the September 15-16 meeting was supported by all 19 officials, raising the federal funds rate to the 3.75-4.00% range. The minutes show that a large majority of participants considered another hike by the end of the year "likely appropriate." However, the immediate emphasis on "data dependence" and the lack of clear guidance regarding the October meeting led the market to interpret the minutes as "hawkish but unhurried."
This interpretation is
post-image
Gate_Square
🎉 Win Up to 100 USDT Weekly! Gate Square #WeeklyShare Is Ongoing!
📌 How to Join
① Sign up 👉 https://www.gate.com/campaigns/6244
② Post with #ShareWeekly and #FedSeptemberMinutesLeanHawkish, share analysis
💬 This Week’s Hot Topic
September’s minutes were hawkish, but October hike odds have fallen below 20%. The Oct. 14 CPI could be key. Will the Fed hike in October?
💡 Discussion
1️⃣ How would hotter-than-expected CPI affect hike odds?
2️⃣ How could Fed expectations impact crypto & U.S. stocks?
3️⃣ Is the current outlook already priced in?
Share your market view to win rewards 👉️ https://www.gate.com/post
repost-content-media
CME+2.29%
BTC-1.78%
ETH-3.78%
Bottom accumulation is complete, and room for a rebound in gold prices is gradually opening up
Recently, the market has continued to digest U.S. employment data. The slight cooling in employment data has raised market expectations for subsequent policy adjustments, providing support for gold prices.
From the four-hour chart, the price has gradually recovered from its previous low. Support from the lower Bollinger Band has held, and the market is moving upward toward the middle Bollinger Band. The RSI indicator is steadily rising, moving out of the low range, while bullish momentum continues to
post-image
XAU+0.70%
Many people chase after seeing a large bullish candle, and assume there is still room to rise when RSI has not crossed 70—this is a typical misreading of “strength” as “safety.” $RLC is in exactly this situation now.
Technically, $RLC is currently priced at 0.8609. MA5=0.90236 has crossed above MA20=0.778535, confirming a bullish moving-average alignment and a moderately bullish medium-term structure. However, the price has fallen back below MA5, and short-term momentum has weakened somewhat. The MACD histogram remains at +0.01407, with bullish momentum not yet reversed, but caution is warra
post-image
RLC+29.58%
SOL-5.20%
MINA-16.39%
$BTC Bitcoin and Ether fell on their own, unrelated to altcoins.
post-image
BTC-1.78%
My Gate Social Rising Stars Day 1 - Lets Win GT!
live-cover
LIVE65
No action, no analysis—just sheer luck. Even saying these results out loud feels embarrassing.

When the market plunged, $0G lacked that final push every time it moved higher; volume was low, support was weak, and it strongly smelled like a bull trap. I judged that it was facing pressure at the highs; with a bullish view, I did only one thing: wait for it to move down on its own.

Shorted from 0.3486 to 0.2854, with floating profit of +873.08%. Feels really good—I can finally treat myself to a nice meal. This short trade was realized cleanly.

Have a strategy before the market opens, disci
post-image
0G-5.20%
ADA-8.31%
ZEC-10.54%
$SOL has entered the oversold zone, but “it’s due for a rebound” and “it has bottomed” are completely different things.
I’m watching just one divergence: whether there is still buying support after breaking above 116.81. The current price is 110.33, with volume at 0.11x. The 1-hour and 4-hour trends are both weak, with RSI at 33 and 18, respectively.
If volume continues to expand after breaking above 116.81, control will favor the bulls; if it breaks below 105.71 and fails to reclaim it, the short-term outlook is invalidated. Stop trying to call the bottom for now and wait for a new support s
post-image
SOL-5.20%
$CXMT My position was too large. Last night’s low was caused by my stop-loss sell-off, and I got stopped out at the very bottom. That’s how helpless it feels.
CXMT-10.67%
The Fear & Greed Index is at 64, remaining in the greed zone, but $BNB ’s current price of 734.91 has fallen below MA20 (752.958), while MA5 (729.884) has also crossed downward. The 24h decline is 4.45%, RSI at 31.4 is approaching oversold territory, and the MACD histogram at -2.262 maintains bearish momentum. Market sentiment and price have diverged: the index has not cooled, yet the leader has weakened first, indicating that capital is rotating from major assets into higher-volatility sectors—during the same period, $WLD and $RENDER fell more sharply (-6.28% and -8.49%), with funding rates
BNB-4.51%
WLD-7.83%
RENDER-8.79%
Sister U 10.9 Friday $ETH Strategy
Entry condition: If the price pulls back into the 2420–2435 range, a 4-hour candlestick closes with a long lower wick indicating a halt in the decline, accompanied by increased-volume buying support, then cautiously test a long position with a small allocation after stability is confirmed.
Stop-loss level: If the price effectively breaks below 2400, completely breaching support, immediately abandon the long thesis and exit.
First take-profit target: 2510
Second take-profit target: 2560
Market logic: ETH has continued declining from the 2777.7 high. After con
post-image
ETH-3.80%
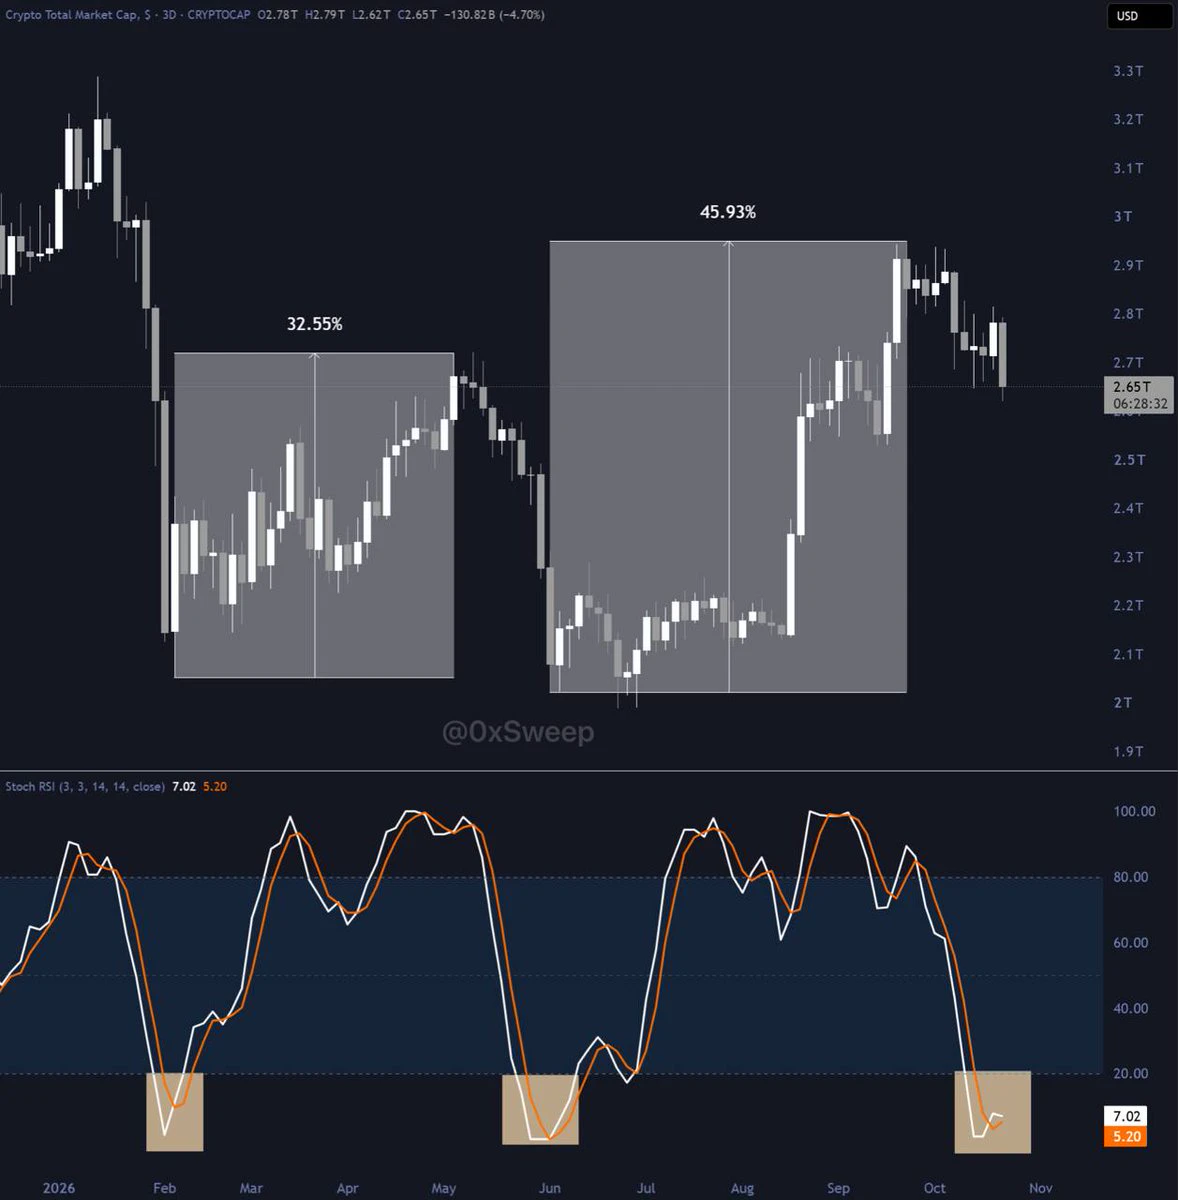
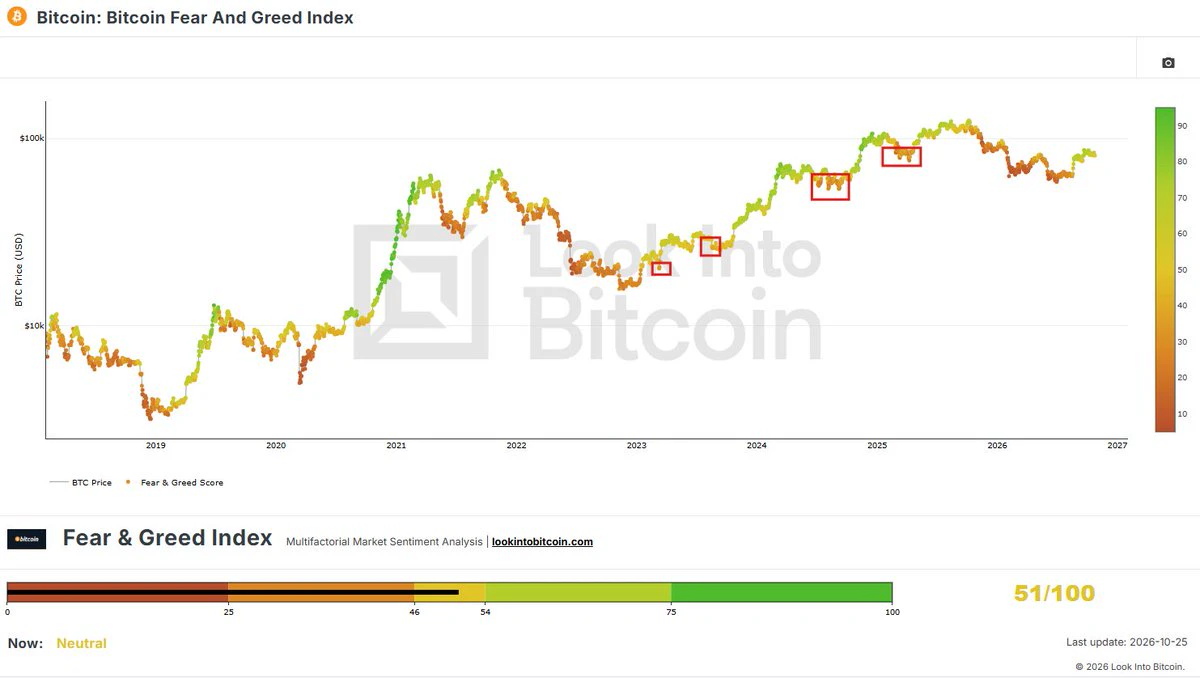
Profit taking stays light against past cycles. Weekly Net Realized Profit/Loss, the net dollar gain locked in when coins change hands, runs well below the average week at the 2024 and 2025 tops. Its pace in this rally, the right-hand band on the chart, is close to the start of the last uptrend in late 2023, the left-hand band.
The sellers have changed, though. Long-term holders, who have held their coins for more than 155 days, nearly doubled their realized profit in the week to September 29 against the week of the breakout, and their share of all realized profit rose from 34% to 55%. Should w
post-image
  • 3
  • 2
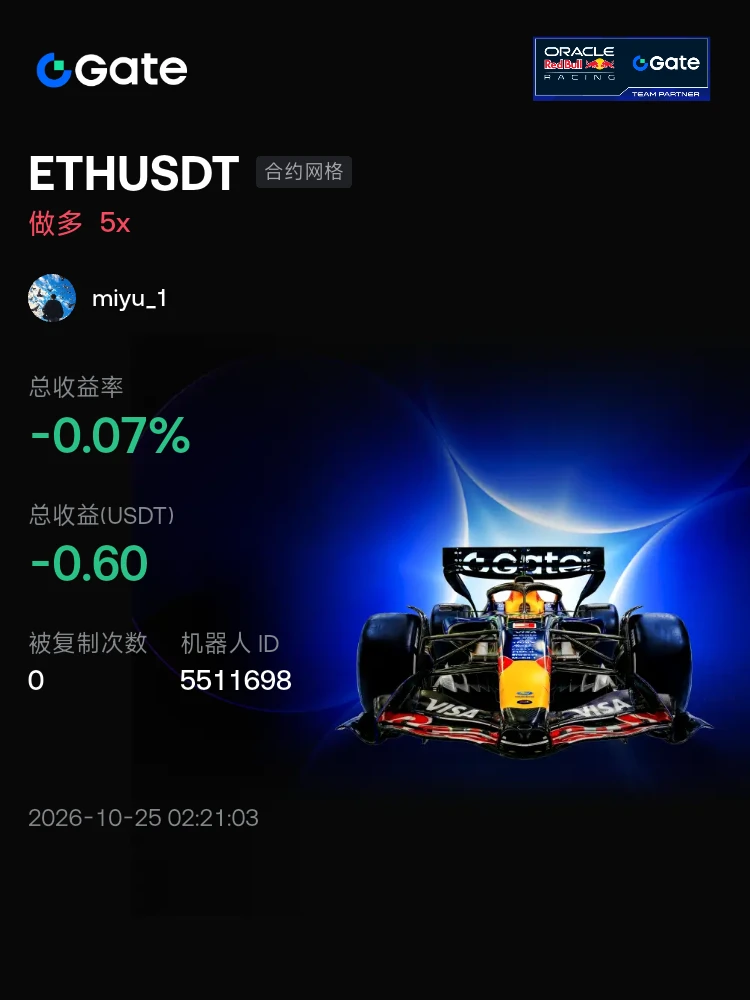
#Trading Bot #我正在 Gate ETHUSDT Futures Grid Bot, total return since creation +293.90% Hurry and get on board, the pullback is almost over
Load More

Join 40 M users in our growing community

⚡️ Join 40 M users in the crypto craze discussion

💬 Engage with your favorite top creators

👍 See what interests you

Trending Topics

Gate Money Officially Launches

3.45k Views12.87k Discussing

Gate officially launches Gate Money, a global integrated financial services app that brings digital assets, fiat, stocks, ETFs, gold, bank accounts, and payments into one Gate App. Users can manage assets, invest, send and receive funds, convert currencies, and make payments — all from a single account. Which use case are you most excited about? [👉 Learn more](https://www.gate.com/announcements/article/102094)

Fed September Minutes Lean Hawkish

64.16k Views2.72k Discussing

Samsung Q3 Operating Profit Surges 782.5%

36.91k Views1.93k Discussing

View More