Square
Following
Hot
News
Profile
Share your thoughts
placeholder
Article
BTC BOLD MOVES 🔥
live-cover
LIVE1,088
#GateWCTCS9GlobalTradingCompetition Gate WCTC S9 Global Trading Competition: Multi-Asset Arena Opens, Strategy and Risk Control Decide the Outcome
Gate's World Crypto Trading Competition Season 9 (WCTC S9) is scheduled to run from October 26 to November 25, 2026. Registration opened on October 9 and closes at 16:00 (UTC+8) on the opening day. This season marks a significant upgrade in both scale and format: the maximum advertised prize pool reaches 6,000,000 USDT, and for the first time the competition extends beyond crypto assets to traditional asset classes including stocks, ETFs, gold, and
post-image
BTC-0.71%
Trenches
CNPY
C
bade
b
CNPY
0xc6...ddd2
Market Cap
$.
Change
.
24h Vol
$.
Holders
.
AGT
A
bade
b
AGT
0x5d...e274
Market Cap
$.
Change
.
24h Vol
$.
Holders
.
FTR
F
bade
b
FTR
DFMt...pump
Market Cap
$.
Change
.
24h Vol
$.
Holders
.
DOPE
D
bade
b
DOPE
0xf9...8899
Market Cap
$.
Change
.
24h Vol
$.
Holders
.
1
1
bade
b
1
2bCC...pump
Market Cap
$.
Change
.
24h Vol
$.
Holders
.
$WLD #Wld Recently Breaks Descending Trendline, Looking Good For Recovery, Expecting Solid Bullish Wave In Coming Days
post-image
WLD+4.68%
Explosive signal! The median U.S. stock has plunged 15%, the AI fig leaf is about to give way, and crypto should brace for another leg down!
Don't just watch BTC trade sideways—the real danger is in U.S. stocks!
On October 17, Treasury yields, the dollar, and oil prices all rose, amounting to an “invisible rate hike” in financial conditions. The median S&P 500 stock is down 15% from its 52-week high, while the equal-weight index has lagged the market-cap-weighted index by about 6% over the past six months. The equity risk premium has fallen below zero, and the index is being propped up entirel
post-image
NVDA-1.42%
  • 2
  • 1
It's been a little hard to make money lately.
The clients have such bad attitudes.
The asset in the S&P 500 that’s been called the “car of 2020” is Tesla. It wasn’t in the index from the start of 2020; it was officially added on December 21, 2020, after the inclusion was announced on November 16. Looking back, the timing was indeed intriguing: between the announcement and the effective date, the market traded ahead of the expectation that passive funds would have to buy, amplifying both the stock price and trading volume. Based on Tesla’s market cap of a little over $600 billion at the time, its weighting after inclusion was about 1.6%, meaning passive funds tracking the S&P
post-image
SPYX-1.03%
TSLA-2.17%
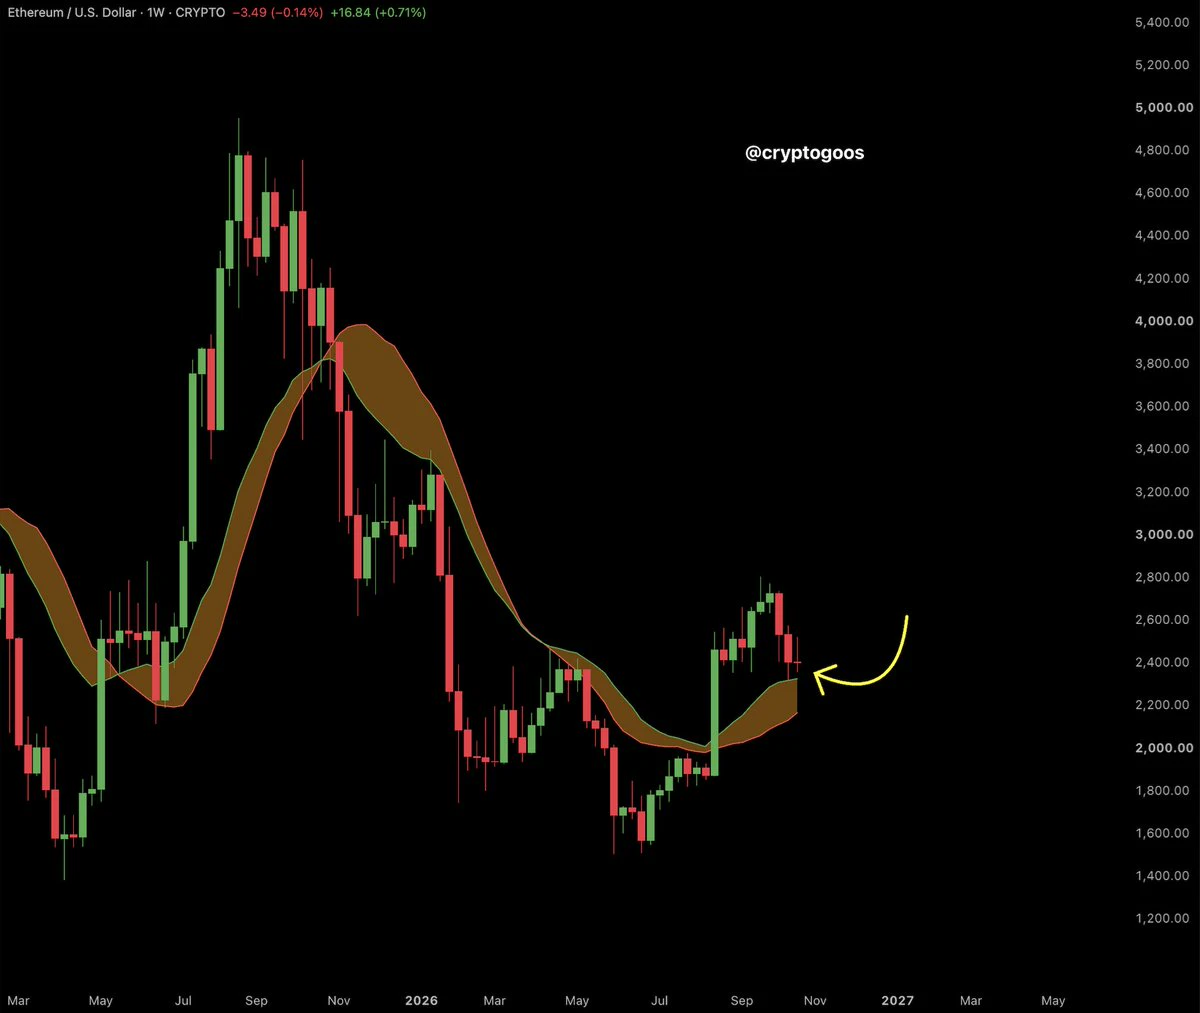
#ETH has two competing counts.
My preferred interpretation is an ABC correction with an extended C wave. The 2.618 × A projection sits near $2,319, although C could finish short of it.
The alternative is a bearish 1–2–3, with the bounce forming wave 4 before another decline.
A sustained break above $2,630 would favour the corrective interpretation. A fresh low would keep downside risk active.
Trade the developing structure, manage risk and remain open to both.
post-image
ETH-0.93%
gm enjoy your weekend
post-image
  • 1
BTC and ETH are trading weakly in a range; wait for a rebound to short
The four-hour structure remains weak, but the current level is not suitable for chasing shorts.
Today, only wait for the price to enter the resistance zone and show signs of rejection before considering an entry.
[BTC Strategy]
Direction: Short on a rebound
Entry: Rejection in the 81950—82100 range
Target 1: 81300
Target 2: 80800
🔴 Stop-loss: Above 82350
If the price moves above 82350 and holds on a retest, cancel the short plan.
[ETH Strategy]
Direction: Short on a rebound
Entry: Rejection in the 2450—2465 range
Target 1:
post-image
ETH-0.93%
BTC-0.71%
Bitcoin falls below $81k, Ethereum below $2,400
live-cover
LIVE3,622
Would you still dare chase TIA at $0.72?
Up 2x in 30 days, 50% in 7 days, and another 20% in 24 hours—everyone is shouting, “The king of modularity is back.” But here’s the painful truth: this chain with a $600-700 million market cap has just a few hundred dollars in actual daily revenue. Is this rally a re-rating of the narrative, or a bubble inflated by leverage?
First, the surface picture: a sharp surge from the bottom, rising trading volume, and real money flowing in.
The $0.72 you’re seeing is in line with the mainstream market data (CMC at around $0.73). Up 10-20% in 24 hours, 50% in 7 d
post-image
BTC-0.71%
ETH-0.93%
TIA+9.18%
$ZEC Thesis confirmed! It fell from 1244 to 1130 last night!
Why did it fall? The core logic behind this move:
After an earlier surge of about 460%, highly leveraged longs were liquidated en masse, triggering a chain reaction.
ZEC long liquidations totaled about $17.9 million–$20 million within 24 hours, accounting for 88.7% of total liquidations. The hotter-than-expected U.S. CPI, concerns about AI breaking encryption, $124 million in outflows from Grayscale ZCSH, and panic over a technical breakdown were merely catalysts.
ZEC's high beta caused it to fall far more than BTC and ETH. At its co
post-image
ZEC-5.00%
BTC-0.71%
ETH-0.92%
Everyone‼️‼️$ETH is quietly building momentum……Will $2,470 trigger the next rally?
I’m looking for a large long opportunity here: $ETH . Entry: 2,425–2,435 Stop-loss: 2,405 Take-profit 1: 2,440 Take-profit 2: 2,470 Take-profit 3: 2,515
The reason is simple. ETH is recovering from its recent decline and forming a short-term bottom around $2,420–$2,430. Buyers are gradually returning, but the real test is whether they can reclaim $2,440 and break through the resistance above……!!!!!!!!!
A strong breakout could open the door to $2,470, or even $2,515. However, if ETH falls below $2,405, this reco
post-image
ETH-0.93%
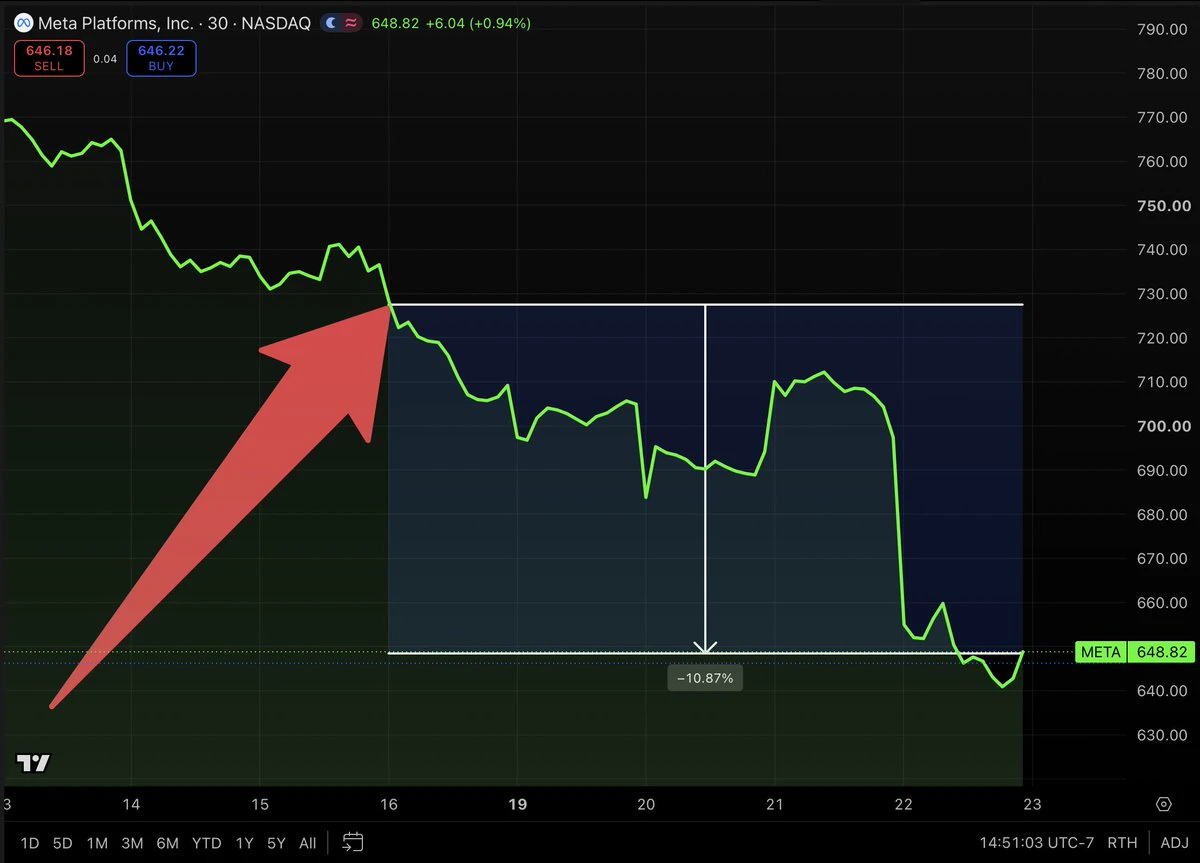
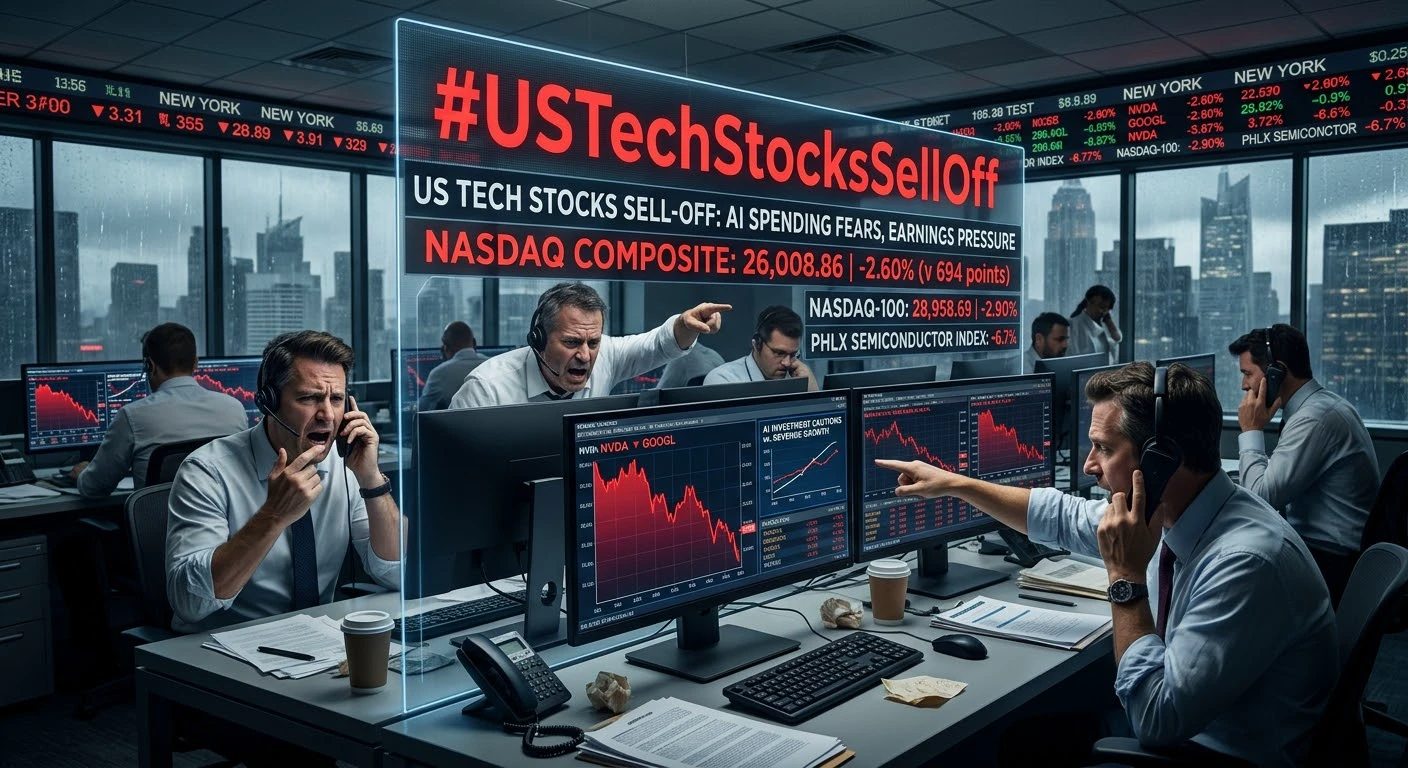
Is it time to buy the dip in US stocks? Will the AI and semiconductor correction continue?
Anyone familiar with the Nasdaq knows that every drop sets the stage for a stronger breakout to new highs. Since the Nasdaq broke out again around the beginning of the month, the plunge in Asian memory stocks has caused the AI sector to shrink sharply, dragging down the broader market.
But that doesn’t mean the Nasdaq is done. Speaking about AI’s sharp decline, Jensen Huang said that all of this will pass. To me, the US stock market currently looks more like it’s undergoing sector rotation. The AI market
SNDK-5.87%
$EIGEN is pushing right into a major resistance wall, where a $2.77M Short Liquidity cluster sits, & whales are already sending their bags to exchanges
Derivatives Data:
• Top Accounts are short biased (0.76)
• The largest positions are short (0.93)
• A whale just deposited $269.8K straight to Coinbase
• 24h onchain flow is -$132.6K (Distribution)
Retail is Long (66%) & they're buying right into the resistance wall while smart money is selling into it
If price rejects 0.2860, the path down to the 0.2540 & 0.2370 Long clusters become likely
$EIGEN
EIGEN+7.00%
Money really does fall from the sky—there really are lucky finds like iPhones floating at sea! Recently, a cargo ship in the Strait of Hormuz strayed into a dangerous route, hit a mine, caught fire and sank. More than 2,500 containers spilled into the sea, and large quantities of brand-new iPhones floated out.
Local fishermen rushed over in small boats to salvage them. Even more amusingly, they started doing business right there, asking people passing by: “Want an iPhone? Want perfume? Whatever you want!”
Can these phones still work after being soaked in seawater? Will Apple step in? $AAPL ‌
AAPL+0.18%
$UNI is holding up better despite a broad sell-off across the sector. The reason lies in its structure: its current price of 7.314 remains above MA5=7.3092 and MA20=7.30065, with the moving averages in bullish alignment. Meanwhile, $NEAR
has fallen below MA20=5.0882, with MA5=5.0666, and $XRP
's MA5=1.3088 is also below MA20=1.31205. All three have similar 24h declines (-2.34%, -2.79%, -2.29%), but only $UNI has held support from the moving averages, making the relative strength clear. Looking at momentum, $UNI 's RSI=50.0 is neutral, while its MACD histogram at +0.00335 remains bullish, an
post-image
UNI-2.26%
XRP-2.52%
$EPIC I’m betting this pullback won’t break 0.28. If it does, I’ll livestream myself washing my hair upside down. It’s now at 0.3128, up 36% in 24 hours, rocketing from 0.2112 to 0.3350, with $34 million in trading volume—that kind of volume can’t be driven by retail traders. Clearly, funds scooped up tokens in the 0.21–0.23 range and then pushed the price straight up. The order book depth around 0.30 is average; a pullback after a rally is a normal shakeout, not a top. My plan: scale in between 0.285 and 0.295, set a stop-loss at 0.265, and take 0.36 as the first target, keeping my position
EPIC+18.23%
#CryptoMarketTurnsGreedy
$LIT just printed a clean recovery from the 2.91 low and is now sitting at 3.225 up nearly 6% on the day. The question isn’t whether the bounce is real. It’s whether the structure still has room to run or if the sellers are about to reclaim control.
⭕️Multi-Timeframe K-Line Reading.
🔴4-Hour (Higher Timeframe Structure)
Price recovered hard from the 2.914 low and is now testing the declining MA cluster. The last few candles are constructive: consecutive green bodies with higher lows, closing near the highs. However, the longer-term MA30 (3.244) is still sloping down
LIT+5.87%
  • 4
Back then, if Li Youtian had been driving this Tesla, he might really have shown Brother Qiang how to spell “Mang” in Mang Village.🤭
post-image
Load More

Join 40 M users in our growing community

⚡️ Join 40 M users in the crypto craze discussion

💬 Engage with your favorite top creators

👍 See what interests you

Trending Topics

USSeptemberPPIBeatsExpectations

91.35k Views1.92k Discussing

US September PPI came in at 6.3% YoY, well above the 5.3% market expectation, pointing to renewed producer-side inflation pressure. Weekly jobless claims were 199K, broadly in line with forecasts. Could hotter inflation further reduce room for rate cuts, and what does it mean for $BTC, US stocks, and gold?

GateWCTCS9GlobalTradingCompetition

37.87k Views6.59k Discussing

GateBTCAndETHFuturesVolumeRanksTop3

53.8k Views1.74k Discussing

View More