
Square
Following
Hot
News
Profile
Share your thoughts
placeholder
Article
$STRK Current price 0.09112, closely tracking the upper Bollinger Band at 0.09119, with the first short-term resistance right ahead; 0.0865–0.0880 is the bulls’ defense zone on a pullback, with 0.0840 next if it fails.
A horizontal comparison of relative strength: $JTO fell 6.59% over 24h, with MA5 crossing below MA20, RSI at just 45.8, and a funding rate of -0.0035% indicating bearish sentiment dominance; meanwhile, $STRK 24h rose 18.77%, with trading volume clearly expanding to 53.0M USDT, MA5=0.085294 above MA20=0.079219, bullish MA alignment, RSI=61.2 not yet overbought, and the MACD his
post-image
STRK+25.95%
JTO-7.27%
BNB-0.10%
Bulls no wan let me take profit ke
post-image
🔥 $LUNC JUST BURNED 1 BILLION TOKENS IN 10 DAYS!
🔥 Oct. 1 alone: 419M burned
🔥 Total burned since May 2022: 460B+
But here's the problem… 👀
📉 Price: ~$0.00005
📊 Volume: Below $10M
The burns are real.
The demand isn't there. YET.
Less supply means nothing without buyers stepping in. 🐻🔥
Will demand finally catch up?
post-image
LUNC+0.91%
#日韩股集体大跌 #ShareWeekly
JAPAN AND SOUTH KOREA STOCKS IN FREEFALL: A GOLDEN BUYING OPPORTUNITY OR THE START OF ANOTHER DOWNTREND?
Asian technology markets have entered a critical phase. Japan's Nikkei 225 and South Korea's KOSPI suffered severe losses, while leading semiconductor and storage companies experienced double-digit intraday declines. For investors watching the artificial intelligence (AI) boom, this sell-off raises an important question: Are markets creating an attractive long-term entry point, or is the correction warning us that more downside could follow?
My view is cautiously opti
post-image
CryptoChampion
#日韩股集体大跌 #ShareWeekly
JAPAN AND SOUTH KOREA STOCKS IN FREEFALL: A GOLDEN BUYING OPPORTUNITY OR THE START OF ANOTHER DOWNTREND?
Asian technology markets have entered a critical phase. Japan's Nikkei 225 and South Korea's KOSPI suffered severe losses, while leading semiconductor and storage companies experienced double-digit intraday declines. For investors watching the artificial intelligence (AI) boom, this sell-off raises an important question: Are markets creating an attractive long-term entry point, or is the correction warning us that more downside could follow?
My view is cautiously optimistic about the long-term AI infrastructure story, but I believe short-term caution remains essential. A sharp decline can create opportunities, yet falling prices alone are not sufficient evidence that a market has reached its bottom.
1. A Brutal Session Across Asian Markets
According to the figures provided, Japan's Nikkei 225 closed down 4.90% at 64,425.95 points, while South Korea's KOSPI dropped 7.57% to 5,554 points. The KOSPI reportedly fell more than 9% at one point during the session, prompting circuit-breaker measures and the activation of a Sidecar mechanism to curb program-driven selling.
The pressure was particularly severe across the memory and storage industry. SK hynix plunged 11.06%, Samsung Electronics lost 9.48%, and Kioxia declined by more than 12%. Before the U.S. market opened, SanDisk was reportedly down 5.33%, Micron fell 4.07%, and Western Digital and Seagate also experienced losses exceeding 4%.
These movements suggest that investors were reducing exposure across the broader AI hardware ecosystem rather than selling only one company or one national market.
2. Inflation Is Changing the Market's Risk Calculations
The first major concern is macroeconomic uncertainty. The supplied market figures indicate that September U.S. CPI inflation came in hotter than expected, with headline inflation at 3.7% year over year, core inflation at 2.6%, and core monthly inflation at 0.3%.
When inflation remains persistent, investors may reconsider how quickly central banks can ease monetary policy. Higher expected interest rates can increase discount rates, making future earnings less valuable in today's prices. Companies trading at premium valuations are especially vulnerable because their market prices depend heavily on expectations of future growth.
However, expectations of a rate hike are not the same as an actual policy decision. Investors should watch subsequent inflation data, Treasury yields, Federal Reserve communications, and changes in market pricing before drawing firm conclusions.
3. AI Financing Costs Are Testing Investor Confidence
The second concern involves the cost of building AI infrastructure. Data centers, advanced processors, high-bandwidth memory, and large-scale storage systems require enormous investment.
Concerns about financing costs and the ability of AI infrastructure companies to generate sufficient returns can create pressure across the entire technology supply chain. The reported widening of CoreWeave's five-year credit default swap spread beyond 1,000 basis points, if accurate, highlights why credit risk deserves attention alongside revenue growth.
The important distinction is that strong demand does not automatically guarantee attractive stock returns. Even excellent businesses can experience significant corrections when expectations become too optimistic or financing becomes more expensive.
4. Is the Storage Sector's Long-Term Story Broken?
Not necessarily. AI models require substantial computing power, and expanding data-center workloads can support demand for memory and storage. Pricing trends, capacity utilization, supply discipline, and earnings growth remain important factors.
Nevertheless, investors must distinguish between a healthy industry and an attractive stock valuation. A company can benefit from growing demand while its shares continue falling because the market previously priced in excessive optimism.
For that reason, I would monitor quarterly earnings, management guidance, memory prices, capital expenditure, and cash-flow performance before assuming that the recent decline has created a bargain.
5. My Trading Framework: Confirmation Before Entry
I would divide the next phase into three possible scenarios.
Bullish scenario: Selling pressure fades, major indexes stabilize, and leading semiconductor stocks reclaim important resistance levels with stronger trading volume. This could support a technical rebound.
Bearish scenario: Markets continue making lower lows, yields rise further, and earnings expectations weaken. Under these conditions, buying simply because prices have fallen could expose traders to another wave of losses.
Sideways scenario: Volatility gradually decreases while markets consolidate. This may allow investors to identify clearer support and resistance levels before making decisions.
My approach would be to avoid chasing a rebound or attempting to predict the exact bottom. I would wait for stabilization, evaluate confirmation signals, and consider scaling into positions only when the risk-to-reward profile becomes more attractive.
6. What This Means for WCTC S9 Participants
For traders participating in Gate's World Crypto Trading Competition Season 9, this environment is a reminder that discipline matters more than activity. Volatility across Asian equities can influence broader risk sentiment, but it does not guarantee that Bitcoin or other cryptocurrencies will move in the same direction.
I would monitor Bitcoin's key support and resistance levels, liquidity conditions, funding rates, and the reaction of U.S. markets. I would also avoid increasing leverage merely to recover losses or improve competition rankings.
My personal principle remains simple: protect capital first, manage risk on every position, and let the market confirm a setup before committing.
Final Thoughts
The October 15 sell-off may eventually prove to be a buying opportunity, but the evidence is not sufficient to declare that the bottom is in. Inflation uncertainty, financing costs, valuation pressures, and market sentiment must all be considered.
Not financial advice. Always do your own research.
I remain interested in the long-term potential of AI infrastructure while staying cautious about near-term price action. The best opportunity is not necessarily the day when prices fall the most; it is the moment when improving fundamentals and credible technical signals begin to support each other.
In volatile markets, patience is a strategy, risk management is a necessity, and confirmation is more valuable than speculation.
#WCTCS9 #SouthKoreaStocks #JapanStocks @Gate_Square
repost-content-media
  • 4
90% of all these guys trolling Duve are DL’s!
Wait till yall files got dug up
People grow, people change, and everyone has a past.
Just another day in CT, watching people expose their own hypocrisy through ridiculous racism and homophobic comments. The irony is unreal
post-image
BREAKING: TSMC's tokenized stock is now live on Raydium, trading 24/7 on Solana via Sunrise and Backpack Securities. The world's largest chip foundry reported NT$511.86 billion in September revenue, up 54.6% from a year earlier.
@Raydium
TSM-2.70%
RAY-3.00%
September CPI data came in above expectations, and markets are trying to digest this surprise. Headline inflation rose to 3.7% year-over-year, surpassing the 3.6% forecast. Core inflation also climbed to 2.6% year-over-year, exceeding the 2.5% estimate. On a monthly basis, core inflation rose by 0.3%, coming in higher than expected.
Following the data release, the probability of the Fed raising interest rates at its October meeting nearly doubled in a single day. According to the CME FedWatch tool, this probability rose to 43.7% after the announcement, up from 22% prior to the data. Although s
post-image
CME+1.28%
BTC+0.26%
BLK+3.03%
ETH+0.12%
SPX500+0.13%
  • 2
GM why did all tokens die overnight
post-image
U.S. stocks fell even harder than BTC last night—what does this indicate?

U.S. stocks fell first before the PPI data was released. After yesterday’s CPI data came out, U.S. stocks had already fallen for an entire day. With today’s PPI again exceeding expectations, U.S. stocks will likely remain under pressure.

I looked at yesterday’s data: The Dow fell 0.09%, the S&P 500 fell 1.11%, and the Nasdaq fell 1.88%, marking its biggest single-day drop since July. Eight of the 11 S&P 500 sectors declined, with technology leading the losses, down 2.62%. The semiconductor sector performed even worse
ETH-0.43%
[New Streamer] Whales Moves in Sync!
live-cover
LIVE1,427
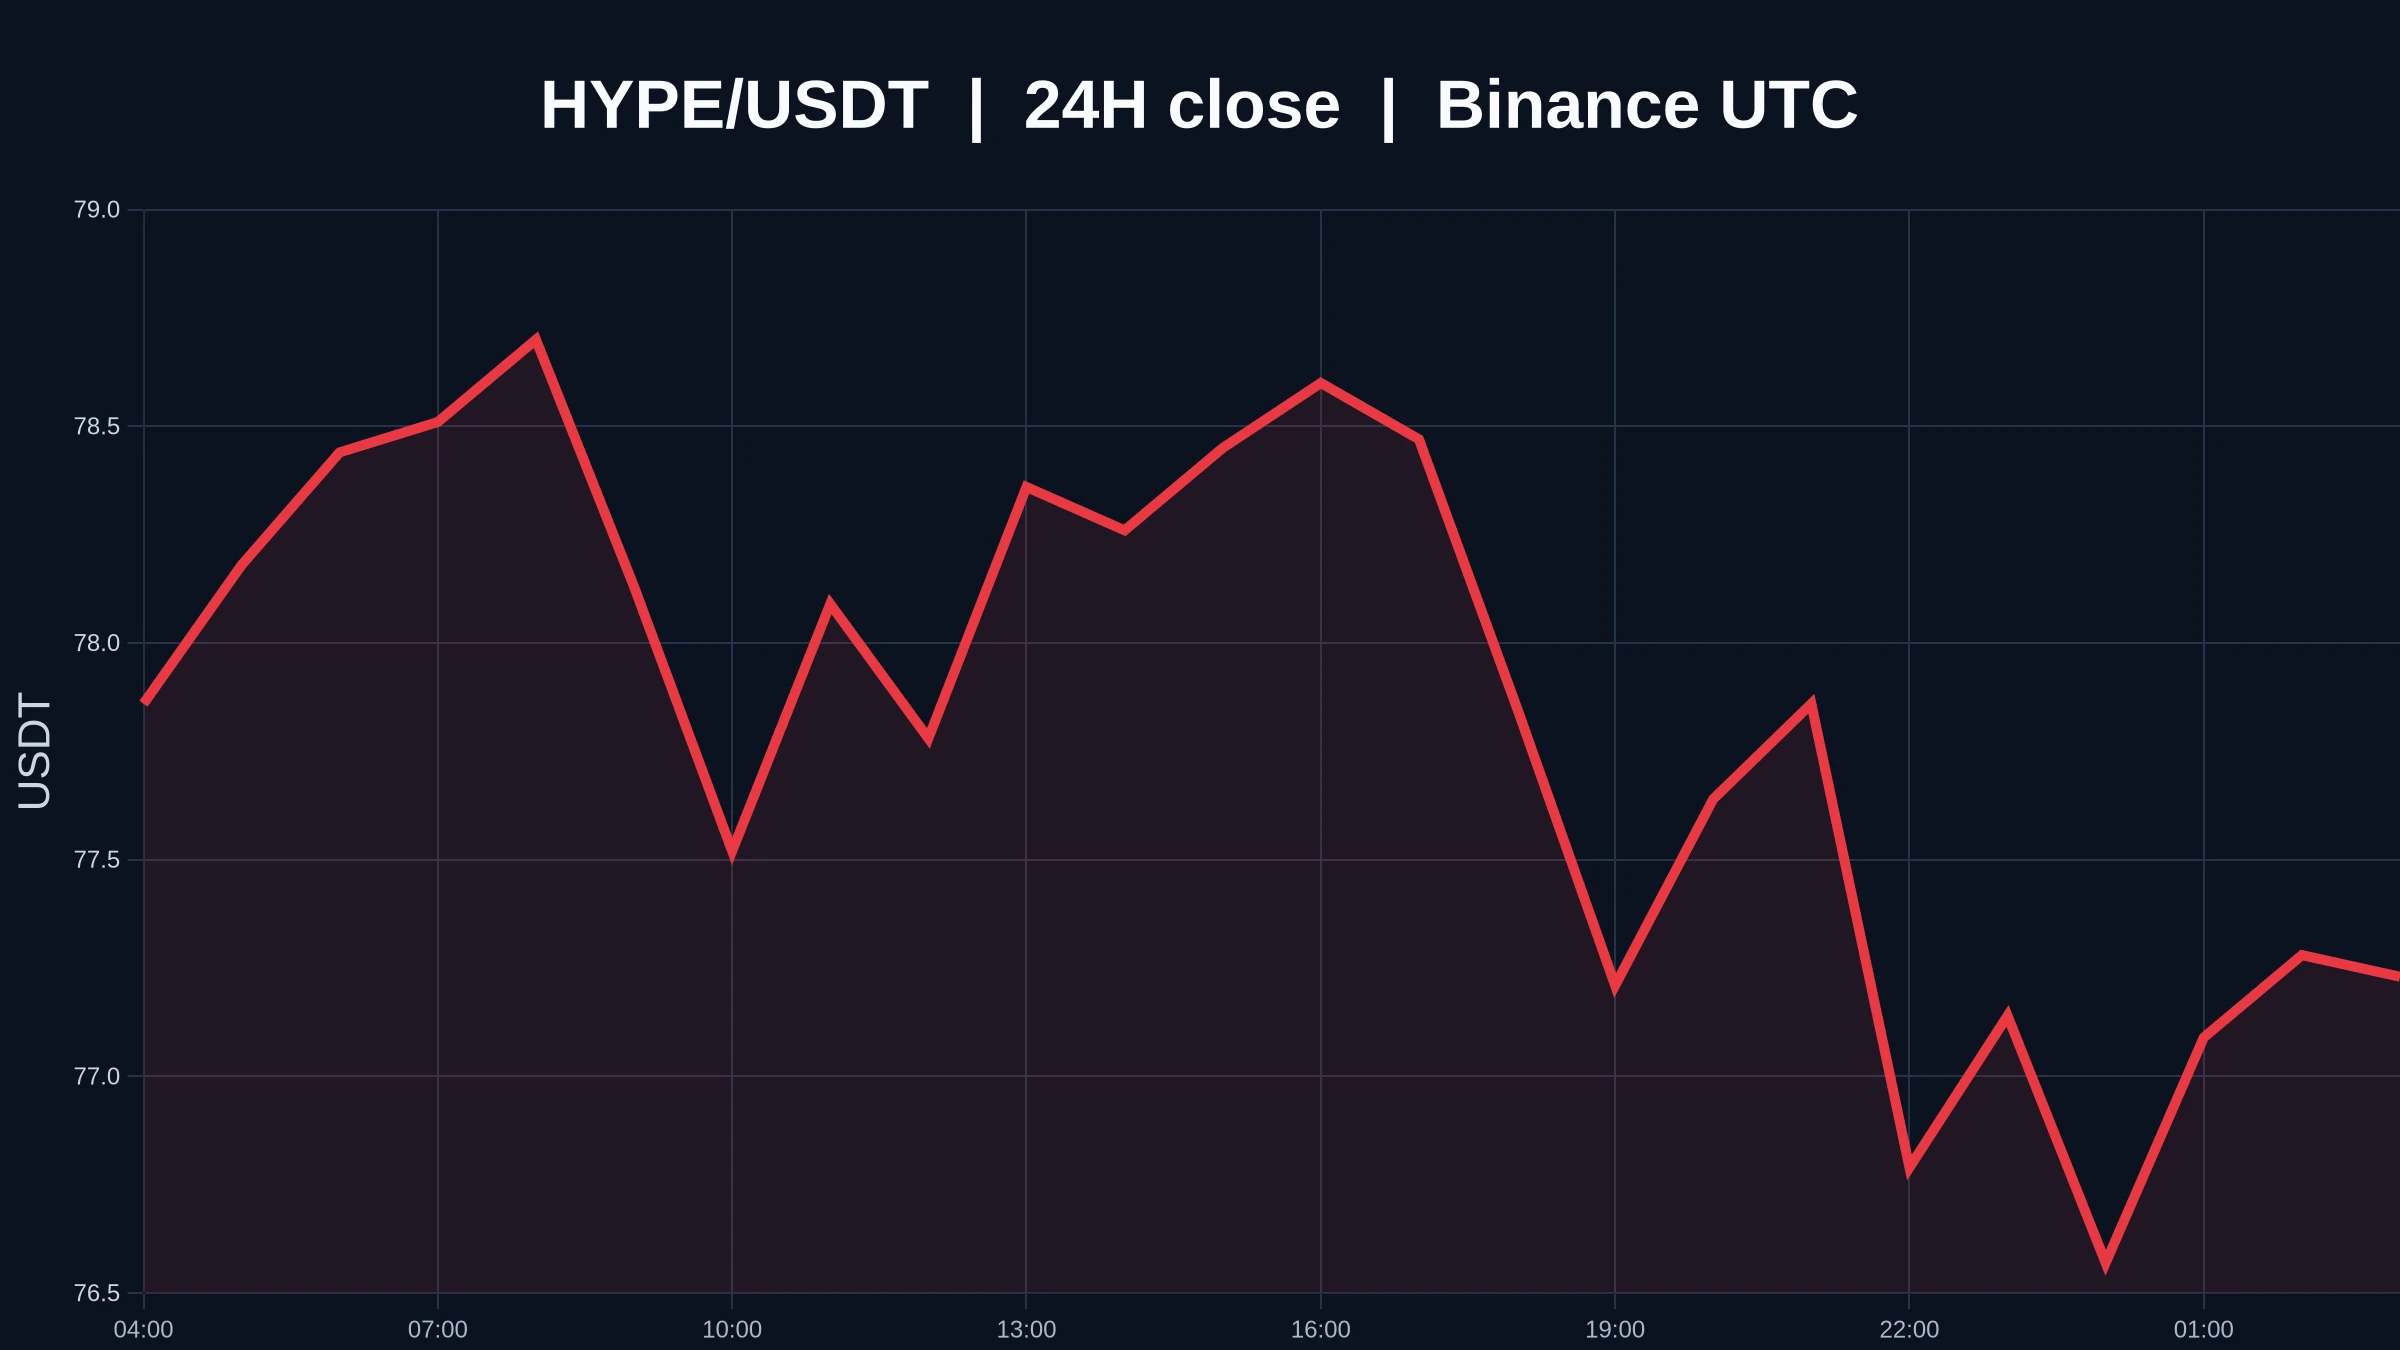
$HYPE HYPERLIQUID / USDT
Market Structure & Technical Outlook
Price has been in a bearish trend, consistently printing Lower Lows (LLs) and Lower Highs (LHs). However, a potential bullish reversal is developing, supported by bullish RSI divergence on the 1H timeframe.
Price has already broken above the previous Lower High (LH), indicating a potential shift in market structure from bearish to bullish. Therefore, an immediate entry may be considered, subject to the trader’s entry criteria and risk management rules.
Trade Plan
Entry: Instant Buy at Current Market Price (CMP), following the LH bre
post-image
HYPE+1.64%
$MSTR
I think it’s forming the right shoulder here. It held the support band at $137 and bounced very strongly. I can’t wait to see the right shoulder clearly
post-image
MSTR+3.27%
Bitcoin remains firmly bearish at midday, with 81,700 clearly acting as resistance and a direct short setup, targeting below 80,000. U.S. stocks fell as expected at the open, with the low reaching around 79,800; the 1,700-point move played out steadily…$BTC ‌#美国9月PPI大超预期
BTC+0.25%
BREAKING 🚨🚨🚨: $GALA has done the required backrest of the previous resistance now turning it into a support .
I’m still bullish as always 🚀🚀🚀, I’m giving the price enough time to play out but yeah it looks good to me.
post-image
GALA+0.84%
Can we please grab that?
post-image
$UNI ’s biggest trap in this move
When I looked at $UNI again, I first covered up the +4.64% over 24 hours. It’s not that this number is unimportant, but it is too easy for it to seize attention. What really needs explaining right now is that the $UNI price has moved, while trading activity and volume have not kept up. The direction can be trusted for now, but its continuation cannot be trusted in advance; a move without anyone following up can be reversed at any time.
Laying out the market, the current price is 7.548, with a 24-hour range of 6.784–7.634. The 1-hour support is at 6.784, with r
post-image
UNI+3.74%
$SUI SUIUSDT 5X LONG with 1,595% Profits Potential + Technical Analys
Here we are going LONG on SUIUSDT with 5X. The entry price can by anything below $1.05, the entry range can also reach as high as $1.08-$1.10. This is a very strong chart setup.
A bullish breakout turns red two weeks, now the third week and we know this is more than enough for a retrace. The retrace ending leads to a bullish continuation and all the chart signals agree. A new bullish wave is possible.
Price action
The market never moves in a single line, it fluctuates. Now we are seeing red as part of a retrace, then we get
post-image
SUI-0.18%
$TRX Will a $200M Funding Plan Create Real Buying Pressure?
Nasdaq-listed Tron plans to raise up to $200M through a share offering to fund additional TRX purchases.
The potential catalyst is clear, but execution matters: the full amount may not be raised or deployed, while new share issuance could dilute existing shareholders.
The key question is how much capital actually reaches the $TRX market — and whether demand can sustain itself.
Is this a long-term bullish signal for TRX, or does the market need proof first?
#TRON #TRX #CryptoMarket
post-image
TRX-0.56%
Load More

Join 40 M users in our growing community

⚡️ Join 40 M users in the crypto craze discussion

💬 Engage with your favorite top creators

👍 See what interests you

Trending Topics

USSeptemberPPIBeatsExpectations

91.35k Views1.85k Discussing

US September PPI came in at 6.3% YoY, well above the 5.3% market expectation, pointing to renewed producer-side inflation pressure. Weekly jobless claims were 199K, broadly in line with forecasts. Could hotter inflation further reduce room for rate cuts, and what does it mean for $BTC, US stocks, and gold?

DrLinHanSpeaksAtOxfordUnion

135.63k Views1.86k Discussing

JapanAndKoreaStocksPlunge

47.27k Views1.75k Discussing

View More