



Share crypto content and earn up to 60% commissions through content mining.
placeholder
gatefun
🚨 BREAKING 🚨 :
Clarity act is coming
BITCOIN is going to $500k
Mark my words
Save this tweet for future
BTC-0.93%
post-image
post-image
  • Reward
  • Comment
  • Repost
  • Share
market update
gate liveLIVE
1,639
live-coin
  • Reward
  • Comment
  • Repost
  • Share
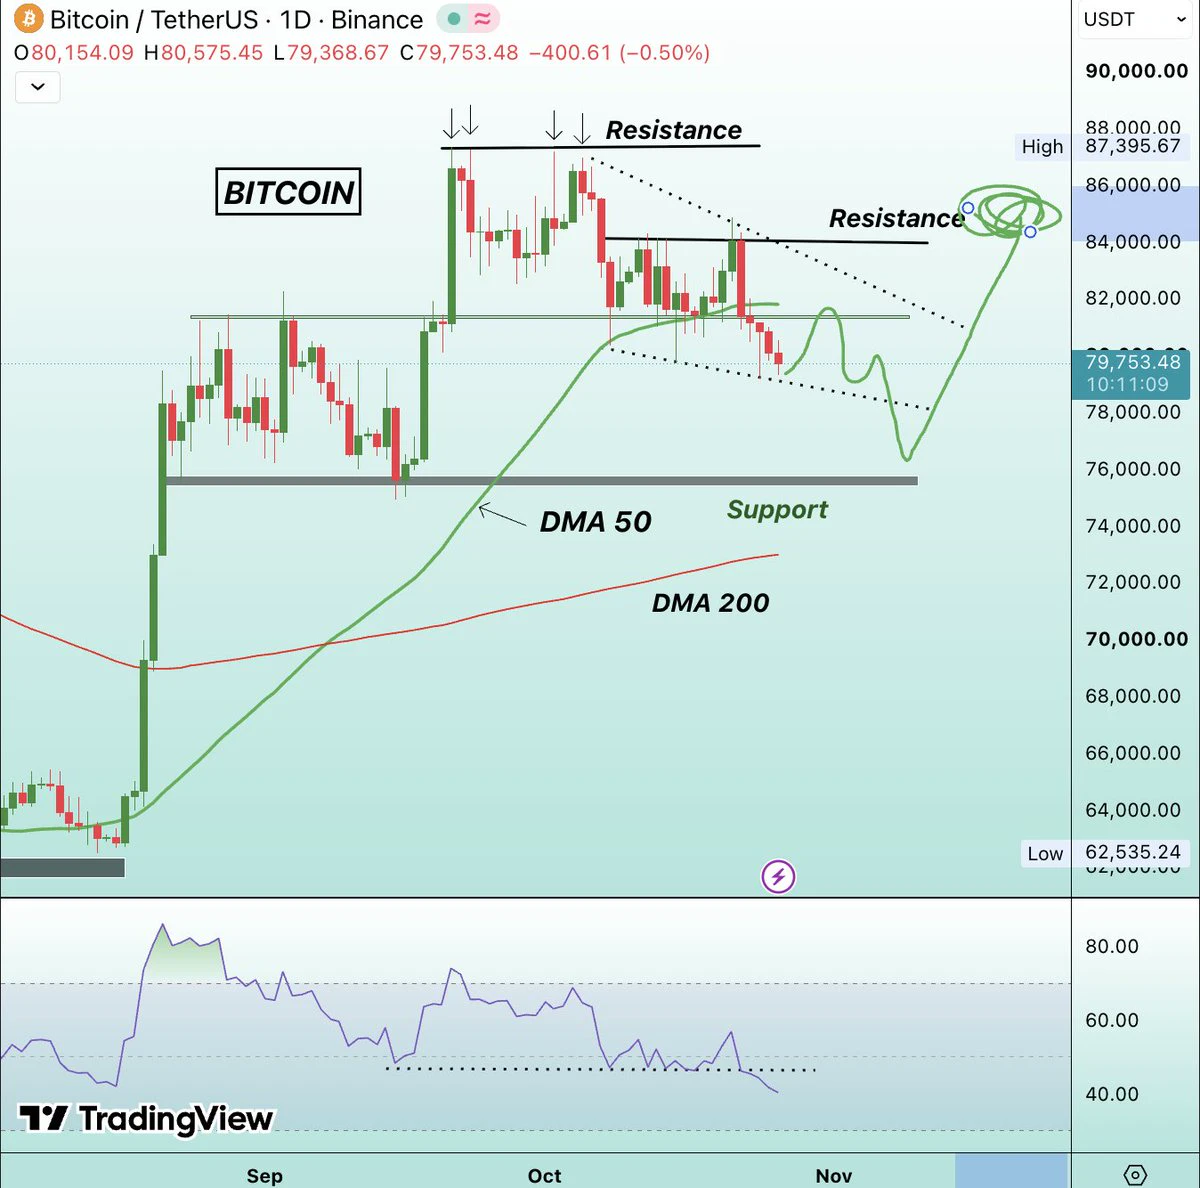
The BTC Silk Road plan was delivered on schedule. The price action ran from start to finish exactly according to the forecast script—no complicated analysis needed. Just stay on the Silk Road and do what it says, and you can easily and steadily “eat meat” with confidence. #中软国际携手月之暗面布局AgenticAI #USDT充值理财双重奏 #GUSD年化升至3.8% @$BTC $ETH
BTC-0.93%
ETH-0.68%
View Original
post-image
post-image
  • Reward
  • Comment
  • Repost
  • Share
Dodged the early-session long trap, and the big cake $BTC short position successfully took profits.
Trading isn’t about gambling—settle down and wait for your own opportunity, and it will build up steadily over time. #中软国际携手月之暗面布局AgenticAI
BTC-0.93%
View Original
post-image
  • Reward
  • Comment
  • Repost
  • Share
BNB-0.64%
View Original
post-image
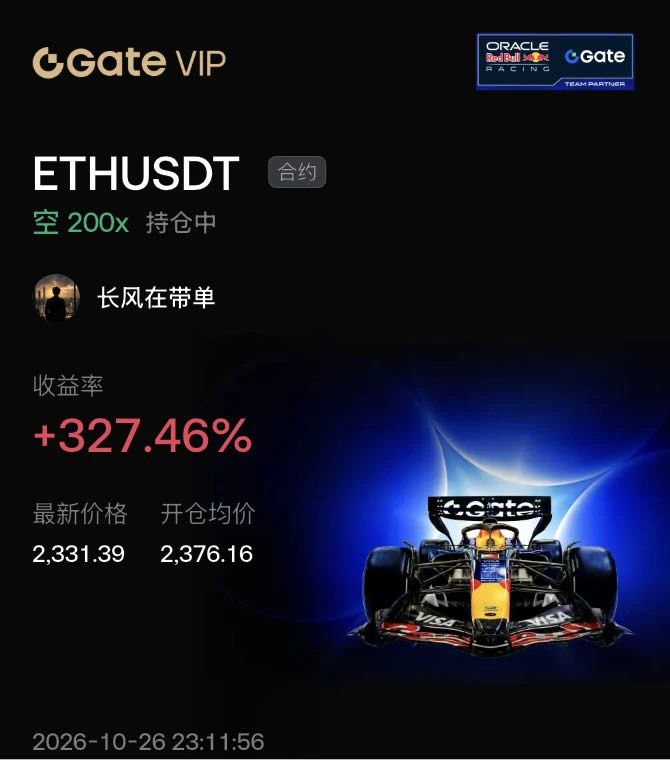
[The user has shared his/her trading data. Go to the App to view more.]
  • Reward
  • Comment
  • Repost
  • Share
#GUSDYieldRisesto3.8%
The Quiet Revolution in Digital Dollars why GUSD's 3.8% Yield Matters More Than It Appears Stablecoins were never meant to be exciting.
For years their role was straightforward: preserve value, provide liquidity and move capital across the crypto economy. Holding USDT or USDC meant holding digital dollars stable, reliable, but largely unproductive. Anyone seeking returns had to venture into lending markets, liquidity pools or other higher-risk strategies.
That era is beginning to change.
As real-world asset (RWA) tokenization matures, stablecoins are evolving from passiv
GUSD0.01%
USDC0.01%
USD10.01%
RWA0.85%
STABLE-2.29%
post-image
post-image
  • Reward
  • Comment
  • Repost
  • Share
#TSMCQ2NetProfitSurges77%
TSMC: The Crown Jewel of Semiconductor Manufacturing
Taiwan Semiconductor Manufacturing Company (TSMC) stands as the world's largest and most advanced semiconductor foundry, commanding an unparalleled position in the global technology ecosystem. As the primary manufacturer for industry titans including Nvidia, Apple, AMD, Qualcomm, and Broadcom, TSMC has effectively become the backbone of modern computing infrastructure. The company's recent Q2 2026 earnings report has sent shockwaves through financial markets, demonstrating why this stock deserves serious considerat
post-image
post-image
post-image
  • Reward
  • 4
  • Repost
  • Share
AylaShinex:
LFG 🔥
View More
🚨 Allbridge Exploited — $1.65M Gone on Solana
↳ $1.12M $USDC flash loan from Kamino.
↳ Pool manipulated with $USDC - $USDT swaps.
↳ $1.65M drained and bridged to Ethereum.
↳ Funds now moving through privacy pools.
Response:
↳ Protocol paused.
↳ LPs advised to withdraw urgently.
This follows Allbridge's $570K flash loan attack in 2023.
Since May, this is the 6th cross-chain bridge attack.
Cross-chain bridges are becoming DeFi's weakest link.
SOL-0.10%
USDC0.01%
KMNO0.10%
ETH-0.63%
  • Reward
  • Comment
  • Repost
  • Share
📰 Gate Square Daily|July 20
Today’s crypto market hot topics, important news, and fund flow directions—all in one chart 👇
post-image
  • Reward
  • 1
  • Repost
  • Share
HighAmbition:
thank you for information
#夏日创作营 CZ: Is the bear market about to end?
CZ posted a tongue-in-cheek message on X: “Is the bear market almost over?” This seemingly casual question instantly ignited heated community discussion.
The crypto market’s sentiment has been at an ice point for a long time. Bitcoin has been pulling back from its early-2025 historical high of about $124k, with the maximum drawdown exceeding 50%. It is currently hovering in the $60k to $65k range. The bear market has lasted for 9 months, and both short-term holders (STH, holding period <6 months) and long-term holders (LTH, holding period >6 months)
BTC-0.93%
View Original
post-image
ThisIsTranslateContent:
#夏日创作营 CZ: Is the bear market about to end?
CZ joked on X: “Is the bear market almost over?” This seemingly casual question instantly sparked intense debate in the community.
Crypto market sentiment has been at a freezing low for a long time. After falling from the historical high of about $124k at the start of 2025, Bitcoin has pulled back all the way, with a maximum drawdown of over 50%. It is currently hovering in the $60k to $65k range. The bear market has lasted for 9 months, and both short-term holders (STH, holding <6 months) and long-term holders (LTH, holding >6 months) have been under heavy pressure.
At this moment, CryptoQuant analyst Darkfost’s latest analysis has triggered widespread discussion: the market is entering the final stage of the bear market, and a key STH/LTH cost-basis downward cross signal has just been triggered (a 3-day confirmation window is required for validation).
Do they have “insider information”? The answer is most likely no. This looks more like a rational observation based on on-chain data and historical cycles, rather than insider intel. Bitcoin’s cyclicality has never been a secret—it is repeatedly verified by investor behavior.
Cost-basis cross: a classic signal for the bear market’s finale
Cost basis (Realized Price) is essentially the on-chain reflection of holders’ average entry price. Darkfost points out that the STH cost basis has fallen sharply from $112.5k to about $69k, reflecting their process of continuously buying at lower levels and averaging down their holdings. When the STH cost basis crosses below the LTH cost basis, historical data shows that it often marks the bear market entering its tail end, rather than an immediate bottom.
It indicates that speculative short-term holders have sold at losses in large numbers or been washed out, and that coins are shifting toward more steadfast long-term holders. The market has completed a “painful cleansing,” laying a foundation for the next round of accumulation. Conversely, when the STH cost basis crosses above the LTH cost basis, it usually confirms the start of a bull market.
This isn’t mysticism—it mirrors Bitcoin investors’ behavioral patterns. In bull markets, FOMO (fear of missing out) pulls in new capital and lifts the STH cost basis; in bear markets, panic selling pushes it down until equilibrium.
The current cycle is highly similar to prior major down cycles such as 2018 and 2022: STHs buy dips and gradually lower the cost basis to below “active” LTHs. Institutional entry has not significantly changed this underlying behavior pattern—Bitcoin is still driven by the transfer of holdings from “weak hands” to “strong hands”.
9-month stress test: who is holding on, and who has already exited?
Over the past 9 months, Bitcoin has kept trading below the STH cost basis, which is a typical characteristic of bear markets historically.
Recent data shows that younger LTH cohorts (for example, 6–12 months and 12–18 months) are deeply underwater. More seasoned high-conviction holders from the 2–3 year range have a cost basis around $50k, becoming a potential solid line of defense. The 30-day moving average of LTH SOPR (Spent Output Profit Ratio) has fallen below 1, showing that some long-term holders have started realizing losses, though it has not yet reached the level of extreme capitulation. Realized losses have accumulated to nearly $200 billion, which may set a record, but it is also a necessary process for the bottom to form.
Notably, the drawdown magnitude in this bear market has been relatively moderate (about 51%), helped by increased institutional participation and improved market maturity. However, the duration has already entered the upper ranks in history. CoinGecko data shows this is the fourth-longest bear market since 2014.
Does this mean buying the dip right away?
Rationally viewing the signal’s limitations
Darkfost clearly reminds: a signal triggering does not mean the bear market ends instantly. Bottom formation still takes time, and prices may continue to dip further or trade sideways for months. Historical bottoms are often accompanied by more extreme panic, higher realized losses, and deeper unrealized losses for LTHs.
Reference potential support levels (not predictions, just data observation): around the overall realized price (about $50,000–$55k, once viewed as the “ultimate” bear market bottom). Older LTH cost basis. Long-term technical supports such as the 350-week moving average.
Optimistic factors include: whales continuing to accumulate (recent purchases on the order of 2,700 BTC), signs of ETF fund inflows returning, and the long-term growth potential of infrastructure like stablecoins (CZ has also mentioned this multiple times).
Is it a “terminal” signal for DCA strategies? For everyday players, this STH/LTH cross can serve as a reference “end-point” signal for a DCA (dollar-cost averaging) strategy—once the signal is confirmed, gradually reduce or pause mechanical buying and shift to watching for signs that the bull market is starting (when the STH cost basis crosses upward). But any strategy must be combined with individual risk tolerance and diversification—never a one-and-done solution.
Bitcoin’s cycle has never died; it just keeps repeatedly validating human nature: the loop of greed and fear. More institutions have changed the surface liquidity, but the underlying holding/position behavior pattern remains highly stable. That’s exactly where its appeal lies—transparent data, verifiable, and learnable.
Outlook: patience and preparation for the final stage
CZ’s question may reflect what many people are thinking: is the bear market really about to end? Based on on-chain signals, we are in the final stage. But “about to” is a relative concept. History tells us that real turning points often happen quietly when people are at their most desperate.
Action suggestions (for reference only): keep an eye on the STH/LTH cost-basis confirmation window. Monitor whether indicators like LTH SOPR, the scale of realized losses, and MVRV enter extreme bear-market territory.
Keep a long-term perspective: Bitcoin has recovered from every bear market and has set new highs. The market will always be volatile, but cycle rotations never stop. Stay rational and data-driven—perhaps the next bull-market starting point is hidden right here in the current “final stage.”
repost-content-media
  • Reward
  • 2
  • Repost
  • Share
ThisIsTranslateContent::
Go for it 👊
View More
$XAN is preparing to buy the dips and go long more. This coin’s current trend is very strong—just follow the trend. For the entry, you can watch around 0.0124 to 0.01272. On the upside, the first target to watch is 0.013243; if it continues breaking through, then look at 0.013789. Place the defense level at 0.011904. However, be sure to note the risks: currently, the 1-hour RSI is already overbought, so it may first pull back with a deeper correction before continuing to push higher. Don’t let emotions take over and go all-in—manage your position size according to your account. Also, $SNDK a
XAN7.63%
View Original
post-image
  • Reward
  • Comment
  • Repost
  • Share
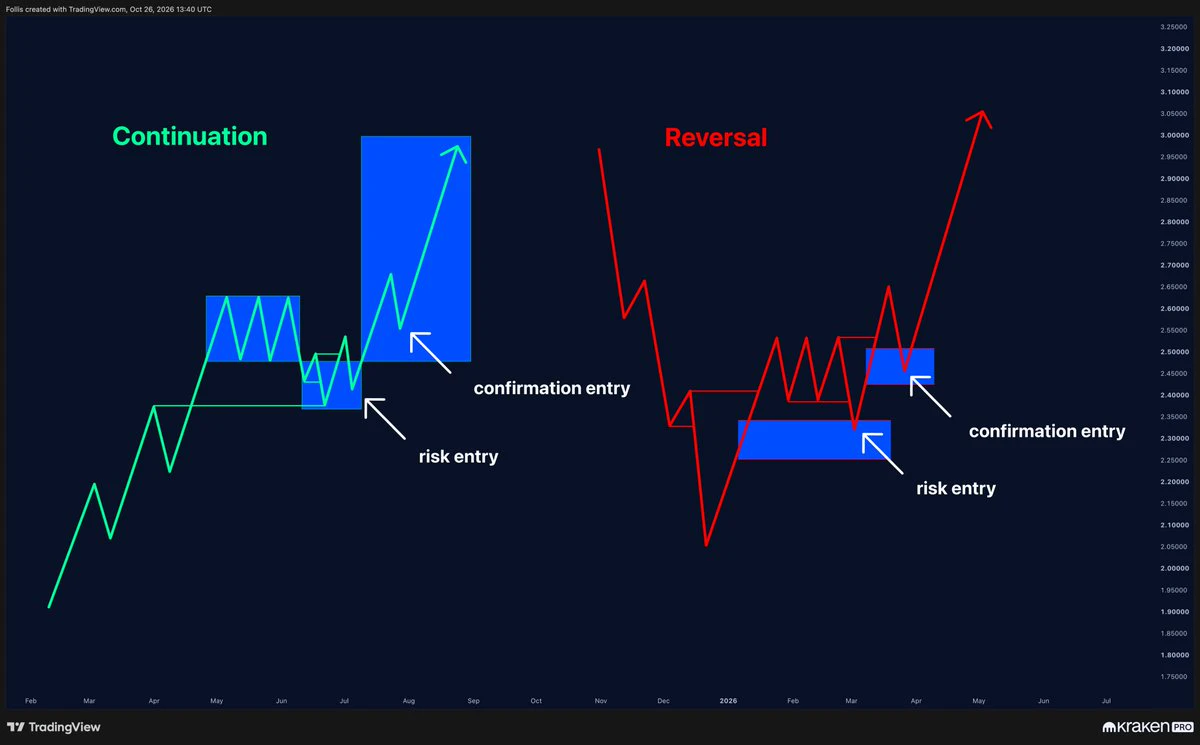
The corn hitting some resistance with NQ and equities meandering on support
Nothing too drastic but some scalp shorts are sitting pretty comfortably now. Mostly shorted $BTC and some weaker alts (look at old posts for recurring favorites)
Next levels on $BTC shared (yes cme)
CORN-0.08%
BTC-0.93%
post-image
post-image
  • Reward
  • Comment
  • Repost
  • Share
💰 $XAN – High Conviction Swing Setup
🔼 LONG
✳️ ENTRY: 0.01050, 0.01000, 0.00950
🎯 TARGETS: 0.01150, 0.01300, 0.01500, 0.02000, 0.02750, 0.03500, 0.04500, 0.06000
🀄️ LEVERAGE: 5x–10x
🔴 STOPLOSS: 0.00930
Chart Insights:
15mins chart
Price is trading above MA7, MA25, MA99, and MA200, confirming strong short-term momentum.
In 1H chart
#XAN has broken above the recent consolidation range and is printing higher highs and higher lows.
In 4Hr chart
Price is approaching the previous resistance zone around 0.0130–0.0135.
If this resistance rejects price, a pullback toward the MA200 retest zone is
XAN7.63%
LIT-1.25%
post-image
  • Reward
  • Comment
  • Repost
  • Share
Ye Shifu’s morning big-bill outlook: the top is at 65,000, with the first target already in hand—once you enter the 1,000-point upside space, there’ll be no bumps; once you’re in, it’s just a smooth ride of green!
After 9 years of trading, I’m increasingly fond of doing one thing:
When others are greedy, remind them of the risks.
Yesterday, BTC at 64,900 was clearly in view.
Not because I like being the contrarian, but because the location is telling me it’s time to be cautious.
The market can’t keep going up forever, and it can’t keep going down forever.
What really matters is whether you mak
BTC-0.93%
View Original
post-image
post-image
  • Reward
  • Comment
  • Repost
  • Share
Latest data shows that among the tokens generated by U.S. companies via model calls made through OpenRouter, about 58% flow to Chinese models—around three times that of mid-January this year.
This March, Chinese models’ share in U.S. corporate traffic first surpassed U.S. models for the first time; in the first week of July, that ratio briefly reached 63%, setting a new high.
Roll the timeline back to early 2025, when across the entire OpenRouter platform, Chinese models’ token share was still below 10%, while U.S. models accounted for about 80%. After one and a half years, Chinese models
View Original
post-image
  • Reward
  • Comment
  • Repost
  • Share
GUSDYieldRisesto3.8%
The Quiet Revolution in Your Wallet: Why GUSD's 3.8% Yield Matters More Than You Think
Stablecoins aren't supposed to do this.
For years, the deal was simple: you parked your USDT or USDC, it held its value, and that was that. No yield, no growth, just digital dollars sitting there like cash under a mattress. The only way to make money was to take risks—lend it out on DeFi protocols, stake it in liquidity pools, or pray your chosen platform didn't get hacked or implode.
Real-world asset tokenization isn't new, but 2024-2025 marked the moment it stopped being theoretical.
GUSD0.01%
USDC0.01%
USD10.01%
RWA0.85%
post-image
post-image
  • Reward
  • Comment
  • Repost
  • Share
#xag #Gümüş formed a wedge pattern in the latest decline wave. When this kind of wedges break, an upward move is expected.
During the rise, around the 60 level can act as resistance and there may be another pullback.
If the daily close is above 63, then—according to the most recent decline wave—we would have seen the first higher high on the daily timeframe, and we would receive a trend reversal signal, suggesting the rally could continue further.
After breaking the 63 resistance, you can track the 67-71-80 resistance levels.
Since there was a close below 56 on the daily, if it cannot
XAG1.19%
View Original
post-image
  • Reward
  • Comment
  • Repost
  • Share
They say that someone said:
I’ll never be able to eat four dishes in my lifetime.
Doesn’t that count?
After this meal, I’ll work twice as hard.
I swear I’ll make $1 million.
View Original
post-image
post-image
  • Reward
  • Comment
  • Repost
  • Share
#夏日創作營
ETH is currently trading at $1,857.46, down 0.66% over the past 24 hours, and up 5.54% cumulatively over the last 7 days. The price is consolidating in a tight range of $1,851–$1,892, with no clear near-term direction. On the fundamentals side, last week saw net inflows of $105 million into spot Ethereum ETFs (led by BlackRock’s ETHA). BitMine continued to increase its holdings to 5.77 million ETH (4.8% of circulating supply). The staking exit queue has dropped to zero, while 2.53 million ETH are still waiting in the queue for staking—these structural buy orders and lock-up forces prov
ETH-0.63%
BTC-0.93%
SOL-0.10%
View Original
post-image
  • Reward
  • 2
  • Repost
  • Share
ThisIsTranslateContent::
Just do it—👊
View More
[New Streamer] Market Prediction
gate liveLIVE
1,098
  • Reward
  • Comment
  • Repost
  • Share
Load More

Join 40 M users in our growing community

⚡️ Join 40 M users in the crypto craze discussion
💬 Engage with your favorite top creators
👍 See what interests you
  • Pinned