Square
Following
Hot
News
Profile
Share your thoughts
placeholder
Article
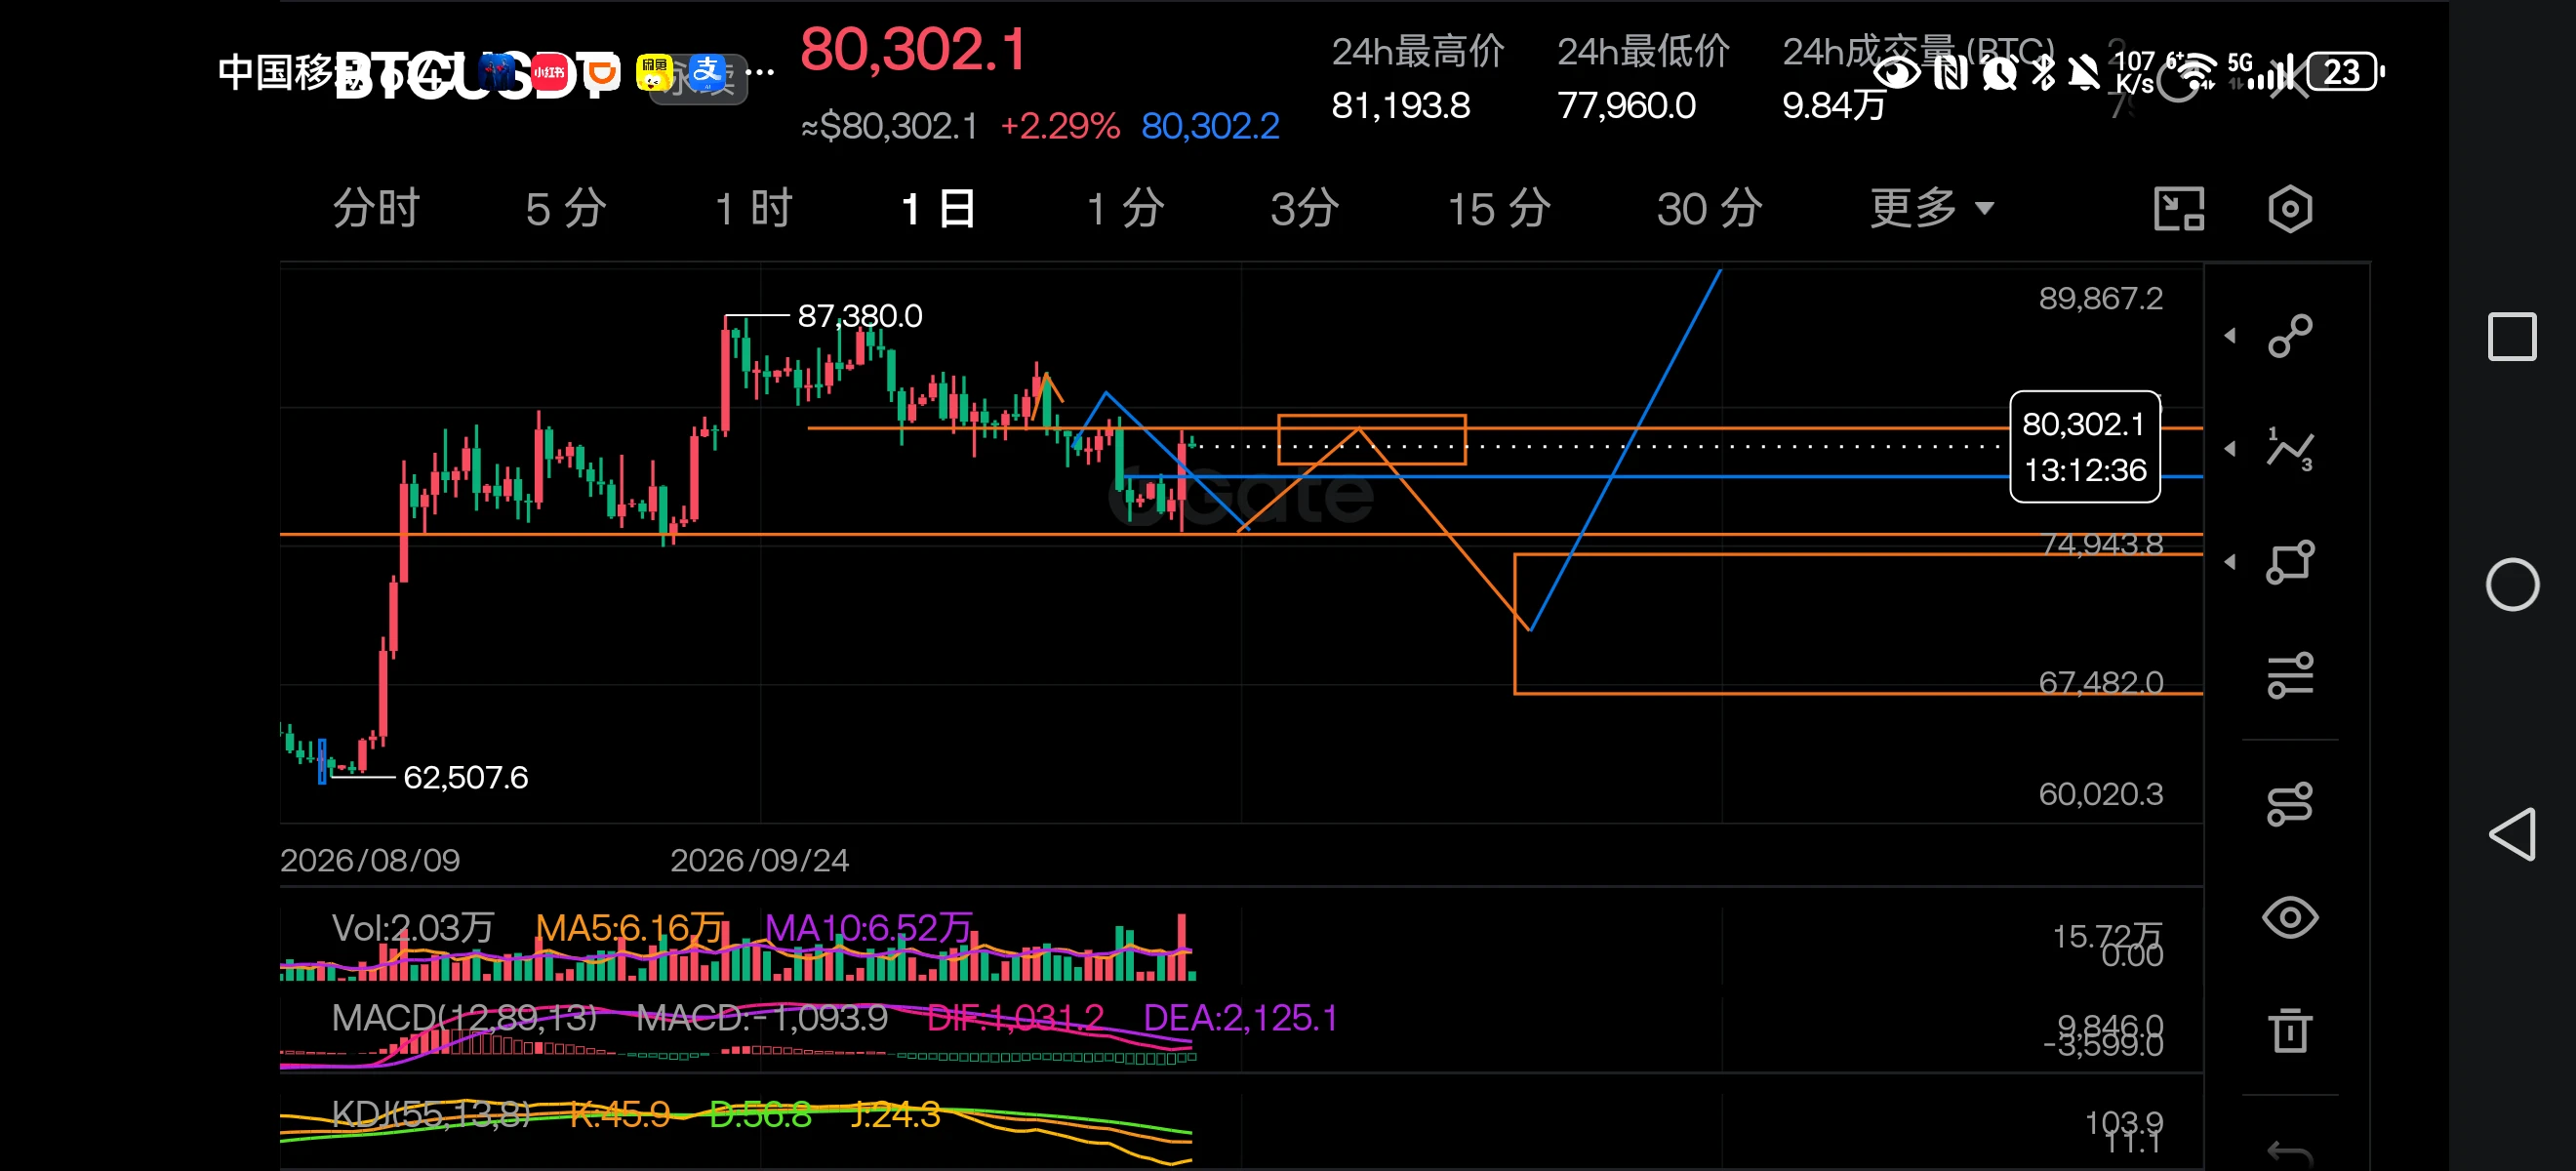
Bitcoin, when you get greedy, I start to panic. The market doesn't lack opportunities; it lacks the patience to wait!
post-image
BTC-0.67%
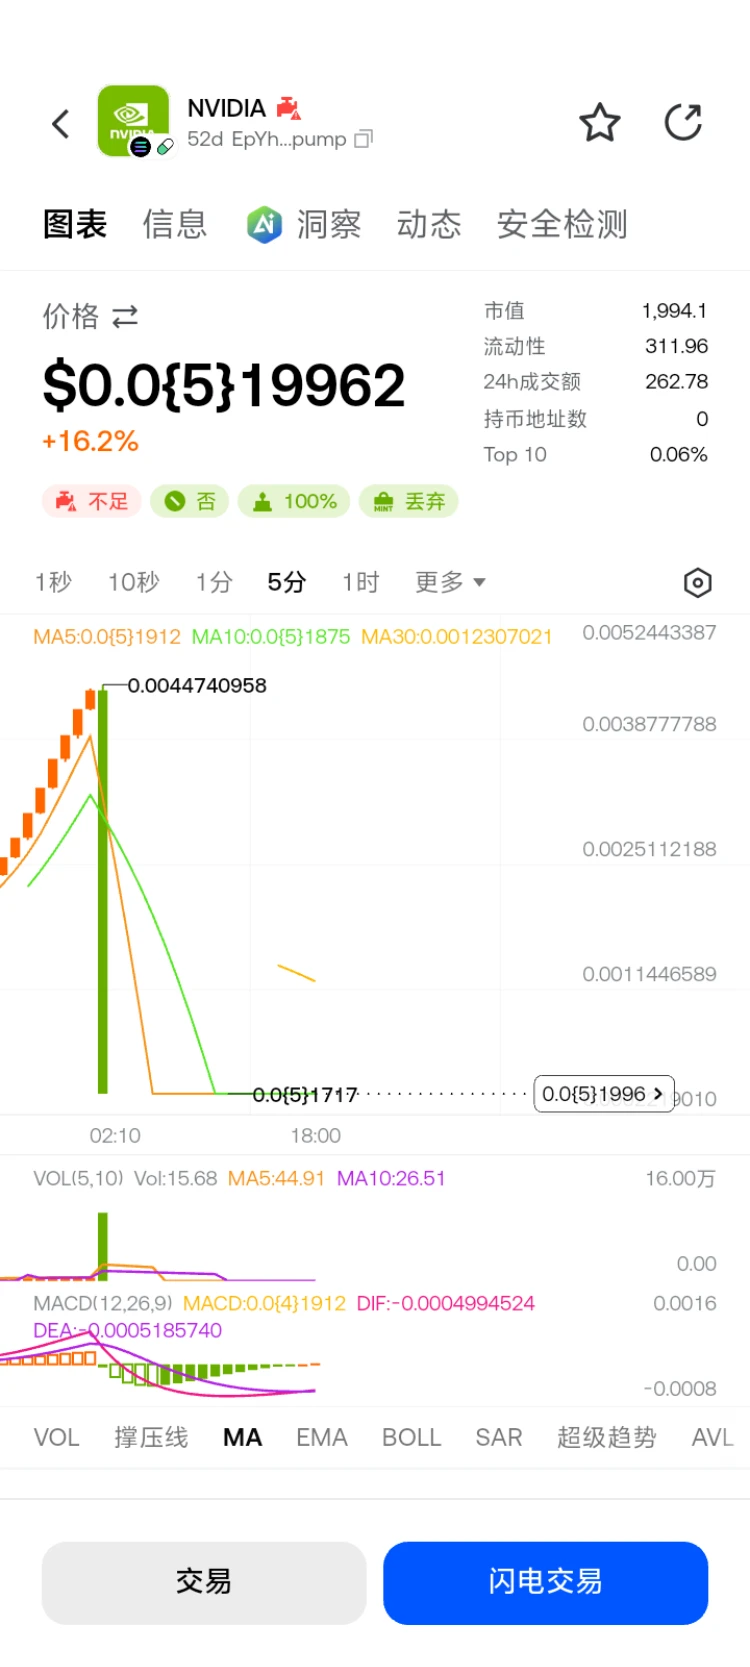
Can this coin still come back to life? It's up 16%😂
post-image
  • 1
Trenches
ZIG
Z
bade
b
ZIG
0x8c...1145
Market Cap
$.
Change
.
24h Vol
$.
Holders
.
BTC
B
bade
b
BTC
C5xp...pump
Market Cap
$.
Change
.
24h Vol
$.
Holders
.
HIGH
H
bade
b
HIGH
7ymF...high
Market Cap
$.
Change
.
24h Vol
$.
Holders
.
STONK
S
bade
b
STONK
6GmA...UNgx
Market Cap
$.
Change
.
24h Vol
$.
Holders
.
CORLA
C
bade
b
CORLA
0xba...7777
Market Cap
$.
Change
.
24h Vol
$
Holders
.
overall market review
live-cover
LIVE1,799
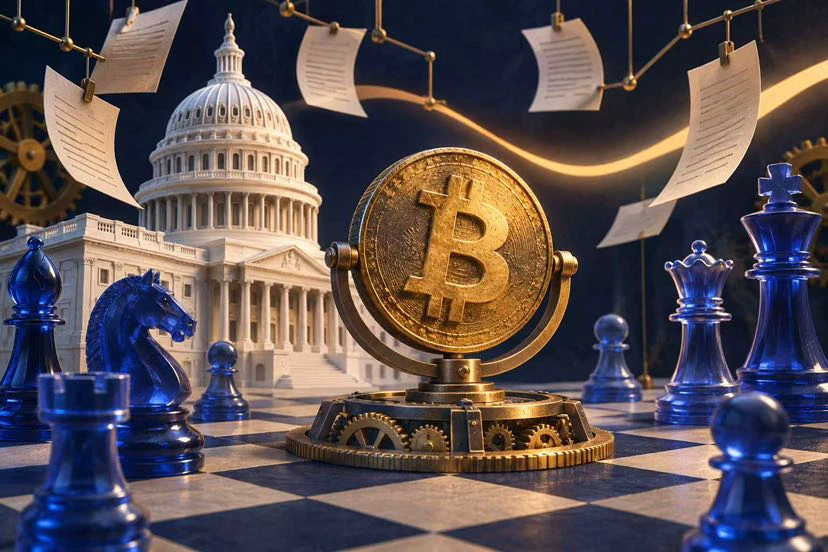
Congress Changes Hands; Crypto Investors Shouldn't Rush to Conclusions
In the same election, Bitcoin fell and then rose. Trading based only on news headlines can easily leave you getting hit from both sides.
After Democrats won majorities in both the House and Senate, the market briefly worried that crypto regulations would tighten. But the November 4 price action didn't keep falling: BTC first dropped below $76k, then recovered its losses, and later that day climbed back above $80k.
There are two details to distinguish. First, the new Congress won't take office until January 2027, so policy w
post-image
BTC-0.67%
Figure 1 shows ETH’s price action, and Figure 2 shows some patterns. Does the triangle in Figure 1 have successively lower highs and higher lows, forming a triangle pattern? Comparing it with Figure 2, which one do you think fits? Isn’t the first one on the left a better fit? Then whether it’s bullish or bearish is obvious, right? 😉 Unless this structure breaks—for example, if the highs keep rising or the lows keep falling, you can’t use this structure to analyze it! 🤭
#eth #BTC
ETH-1.26%
BTC-0.67%
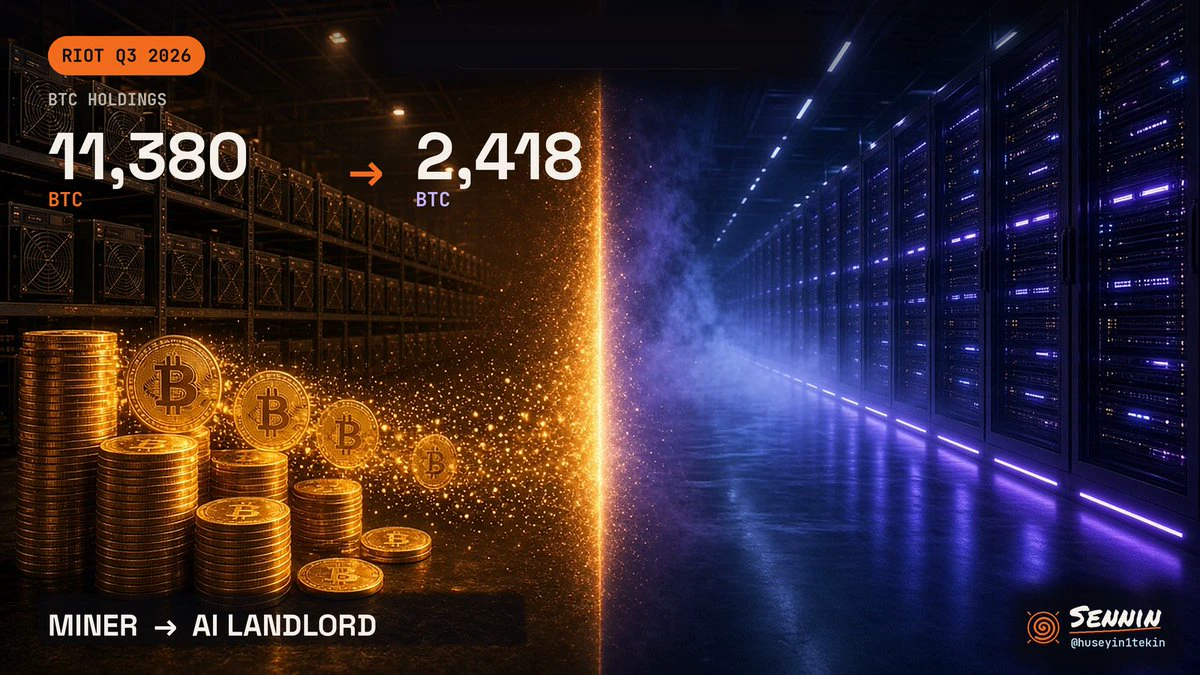
I thought miners would never sell their stack.
Then Riot sold 10,599 BTC in one quarter. Their own report shows mining one coin cost them almost $78.8K with depreciation, while each BTC was worth around $70.9K.
So they sold and signed a $28B AI lease instead.
Which miner flips to AI next? 🫡
post-image
RIOT+9.77%
BTC-0.67%
🎁 100% chance to win! Gate Social Growth Points Lucky Draw #26 is live!
Complete social tasks to earn Growth Points and win up to a 5,000 USDT Position Experience Voucher and a Gate tri-fold keyboard!
✨ Upgraded newcomer benefits: New users can join with no trading volume requirement!
🎯 How to earn Growth Points
1️⃣ Square interactions: Post, like, comment, and share to earn up to 600/day
2️⃣ Livestream interactions: Watch, like, comment, share, and book to earn up to 300/day
3️⃣ Hot topic tasks: Join discussions and share trading cards to earn up to 90/day
4️⃣ Creator tasks: Publish content
post-image
SPCX+0.78%
BTC-0.67%
ETH-1.26%
  • 14
  • 2
$AGENCY Hahaha😂No tears left to cry
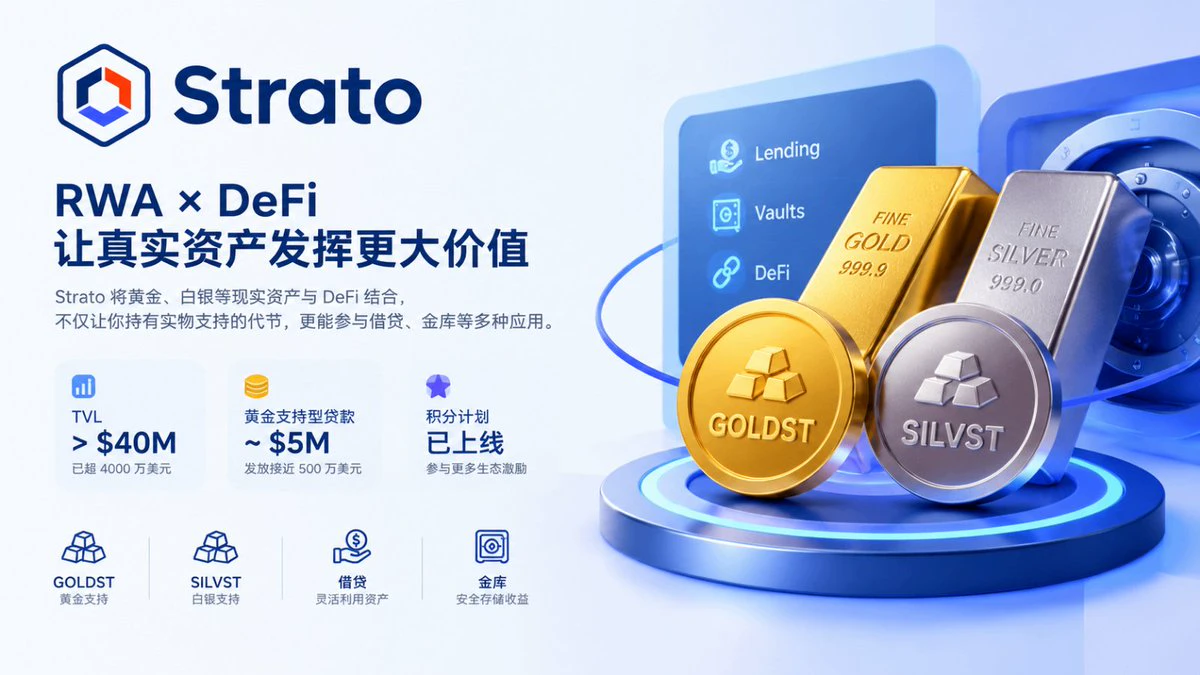
Lately, I feel there’s still a lot to explore in the RWA space.
When people talked about RWA before, they might have first thought of tokenizing real-world assets, but I think simply bringing assets on-chain isn’t enough—how they’re used afterward is key.
I recently came across @strato_net, which combines assets like gold and silver with DeFi.
For example, GOLDST and SILVST are respectively backed by physical gold and silver. Users don’t just hold these assets; they can also participate in lending, vaults, and other applications.
The project has announced that its TVL has already exceeded $40
post-image
RWA-0.39%
GLDX-0.40%
PAXG+0.37%
#黄金突破4100美元 #WCTCS9 Gold prices surge for consecutive sessions, breaking above $4,100. What comes next?
The gold market has finally seen a forceful rebound. After a sharp correction, gold suddenly gained momentum on November 4, rising 3.4% in a single day—its biggest one-day gain since August 19. Buying enthusiasm continued into November 5, with international spot gold climbing further, reclaiming $4,100/oz and reaching a new high for the period since October 20.
As of 15:00 Beijing time on November 5, international spot gold was trading at $4,123.71/oz, up about 1.6% on the day; the December
XAUUSD+1.66%
  • 2
📡 Signal Card | Source: BlockchainBaller
Asset: $AIN Short position | Time: Not specified | Entry: 0.275 | Stop loss: 0.295 | Targets: 0.265 / 0.2602 / 0.245
Funny enough, I reposted this person's $UAI trade earlier today, and here they are again—quite active 👀
I just repost signals; the signal is someone else's, but the wallet is your own. Whether to follow and how small a position to take is up to you all 🫠
For personal record-sharing only; this is not investment advice. #AI Giant Financing Watch: Microsoft and Meta issue a combined $40 billion in bonds.
AIN+3.85%
UAI-7.58%
MSFT+6.76%
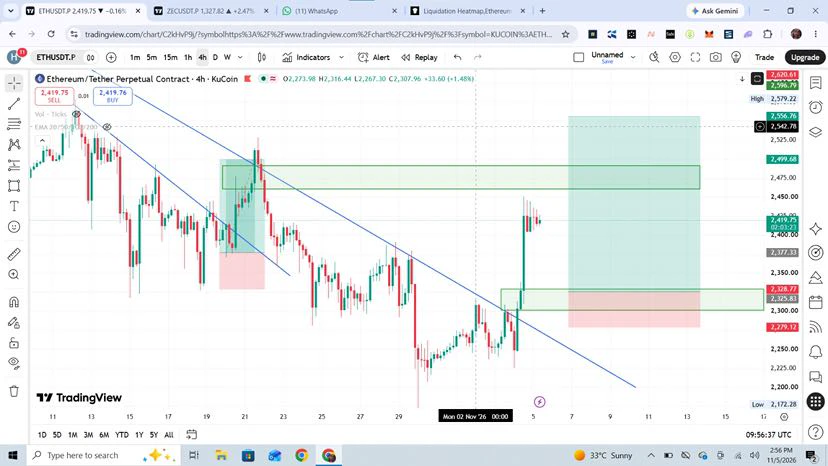
📈 ETH/USDT – LONG SIGNAL
🟢 Entry Zone: 2290 – 2330
➕ DCA: 2240
⚙️ Leverage: 20x
🛑 Stop Loss: 2180
🎯 Take Profit Targets:
- TP1: 2370
- TP2: 2433
- TP3: 2476
- TP4: 2521
- 🚀 Swing Target: 2670
💰 Risk Management: Use only 1% of your total wallet balance.
⚠️ Entry Confirmation: Follow proper entry confirmation before opening the trade.
DYOR – Always manage your risk properly. $ETH ‌
post-image
ETH-1.23%
Day 4 of fully automated quant trading. Check my bio to copy trade.
Special thanks to my first copy-trading user, but with only $10, you can't sync my positions. If you see this message, please adjust promptly. #BTC重返8万
BTC-0.67%
You wanna catch this move on $INJ .
Monthly chart.
Everything else is peanuts 🥜
That's why I say hourly charts in this time of the cycle is for kids.
And not only that you will catch the biggest move. You will also lower your stress for 90%.
Listen to your old LT 💚
INJ-1.67%
🔹Chip Stocks Are Falling, but Demand Hasnt Weakened? With Democratic Regulatory Expectations Shakin
live-cover
LIVE3,282
When you're fleecing others, you're riding high
When you're getting fleeced, worry turns your hair white
post-image
bro was about to give us the RDJ Doom reveal
but remembered he had a roadmap to ship 😭
new mask same task
post-image
#BTC重返8万 #每周来晒 In the short term, U.S. policy and political expectations are the main drivers, leveraged liquidations are the amplifier, and geopolitical developments are a background variable—but the three are not on equal footing: “policy sets the direction, leverage sets the amplitude, and geopolitics sets the mood.”

① U.S. policy expectations: the main theme of this market move

The immediate trigger for this move above $80k was the U.S. midterm elections on November 4. When early vote counts indicated that Democrats might win control of both chambers, the crypto market fell; after Trum
BTC-0.65%
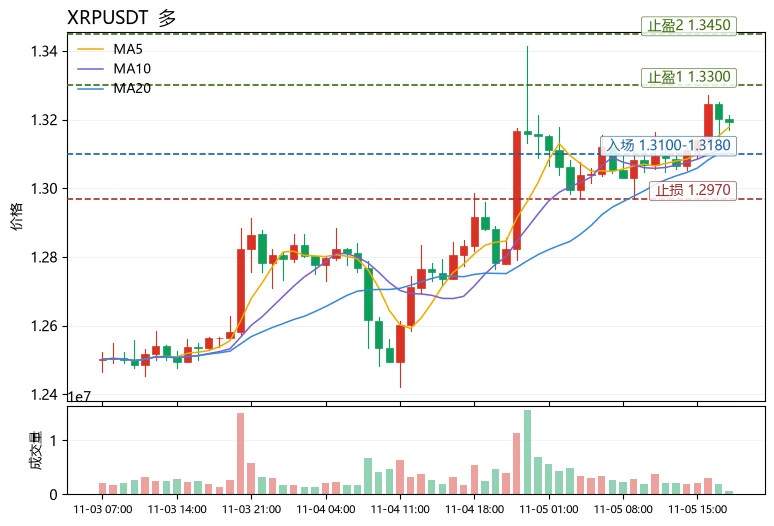
The most unusual detail in today’s market isn’t on the gainers list, but in the structure: $XRP is up just 2.21% over 24h, yet has moved above both MA5 (1.31782) and MA20 (1.31022), with RSI at 63.1, the MACD histogram turning positive at +0.0001704, and the price hugging the upper Bollinger Band at 1.32276—this is a classic case of “modest gains, but strengthening structure.” A comparison makes this clearer: $DOGE is also up 2.25%, but MA5 remains below MA20 and the MACD histogram is negative, making this a weak rebound;
$KORUB is down 18.27%, with the moving averages in a bearish alignmen
post-image
KORUB
KORUBSouth Korea Bull
Four.meme
MC:$3.67KHolders:1
0%
XRP-1.15%
DOGE-0.22%
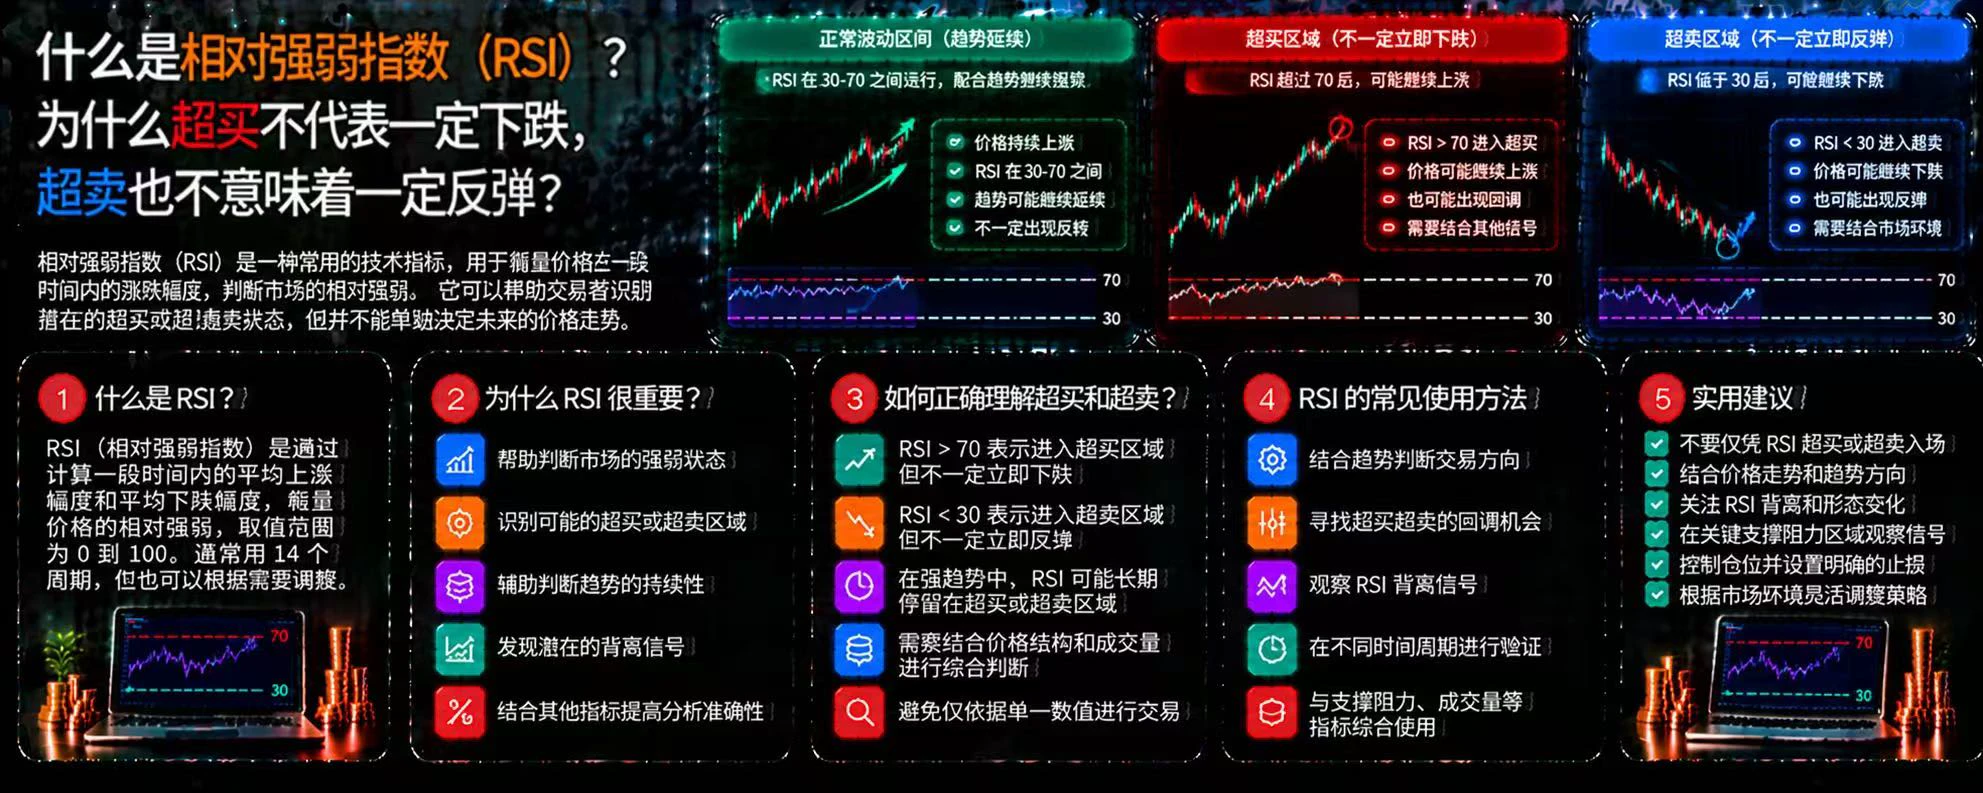
What Is the Relative Strength Index (RSI)? Why Doesn’t Overbought Mean It Will Definitely Fall, or Oversold Mean It Will Definitely Bounce?
In cryptocurrency trading, RSI is a common technical analysis indicator that can help traders observe price momentum. But many people see RSI rise above 70 and immediately go short, or fall below 30 and rush to buy the dip, only to see the opposite of what they expected. The problem is that the indicator reflects market conditions, not an inevitable price reversal.
First, what is RSI?
The Relative Strength Index (RSI) typically ranges from 0 to 100 and mea
post-image
Load More

Join 40 M users in our growing community

⚡️ Join 40 M users in the crypto craze discussion

💬 Engage with your favorite top creators

👍 See what interests you

Trending Topics

GateLaunchesPoSECProofOfSecurity

930 Views465 Discussing

Beyond Proof of Reserves, Gate has introduced PoSEC, a new Proof of Security framework focused on how user assets are stored and protected. By disclosing the distribution of assets across cold storage and hot wallets, users can directly understand Gate’s storage structure and risk coverage under extreme scenarios. Gate’s latest cold storage coverage ratio stands at 104.58%, meaning cold-storage assets alone are sufficient to cover all user assets. PoR verifies whether reserves are sufficient, while PoSEC shows how assets are stored and how risks are covered — together forming a more complete asset security framework. Share your results and experience! [👉 Learn more](https://gate.com/proof-of-security)

BTCBackAbove80K

58.53k Views41.32k Discussing

DemocratsWinBothChambers

21.04k Views467 Discussing

View More