Square
Following
Hot
News
Notifications
Profile
Share your thoughts
placeholder
Article
261117
Until Bitcoin's weekly chart goes underwater, everything is short-term. The market is slightly weak; use stop-losses on both long and short trades!
BTC resistance levels
66050/67218/68126
BTC support levels
63714/62546/61638
Ethereum resistance levels
1853/1886/1911
Ethereum support levels
1787/1754/1729
Place the stop-loss a little beyond the third price
Keep intraday trades under 5% of your position
Livestreams are held in the afternoon and evening. Follow my homepage to find me. #Dr.Han牛津辩论社演讲
post-image
BTC-0.67%
ETH-1.26%
11.17 ETH Trade Setup

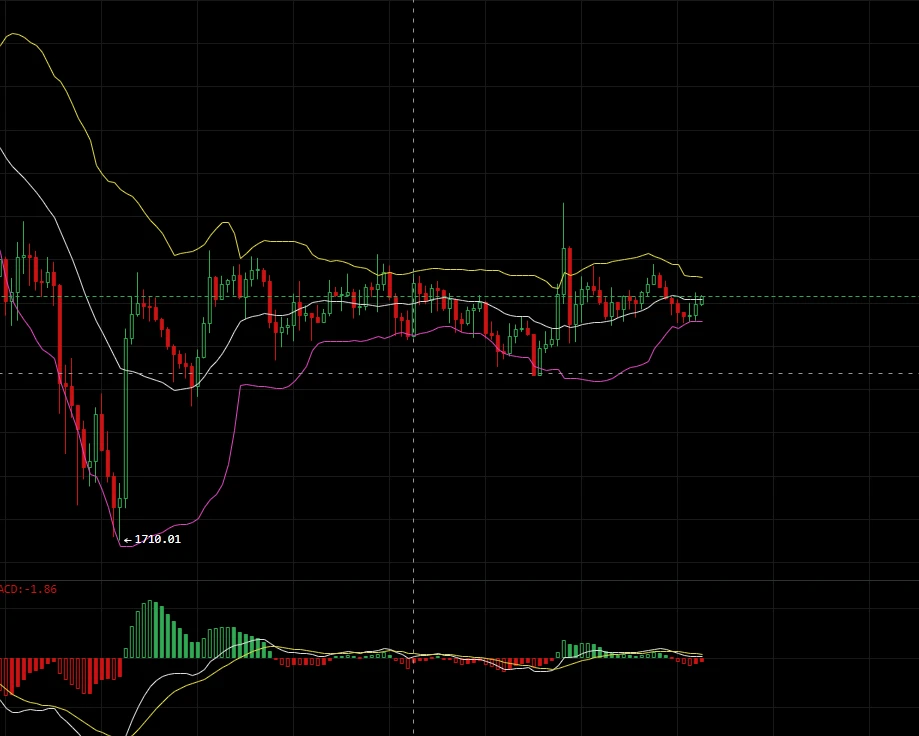
ETH is in a low-level consolidation and recovery phase following a sharp drop. Price is consolidating in a narrow range near the middle band, with the overall structure remaining weak and sideways. Key resistance above is the Bollinger upper band near 1838 and the confluence resistance zone at the previous high of 1855-1865. The primary support below is near the Bollinger middle band at 1811, followed by secondary support near the lower band at 1784. Strong support is around the previous low near 1720.

Entry range: Short near 1850

Stop-loss: 1885 (exit on a confirmed b
post-image
ETH-1.23%
Trenches
BP
B
bade
b
BP
BPxx...jPCy
Market Cap
$.
Change
.
24h Vol
$.
Holders
.
BAWSAQ
B
bade
b
BAWSAQ
4La9...pump
Market Cap
$.
Change
.
24h Vol
$.
Holders
.
mihao
m
bade
b
mihao
4Cxj...pump
Market Cap
$.
Change
.
24h Vol
$.
Holders
.
Marvin
M
bade
b
Marvin
HkRQ...pump
Market Cap
$.
Change
.
24h Vol
$.
Holders
.
GTA6
G
bade
b
GTA6
4kjr...zDnz
Market Cap
$.
Change
.
24h Vol
$.
Holders
.
At the tire shop, the mechanic spun the wheel twice before swinging the hammer, saying he wanted to see which part touched the ground first. After Friday’s close, $EVAA ’s line rose from 2.50 to 3.82, then fell back to 3.31, like a tire making a full rotation, with every side touching the ground a little. Trading volume was 775 million, no small amount.
There was no major macro news this time, but liquidity on the dollar side loosened a little. Money flowed first into Bitcoin, then spilled over into high-volatility assets. The transmission happens in two stages: first, liquidity lifts overall
EVAA-0.49%
BTC-0.67%
  • 1
  • 1
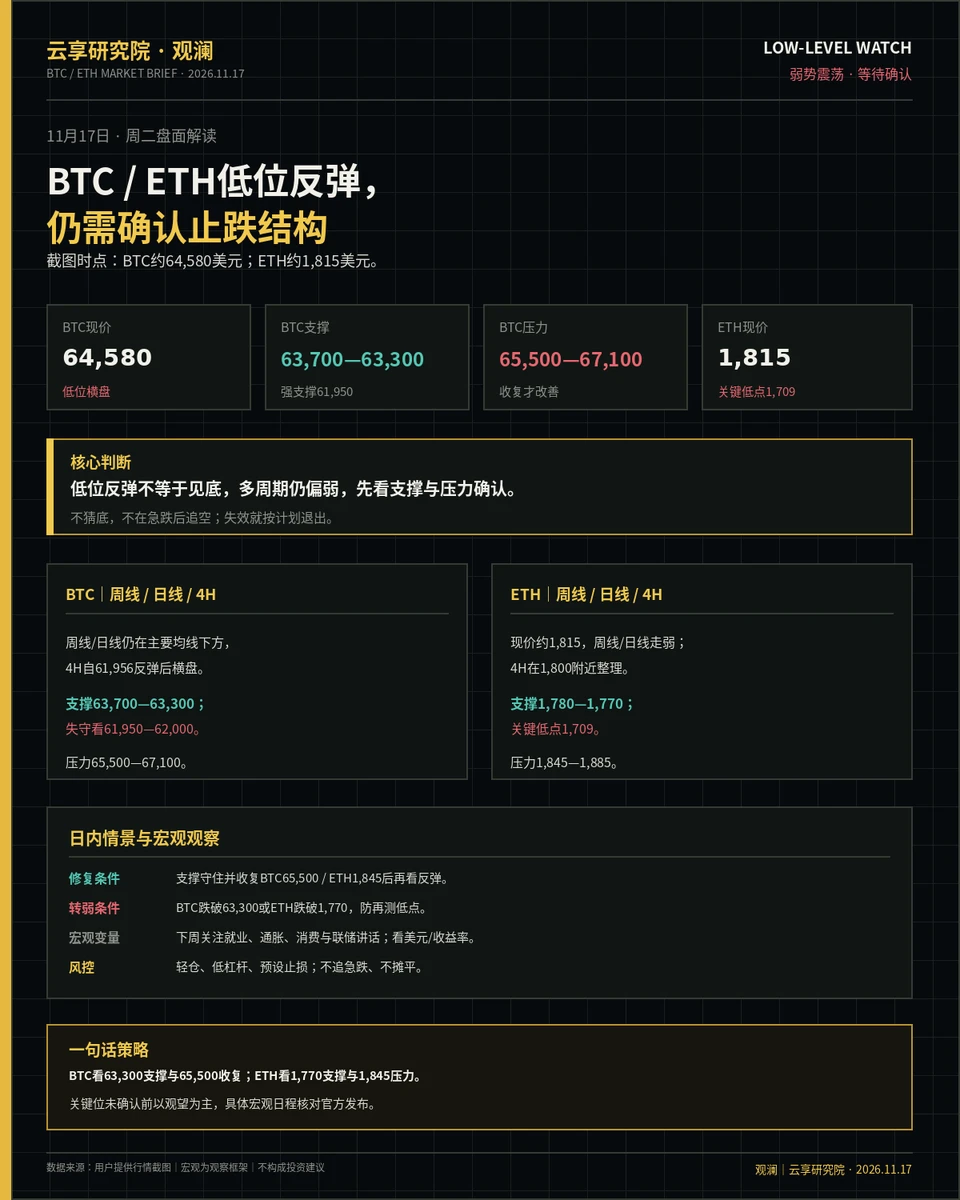
【November 17 | BTC / ETH Market at Lows】
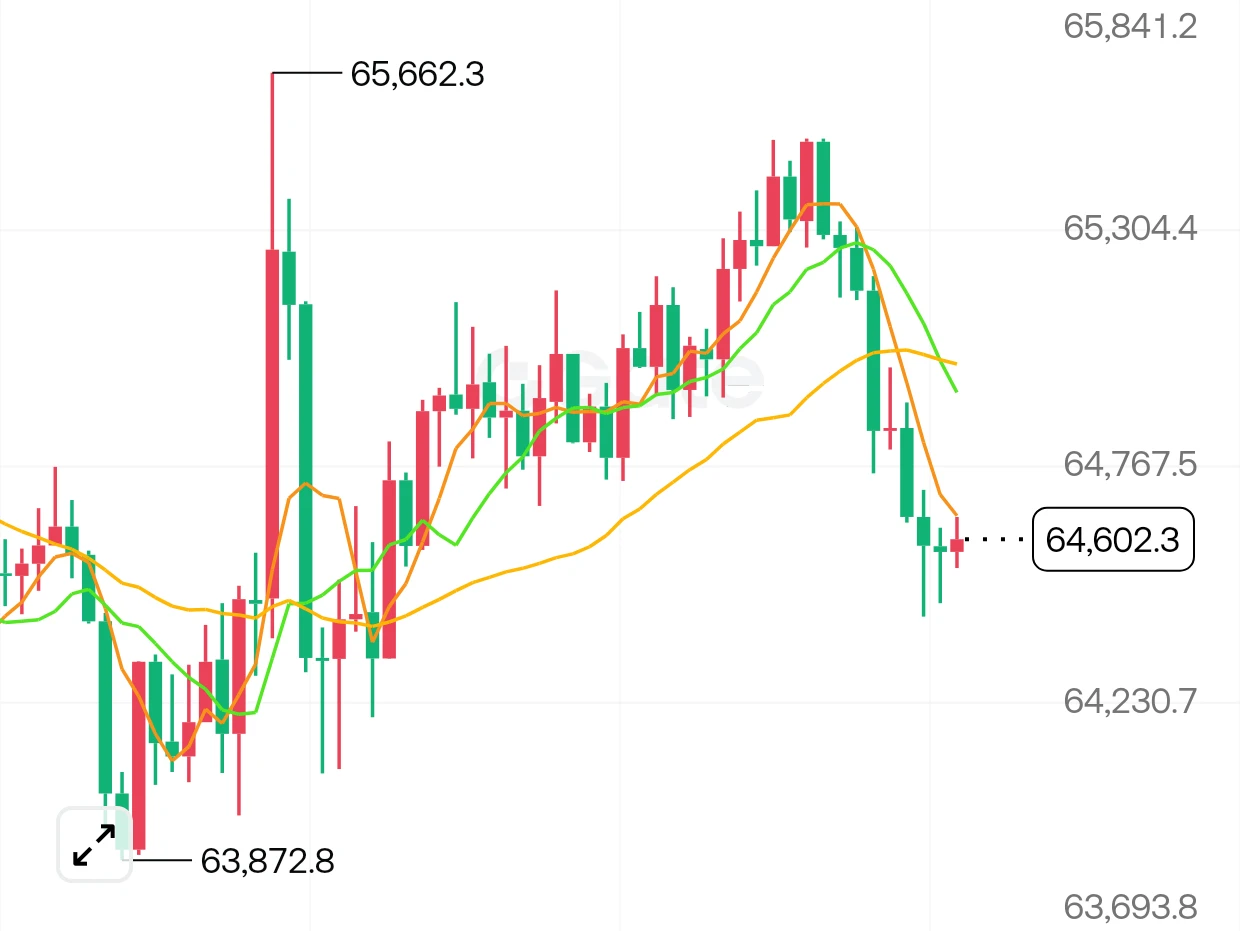
BTC is around $64,580 and remains weak across multiple timeframes: the weekly and daily charts are below major moving averages. After rebounding from a low of 61,956, the 4-hour chart is moving sideways but has yet to reclaim the 65,500–67,100 resistance zone. Near-term support is at 63,700–63,300, with strong support at 61,950–62,000. A move back above 65,500 would confirm a recovery; a break below 63,300 could lead to another test of the lows.
ETH is around $1,815. The weekly and daily charts continue to weaken, while the 4-hour chart is consolidating
post-image
BTC-0.67%
ETH-1.26%
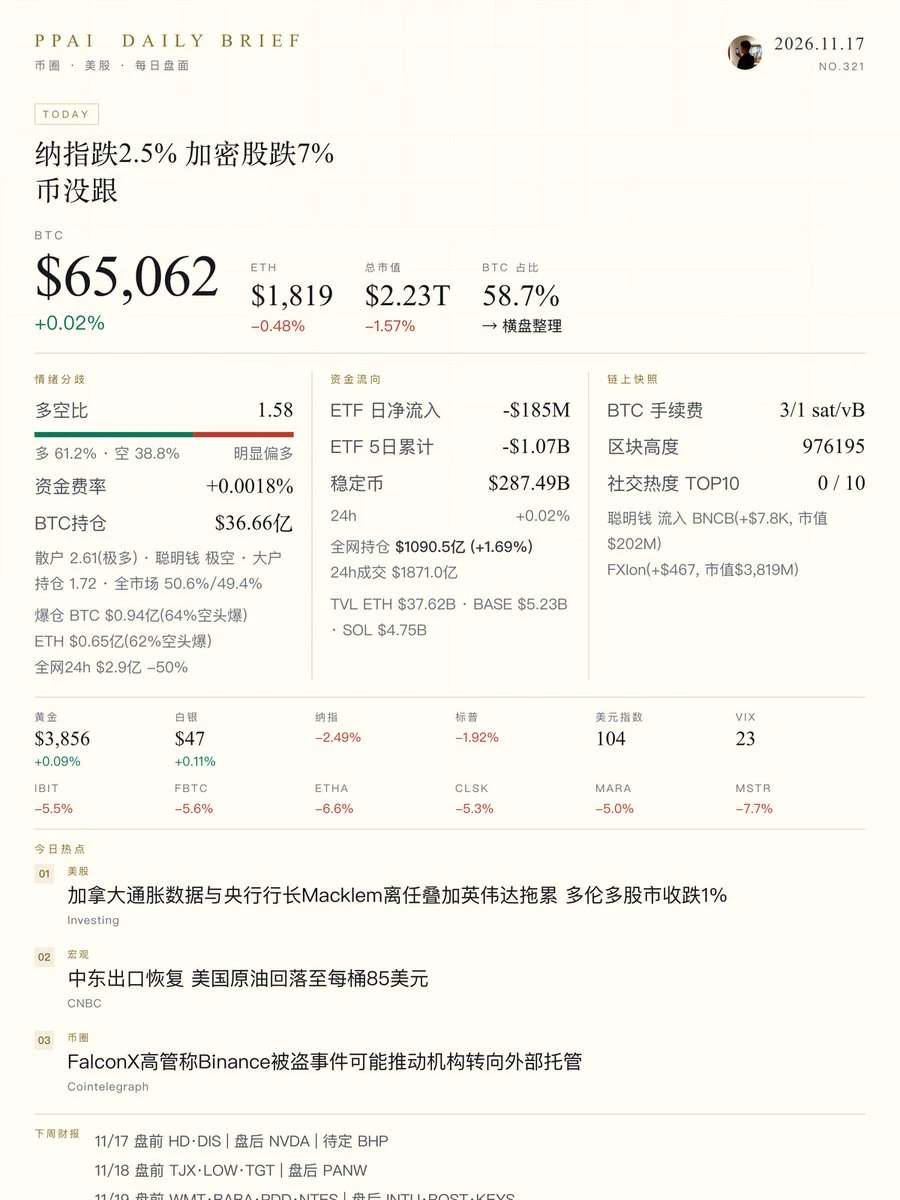
Spot positions are unwinding; futures positions are piling up.
ETFs have seen net outflows for five straight days, while aggregate futures open interest keeps rising.
Retail traders are all long; smart money is extremely short.
post-image
150k people sign a joint appeal for Jensen Huang to return! Elon Musk and Tom Lee are taking sides—c
live-cover
LIVE2,208
Why hasn’t OpenAI’s stock guru lost it all yet? That’s why it keeps grinding lower—painful
post-image
OPENAI-0.04%
11.17 SOL Analysis

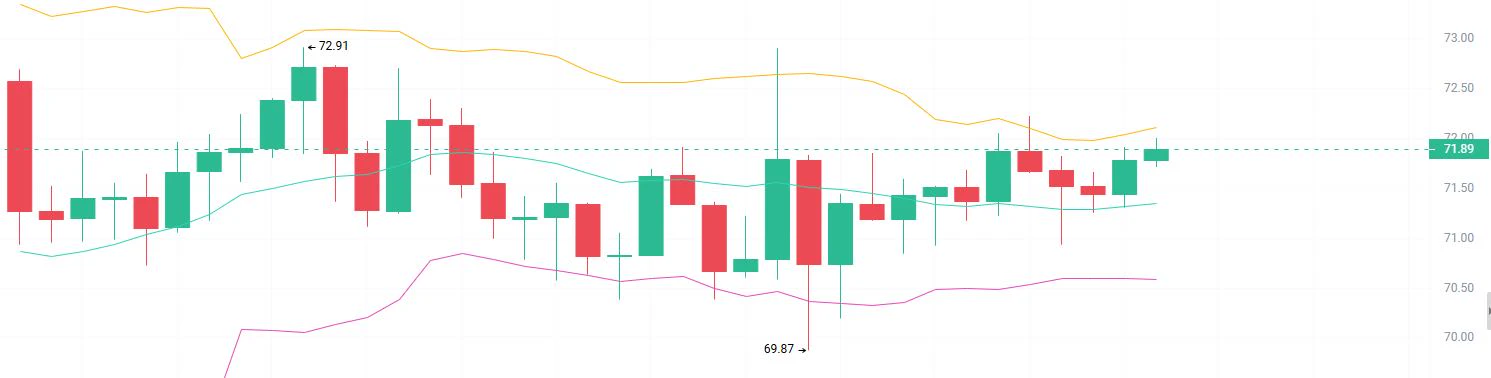
Analysis: Short on a rebound near 72.5-73.2, with a stop at 73.8, first target 71.0, and second target 70.0

On the 1H chart, the current price is 71.95. In terms of market structure, the rebound began at the low of 69.87, climbed to a swing high of 72.91, then pulled back. Price subsequently fluctuated repeatedly within the 71-72.5 range. Recent candles have alternated between bullish and bearish, with large bullish and bearish candles appearing frequently, indicating intense competition between buyers and sellers and an unclear short-term direction. Short-term bearish mom
post-image
SOL-0.77%
11.17 Market Analysis
BTC short-trade strategy reference
Entry range: short around 64800—65400
Stop loss: 66000
First target: 63900, second target: 62500
Low-level sideways recovery; watch the middle-band resistance on the rebound first
On the 4-hour timeframe, the current price is between the Bollinger middle and lower bands. After retreating from a high of 70180 and bottoming at 61950, the price has shifted into a low-level sideways recovery, with the Bollinger middle band acting as short-term rebound resistance.

The RSI readings for the three periods are 37.6, 33.8, and 31.8, respectively.
post-image
BTC-0.65%
ETH-1.23%
Would you look at that, the timeline has already fully flipped bearish in a very short time, which means the next to get humbled by the market will be the bears. You guys know the macro plan we had, expecting this pullback to happen as Bitcoin will remain neutral to bullish above 50/60k without breaking down, but neither breaking out on a multi year scale until ETF funds reaccumulate enough supply leaving Bitcoin irrelevant while other asset classes in crypto become more attractive.
I hoped this pullback would come after the next FOMC in December, but I was wrong and it came earlier than expec
BTC-0.67%
ETH-1.26%
What exactly is the Fed watching? How much weight do retail sales data carry in the rate path?

The reason retail sales data are “scary” is not that they are inherently so important, but that the Fed treats them as one of the key pieces of evidence for deciding whether to continue tightening or keep rates high.

The Fed’s current target rate range remains at the relatively high level of 3.75%-4.00%. According to the latest dot plot, the median projection among officials is just one rate cut of 25 basis points for all of 2026, followed by another cut in 2027. But there is significant internal d
SPCX-1.25%
$BTC Active addresses on-chain have fallen 8% in three days—that’s a pretty interesting change. Roughly estimating from the recent average of around a million active addresses per day, that means 70,000 to 80,000 fewer addresses interacting on-chain over three days. It suggests both short-term capital and regular users are cooling off; it’s not just a matter of price fluctuations. What’s more, options expiry has coincided with the so-called “doomsday expiry.” Short-dated options nearing expiration are settling all at once, and once market makers close out the gamma positions they were using to
post-image
BTC-0.67%
ETH-1.26%
  • 2
  • 1
Bro I got the ravens tn…even tho their starting QB is out
post-image
🐋🚨🐋 WHALE ALERT | 3-Year Dormant Entity Moves $2.45M in $ETH to Coinbase

An OG whale has just woken up. According to on-chain tracker @ai_9684xtpa, three addresses belonging to the same entity deposited 1,350 ETH (worth ~$2.45M) to Coinbase just 9 hours ago.

📊 The Historical Context
• Dormancy: The funds have been sitting untouched for nearly 3 years.
• Entry Price: Withdrawn from an exchange in Dec 2022 at an average of $1,271 per ETH.
• Diamond Hands: They held through the massive bull run, never selling even when ETH surged past $4,500.

🤔 Why Move to a CEX Now?
• Profit Taking/Capi
post-image
ETH-1.26%
🔹Rumors of Jensen Huangs Return Send Nvidia Shares Surging Over 4 in Dark-Pool Trading! Is This a G
live-cover
LIVE2,104
$SOXL ’s hourly chart flashed an RSI oversold signal, so I decisively entered for the rebound. After momentum shifted, the price made a clean 56% move up, and I locked in profits. This pattern is worth monitoring; next, I’ll focus on whether $BTC and BLESS show similar oversold reversal setups.
I remain bullish on the long thesis for $SOXL , and the trade plan is ready: entry zone 47.46–48.53, first target 50.69, second target 52.85, with a stop at 45.56. Bottom signals are already fairly clear, and a rebound could begin at any time, so it may be worth being a little more aggressive.
That sai
post-image
161
161161
Pump.Fun
MC:$2.19KHolders:2
2.08%
SOXL-1.16%
BTC-0.67%
$HUMA Persistent failed breakouts will inevitably trigger a cascade! Keep shorting, target 0.0084! Sit back and wait to profit from the cascade!
post-image
HUMA-1.99%
BNB long signals continue to build.
The market has once again delivered a textbook response—all four long positions landed, and the profit curve went straight to the top:
$BLESS — Long position with 40x leverage, netting +1,222.59%$SPACE — Long position with 50x leverage, taking in +777.70%$CROSS — Long position with 40x leverage, bringing in +578.22%ICP/USDT — Long position with 75x leverage, securing +444.63%
The timing was spot-on, execution was decisive, and the profits speak for the strategy. Position management stayed on point, discipline never wavered, and more opportunities lie ahea
post-image
BLESS-2.00%
SPACE-1.66%
CROSS-0.13%
  • 1
One of the easiest draws of the year this week.
post-image
Load More

Join 40 M users in our growing community

⚡️ Join 40 M users in the crypto craze discussion

💬 Engage with your favorite top creators

👍 See what interests you

Trending Topics

Dr.HanOxfordUnionSpeech

327.2K Views1.7K Discussing

Gate Founder and CEO Dr. Han delivered a “Start Alone” speech at the Oxford Union, reflecting on Gate’s 13-year journey and sharing lessons on resilience, team building, and opportunities in the AI era. He also introduced the “Boss + AI” model, highlighting how AI is reshaping information access, learning, and everyday productivity. What do you think is the most important skill for entrepreneurs in the AI era? [👉 Full Report](https://www.odaily.news/newsflash/534012)

GateIPOAccessAnthropic

429.4K Views3.1K Discussing

ANTPreMarketFuturesNowLive

353.3K Views3.6K Discussing

View More