
Square
Following
Hot
News
Profile
Share your thoughts
placeholder
Article
Ledger response to the recent supply chain attacks: $899 pls. Ps don't drop it
post-image
Besides $BTC
, which cryptocurrency is most suitable for long-term holding?
● $HYPE ● $TAO ● NEAR
post-image
BTC+0.94%
HYPE+1.66%
TAO+2.94%
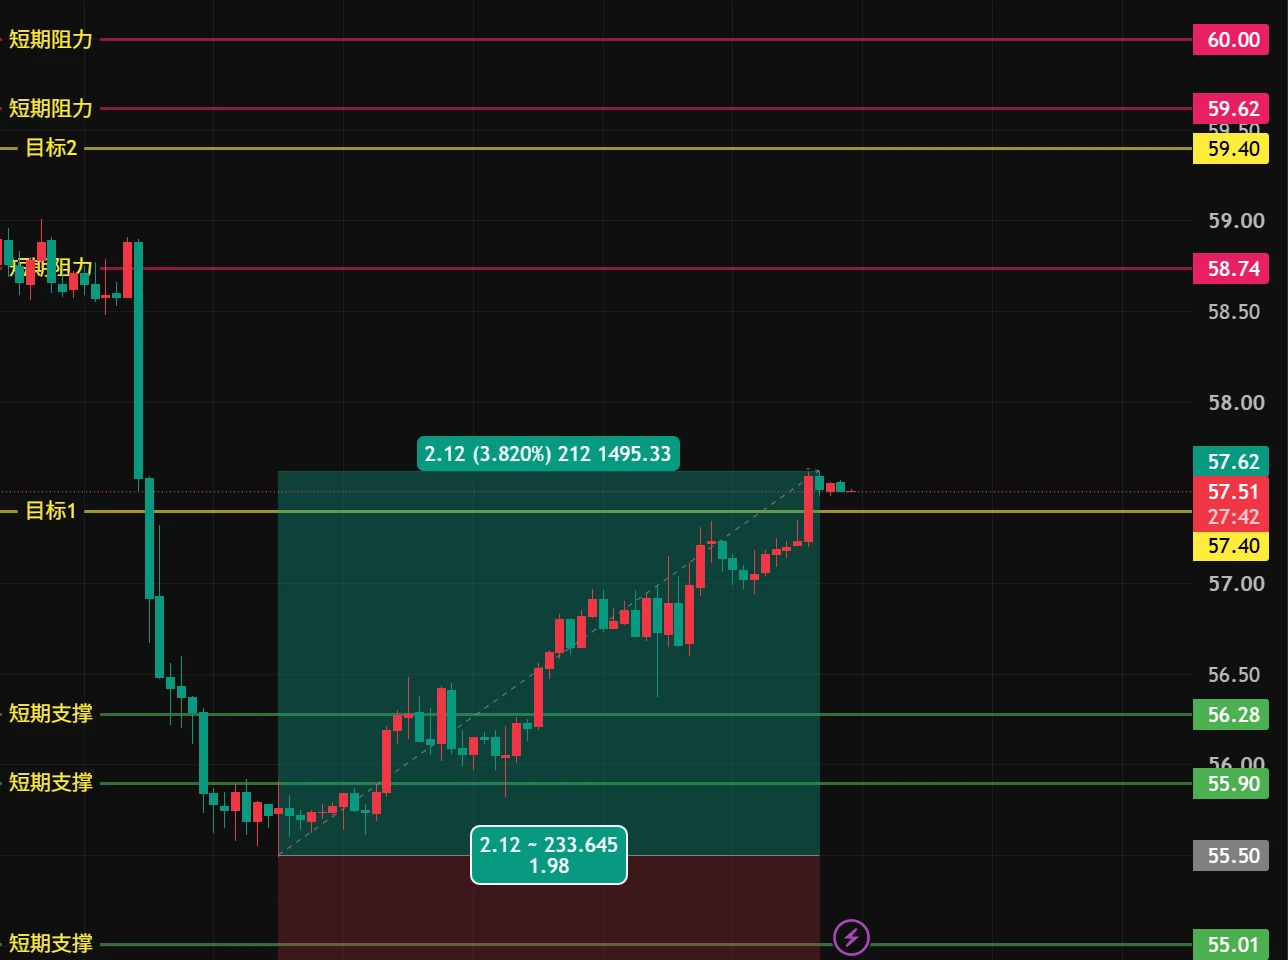
Silver surges! From 55.5 to 57.6. Completed ✅ target 1, up 3.8%. Short sellers, keep it up 💪 Dump it down with all kinds of selling pressure so I can go long lower 🤭 #XAG $XAG
post-image
飞鱼2026祝福版
Latest Silver Strategy!!!
XAGUSD+3.19%
$OP
This move is pushing from 0.1397 toward 0.1418, up more than 13% over the past 7 days, while open interest is piling up as longs keep adding and driving it higher🚀 The wildest part is that shorts are effectively paying to stay in, having to hold on while funding remains negative. The pressure isn’t a bad thing—it’s an early-entry position. Break through 0.1418 and jump aboard.
post-image
OP+0.27%
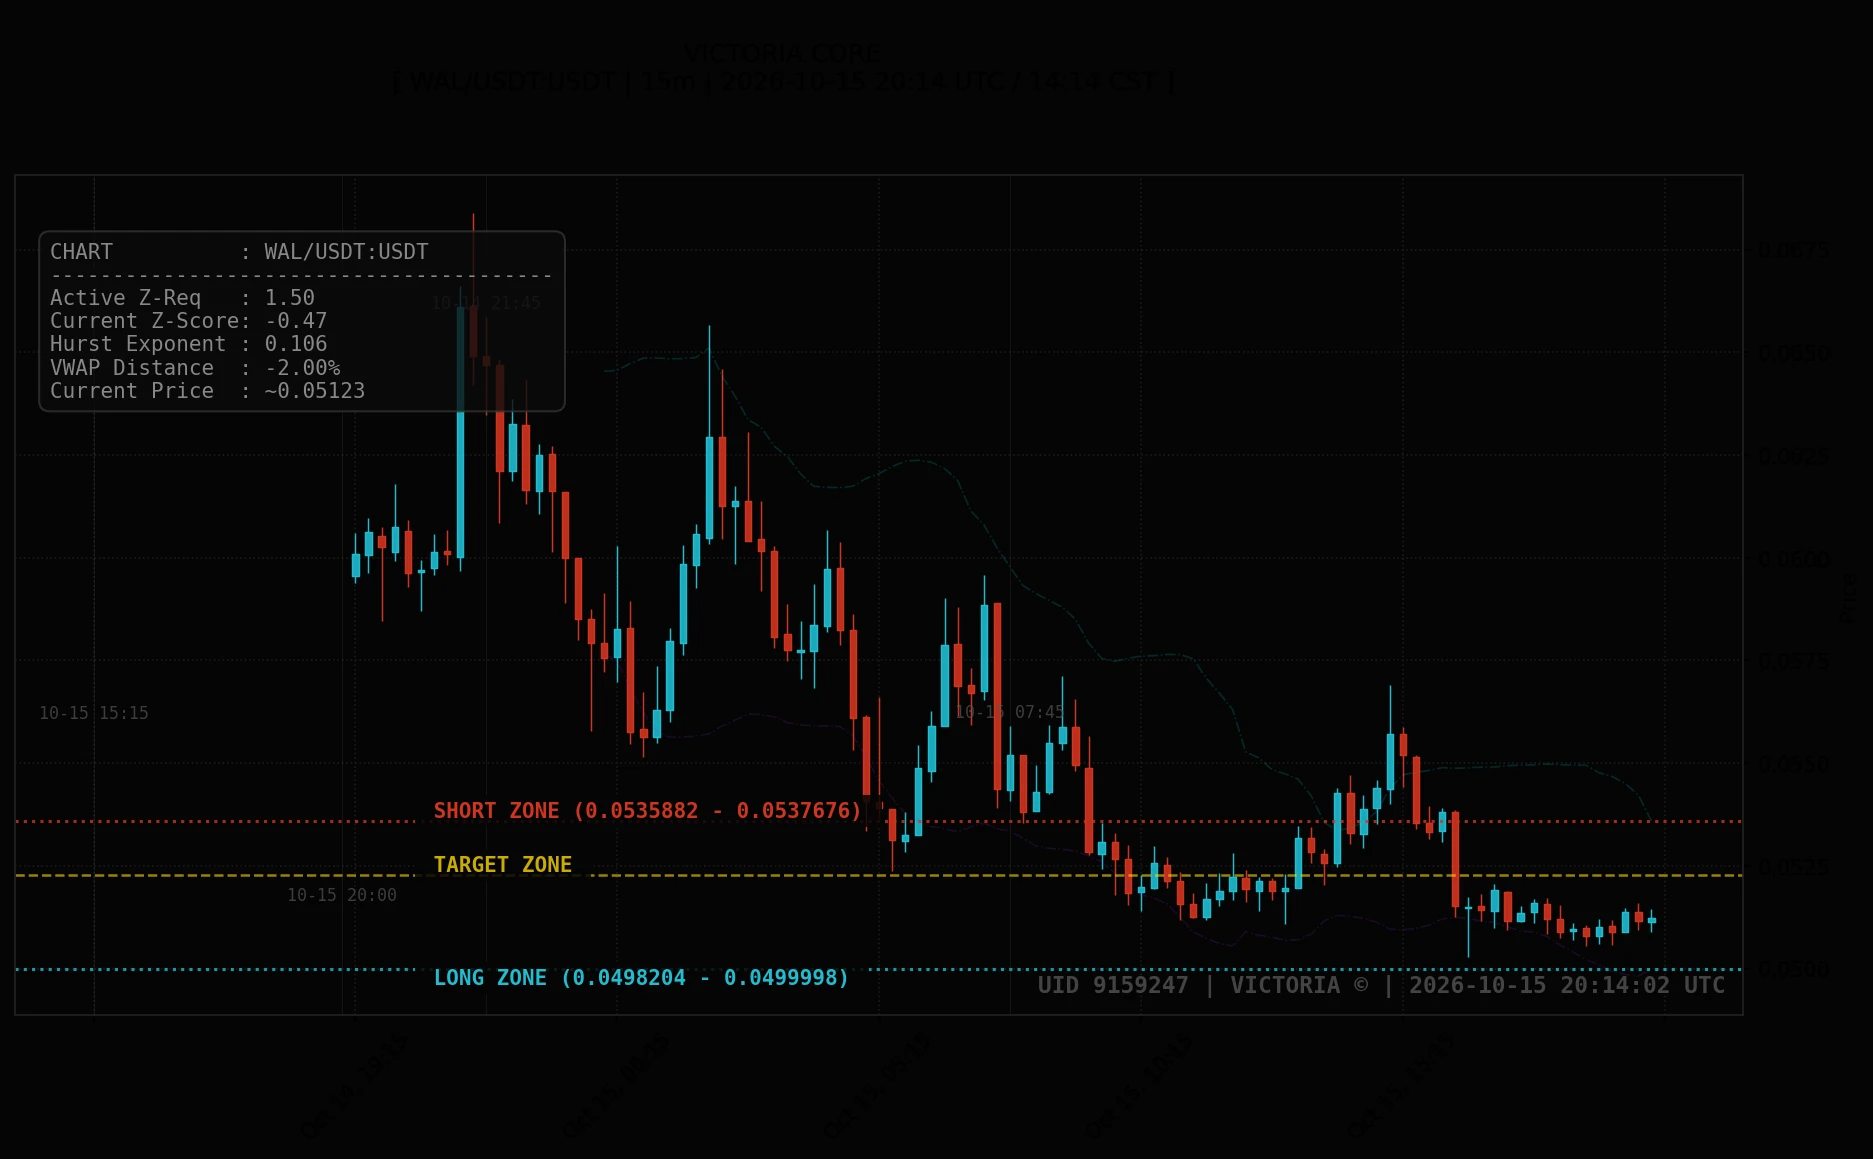
2026-10-15 20:14 UTC. Following clean target completions on BTC and SOL in the previous session, WAL/USDT rejected off its upper boundary and pulled back -4.87% from its 0.05385 peak. Price now sits around ~0.05123 USDT, resting in the lower third of its range just below its central equilibrium. Upper resistance is mapped at the SHORT ZONE (0.0535882 - 0.0537676 USDT), while lower demand holds the LONG ZONE (0.0498204 - 0.0499998 USDT) around the primary TARGET ZONE at ~0.052276 USDT. AKE/USDT also holds a clean structure (SHORT: 0.0367231 - 0.0370425 | LONG: 0.0300153 - 0.0303347 | TARGET: ~0
post-image
BTC+0.94%
SOL+1.25%
WAL-19.52%
AKE+18.84%
SNXX+0.52%
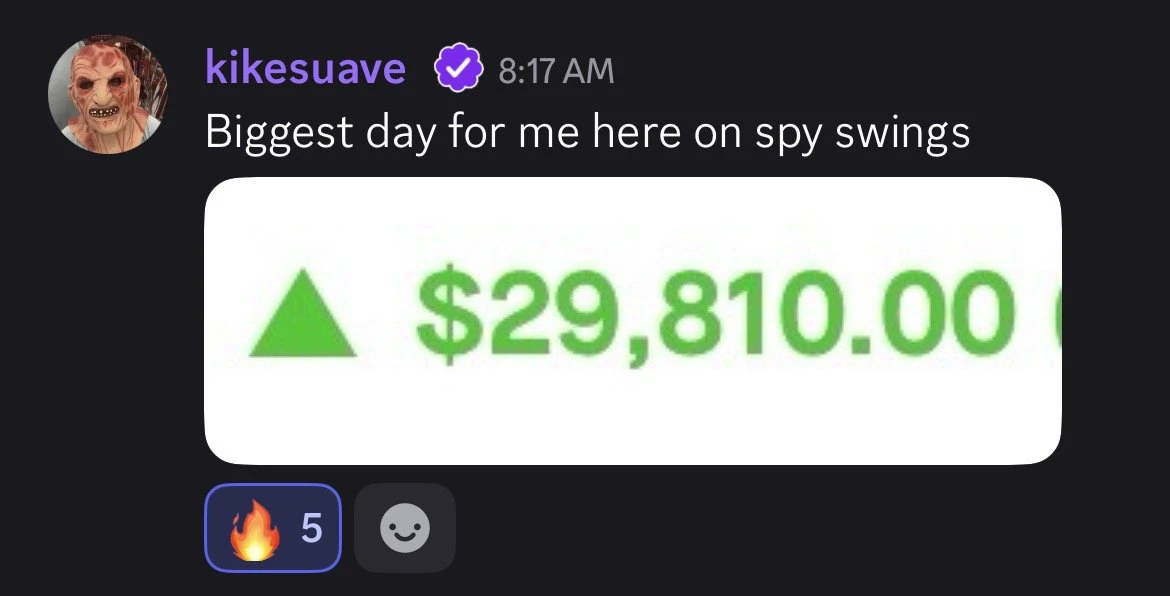
Member just had a $30k day...
I love teaching this group 🙏🙏
post-image
CPI Comes in Hotter Than Expected
live-cover
LIVE20
The answer is always hidden in the process that time brings. I’ve already made it extremely clear—the hints have been laid out plainly. Since June, it has felt exactly like hitting whatever I aim at and winning every battle; there’s only one word for it: “awesome”!
$BTC #美国9月CPI超预期
BTC+0.96%
In this $ZRO move, which step is easiest to be fooled by?
When I looked at $ZRO again, I first covered up the 24-hour +9.37%. It’s not that this number is unimportant, but it is too good at grabbing attention. What really needs explaining right now is that after $ZRO’s sharp 24-hour rise, momentum and continuation are not the same thing. I won’t extrapolate the large move that has already happened into the next leg; I’ll first see whether the price can hold in the new range.
The most convenient—and easiest to get wrong—reading is that the gainers and losers list records the past, while the mo
post-image
ZRO+9.15%
elysium will be a lot of fun
you can already invest in elysium by accumulating kinetiq:native and nest-2:native
post-image
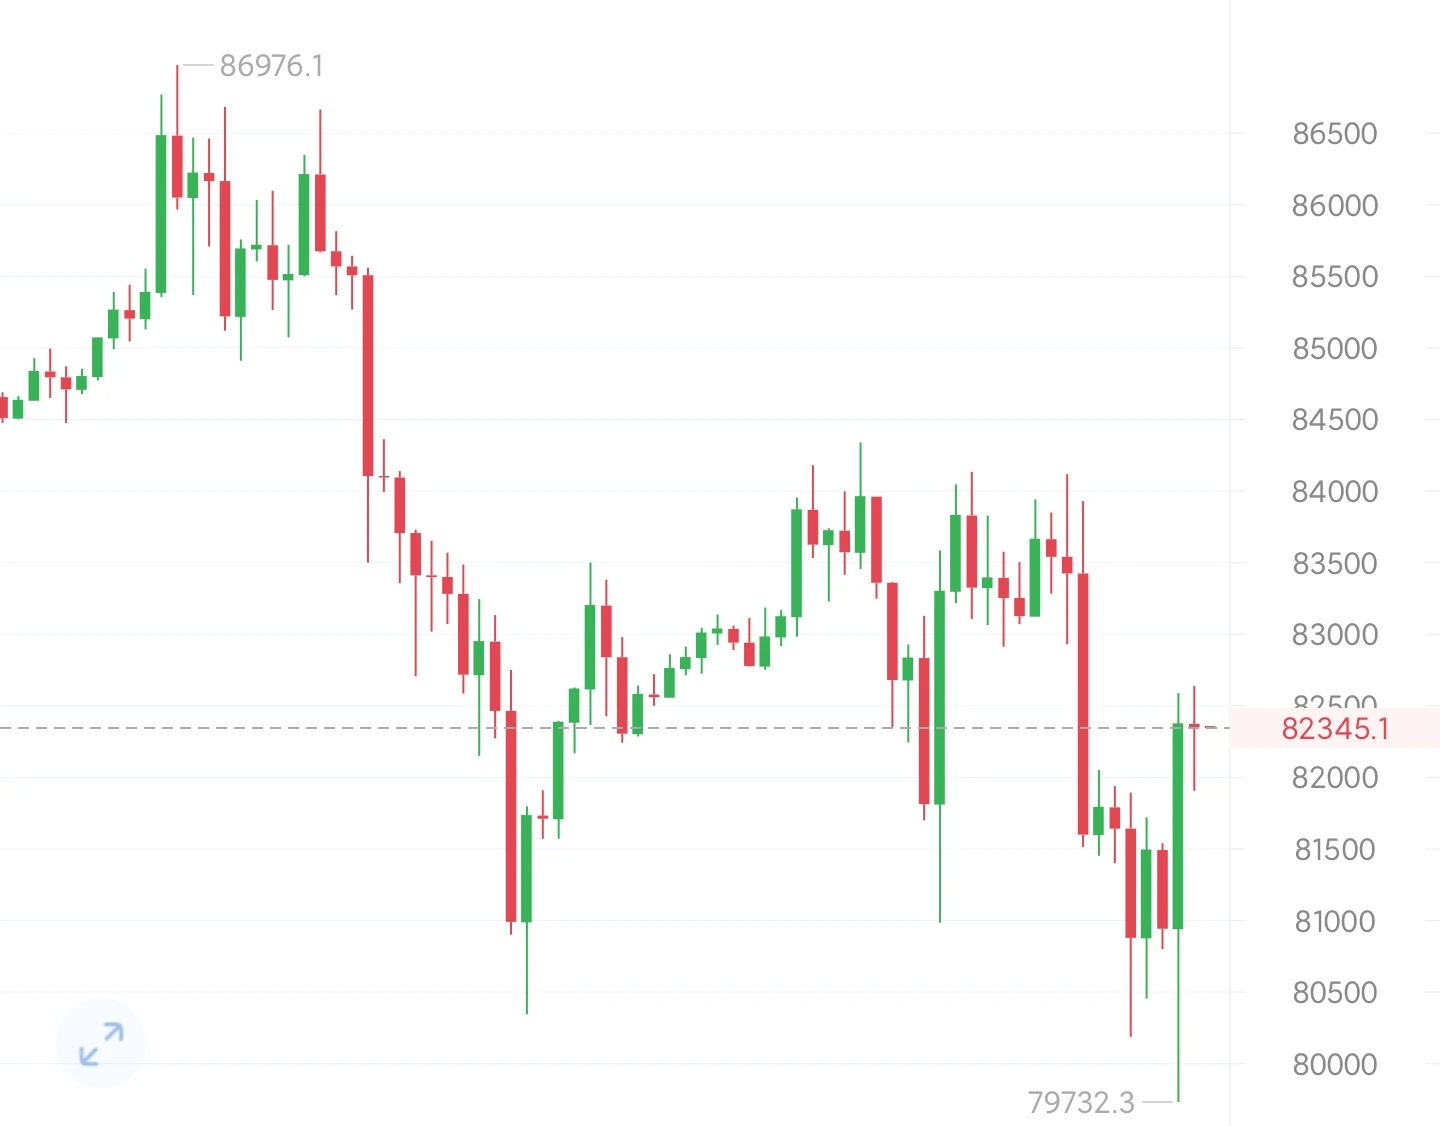
BTC is currently around 82400; after the previous pullback, it has staged a short-term corrective rebound, but the upside follow-through is weak. This is a technical recovery after the decline, with no trend reversal signal appearing for now. The broader structure remains range-bound with a bearish bias.

On the 4-hour chart, the price is below the moving averages, and rebound volume is insufficient, indicating a weak consolidative recovery. The overhead resistance zone is substantial. As long as the price fails to firmly hold above resistance, this rebound is more likely to be a continuation
post-image
BTC+0.96%
$CORE Everyone, do you think it will reach 2u?
post-image
CORE+0.24%
🔴 Strategy (MSTR) could be excluded from major MSCI indices (such as the MSCI USA, MSCI World, or MSCI ACWI) starting in late November 2026.
MSCI is one of the largest index providers in the world. Thousands of billions of dollars are invested in funds that automatically track these indices. If a stock is removed, these funds are required to sell it.
This is not yet certain: MSCI has introduced “buffers” to limit abrupt changes. A company already in the index, such as Strategy, will only be removed if it fails to meet the new criteria for two consecutive years. The final list of affected secu
post-image
MSTR+5.58%
MSCI+2.49%
Are you tired of watching me win yet?! 🏆
We are just getting started! ✅️
Let's go make that money! 💰
Structure, no smoke! 🔥🐶🔥
Does a bullish moving-average alignment always mean you should chase long positions?
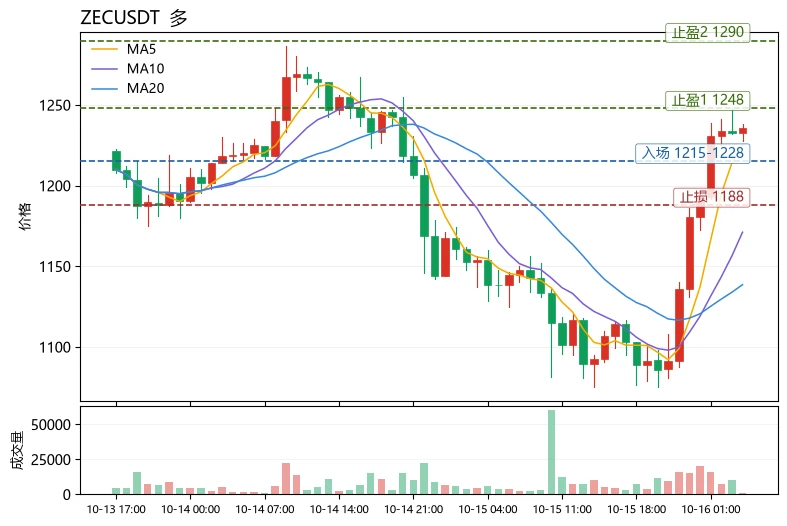
Not necessarily. The key is whether the price’s position relative to the moving averages is synchronized with momentum. Take $ZEC as an example: the current price is 1235.97, with MA5=1225.24 above MA20=1138.62, forming a standard bullish alignment and indicating a healthy trend direction; however, RSI has reached 70.2, nearing overbought territory, while the price is hugging the Bollinger upper band at 1248.36, making the risk-reward of chasing short-term highs unattractive. A reusable approach is: use movin
post-image
ZEC+9.33%
XPL+6.22%
INJ+11.20%
$AVAX 🔺
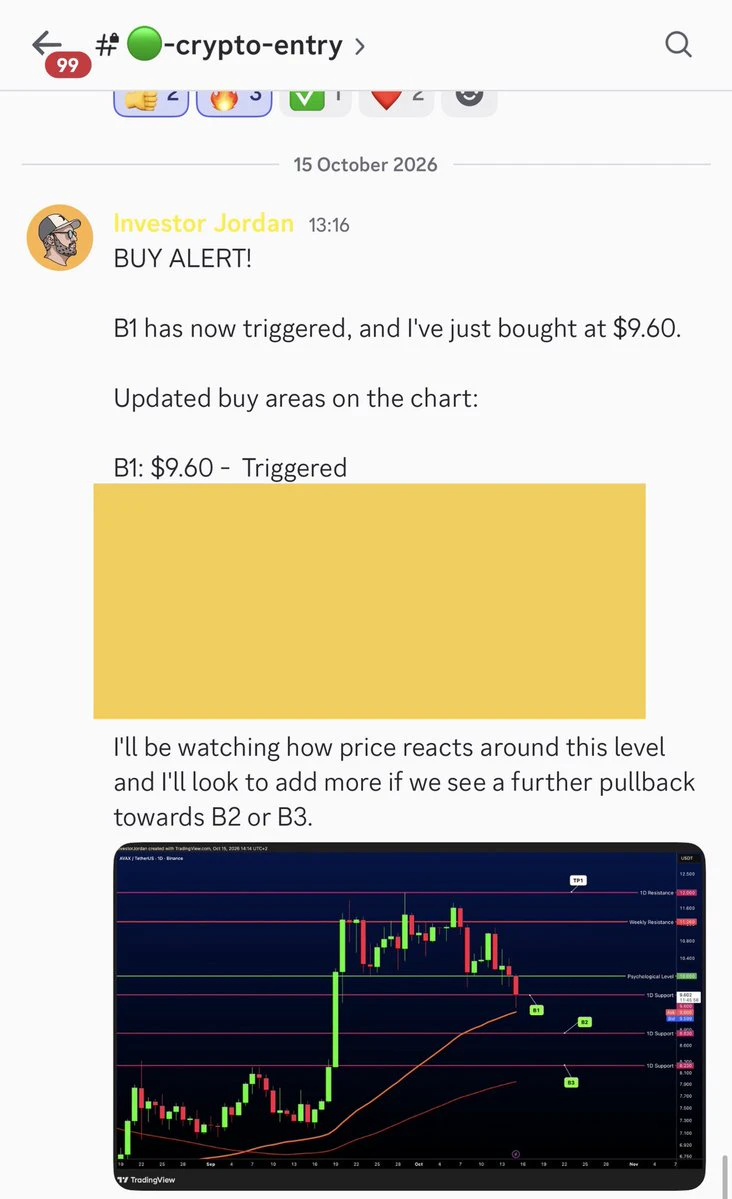
B1 filled for the subs at $9.60 🎯
$10.07 already
we keep winning 🔔🚀
post-image
AVAX+0.13%
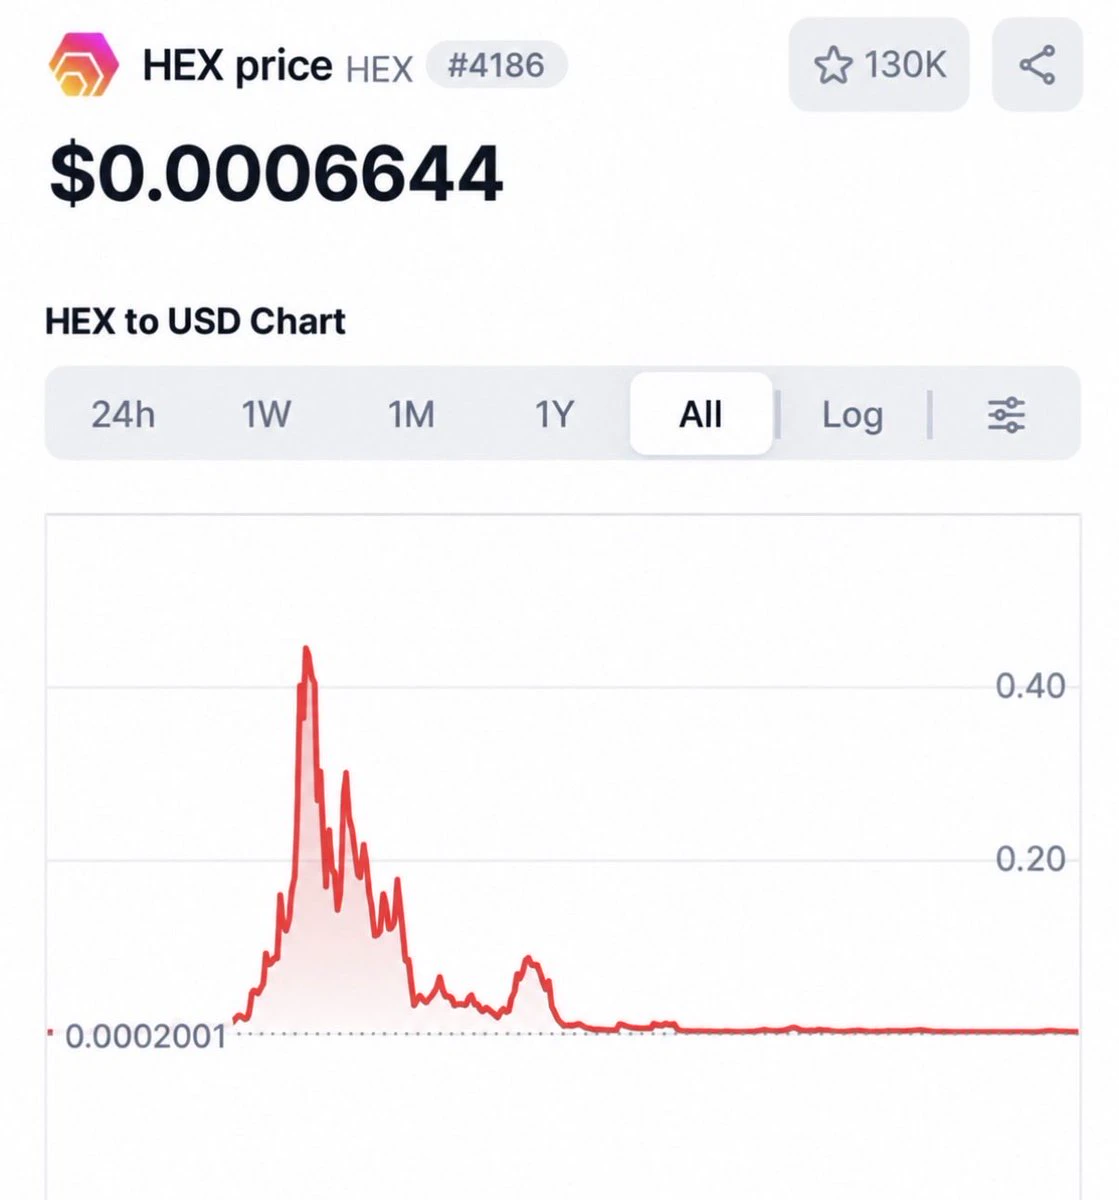
If you had put $10,000 into Richard Heart’s Hex token at the 2021 all time high you would only have $11 left and be down over -99.9%.
post-image
Who is truly leading the gains in the same sector? The answer points to $INJ
.
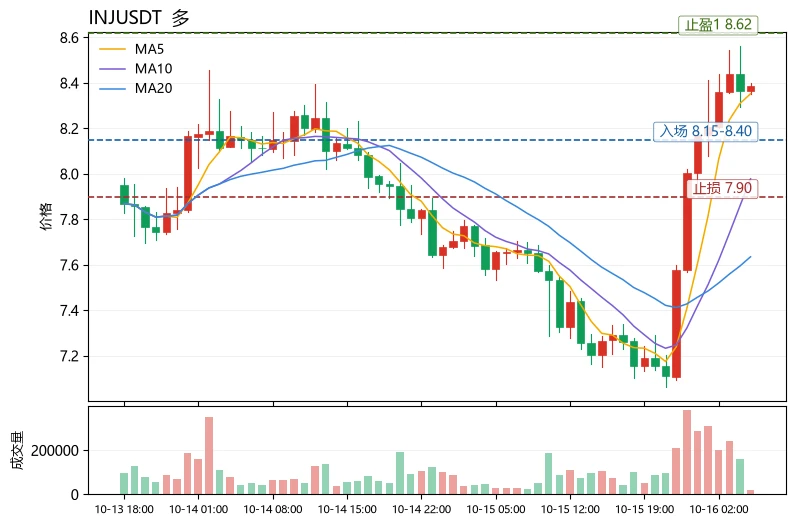
A horizontal comparison makes it clear: $INJ rose 10.92% over 24h, with a trading volume of 24.0M USDT, while $JTO fell 3.94% and $DOGE barely moved (-0.28%) over the same period. All three have an MA5 crossing above MA20, but only $INJ ’s RSI surged to 71.2, with the MACD histogram expanding significantly to +0.136. Its price of 8.379 is already approaching the Bollinger upper band at 8.618, and its 30-candle amplitude of 17.89% shows far greater volatility elasticity than the other two. The funding rate of +0.0
post-image
INJ+11.34%
JTO-2.75%
DOGE-0.24%
( new streamer) market overview
live-cover
LIVE69
LayerZero built Akita, a post-quantum proof scheme, with researchers from a16z crypto, Carnegie Mellon and USC. Its first deployment will be in Jolt, the prover behind the Zero blockchain, with proofs 2x to 3x faster.
@LayerZero_Core
ZRO+9.15%
Load More

Join 40 M users in our growing community

⚡️ Join 40 M users in the crypto craze discussion

💬 Engage with your favorite top creators

👍 See what interests you

Trending Topics

USSeptemberPPIBeatsExpectations

91.35k Views1.88k Discussing

US September PPI came in at 6.3% YoY, well above the 5.3% market expectation, pointing to renewed producer-side inflation pressure. Weekly jobless claims were 199K, broadly in line with forecasts. Could hotter inflation further reduce room for rate cuts, and what does it mean for $BTC, US stocks, and gold?

DrLinHanSpeaksAtOxfordUnion

135.63k Views1.86k Discussing

JapanAndKoreaStocksPlunge

47.27k Views1.76k Discussing

View More