

Share your thoughts
placeholder
Article
9.7 Gold Morning Strategy
On the hourly chart, gold prices surged and then pulled back under pressure. After a rapid retracement, the decline slowed, and prices found support above the lower Bollinger Band. The lower Bollinger Band is gradually flattening. After the sharp short-term drop, a technical rebound is likely, while the pace of the decline has eased. Do not blindly chase short positions in the morning; focus on opportunities to stabilize after a pullback.
Key Levels
Resistance: 4450, 4470
Support: 4410, 4395
Strategy:
Go long after prices stabilize in the 4400–4415 range following a p
post-image
XAUT-0.03%
$JASMY held the horizontal support + the 50 daily moving average like a pro.
I can’t wait for tomorrow to explain how bullish this is 😊📈🚀
post-image
JASMY-0.34%
A few days ago, the hand that set the stop-loss trembled slightly; this morning I realized that extra bit of filial piety was unnecessary. When $PENDLE was repeatedly fluctuating intraday, everyone was running, while I was the only one watching the key level.
The key level held, and buying support was always there. This wasn't distribution—it was shaking people out. I decisively opened a long around 1.540, and the price later reached 2.1.
A +2568.2% gain. In one sentence: that was a very satisfying bite.
The brothers on board should have woken up laughing.
Being out of the market isn't a sin;
post-image
PENDLE+4.02%
BNB-2.59%
BTC+0.27%
🧐 Bitcoin's trading volume has tanked to $20 billion as it hovers around $80K. Is this a sign of market fatigue or a brewing opportunity? 💸 $BTC #CryptoTrends
BTC+0.29%
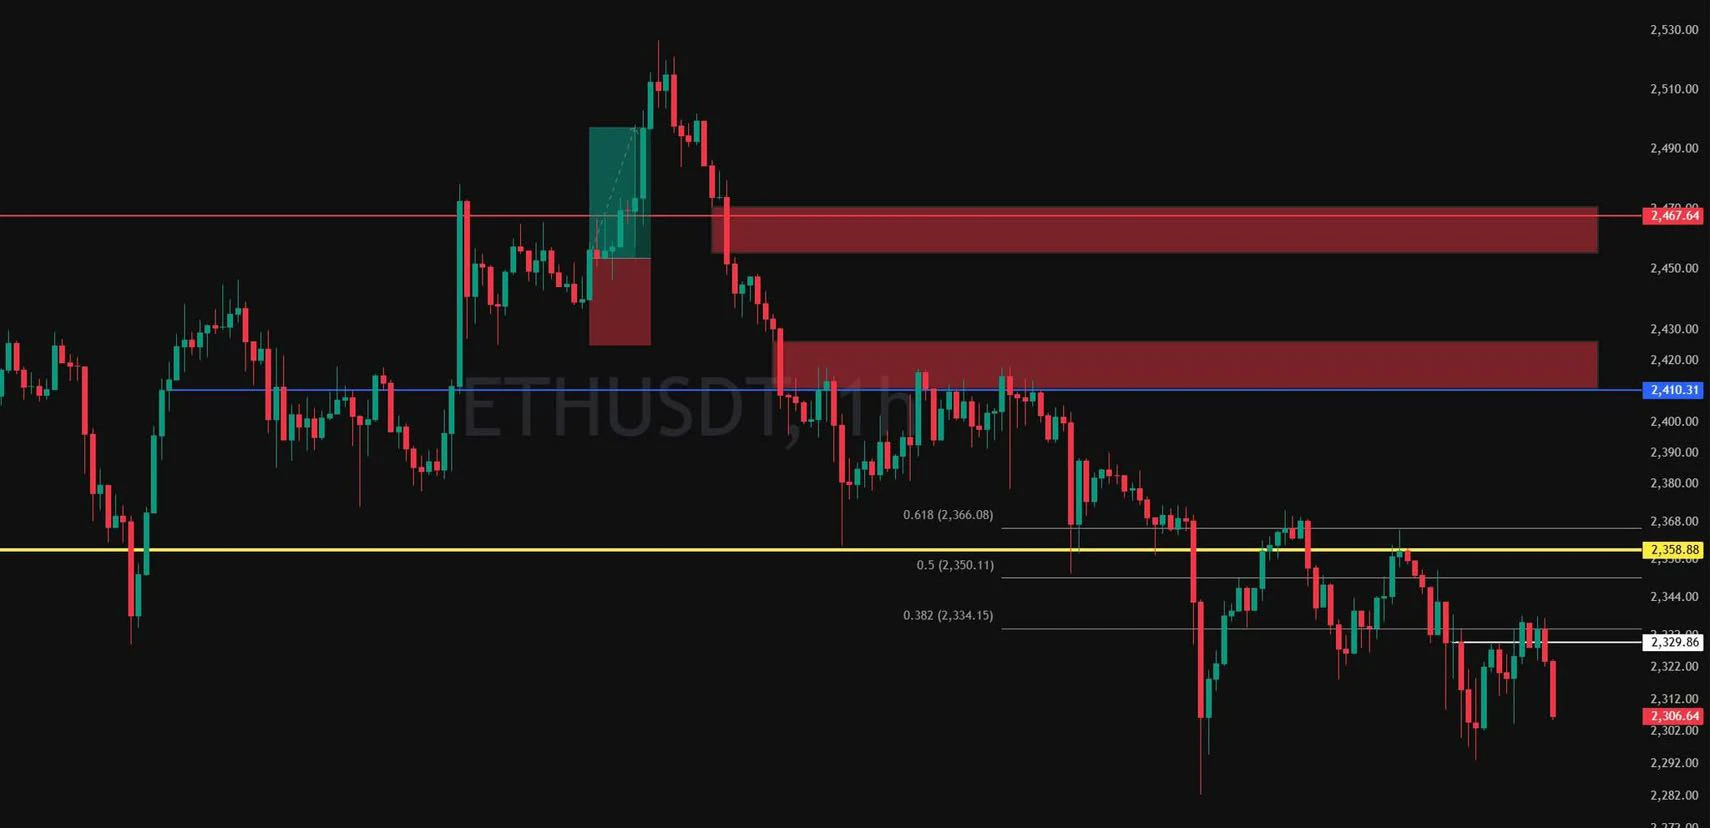
$ETH Signal】long + 4H MACD bullish expansion/1H pullback support
$ETH Depth imbalance -57.52%, sell orders dominate, with price holding above 2489. The 4H MACD bullish bars are expanding, while OI remains stable without contracting. 1H Bollinger Bands are tightening at 2478-2514, with two dips to 2488 followed by a rebound to 2496. RSI is 54 on 1H and 57 on 4H. The funding rate is 0.0051%, indicating little short pressure. Sell orders at 2489 have been tested repeatedly without a break.
🎯 Direction: long
⚡ Entry/order placement: 2489.6409 - 2496.3200
🛑 Stop loss: 2462.9246
🚀 Target 1: 25
post-image
ETH+1.06%
BTC+0.29%
SOL+2.41%
Important Reminder❗
The US stock market will be closed on Monday for the Labor Day holiday.
Here is a brief overview of the practical impact on the market:
1. With the US stock market closed, there will be no movement in US market trading on Monday night, macro news flow will be relatively light, and liquidity will decline significantly.
2. Although gold and crude oil will not be closed for the entire day, they will close early. Liquidity will shrink late at night, increasing the likelihood of slippage and sudden price spikes. Try not to leave large positions open until late at night.
3. Some
post-image
CL+0.07%
XAU-0.10%
  • 1
No moves, no analysis, just pure luck—this performance is embarrassing to even talk about. When the market plunged intraday, everyone was running, but I kept my eyes on $PONS ’s chart and noticed that someone stepped in every time it dipped, with key levels never breaking. Be greedy when others are fearful—directly signaled to open a long at 0.4775. And now, 0.8614, +1584.6%. It feels great when you get the rhythm right. It was truly sluggish at first, but the result is truly satisfying. Take profit on 80% first, and set a breakeven stop to protect the remaining 20%. Staying out of the market
post-image
PONS-11.63%
BTC+0.27%
SNDK+1.12%
Keep holding, and be a bit more determined. By the way, if you’ve already reduced your position, hitting the stop-loss still means a profit.
After $FARTCOIN rallied, I didn’t exit my entire position. I took 80% in profits first and moved the protective stop on the remaining position above breakeven. Just now, a quick pullback took out the remaining position, locking in the profits smoothly.

The entry reason was simple: on the hourly timeframe, price pulled back to the previous high without continuing lower, and instead reclaimed the area above the moving average on rising volume. This was a textbook pullback confirmation. After going long, I kept my stop loss below the lower boundary of the small range.

After the pullback took
post-image
FARTCOIN+3.49%
SNDK+1.12%
ZEC+19.99%
live Market Update
live-cover
LIVE132
This $ETH trade was handled relatively steadily, using a strategy of taking profits in batches. The entry premise was simple: the higher timeframe was still in a bullish structure, while the lower timeframe was merely undergoing a rapid shakeout, trapping those who chased shorts before quickly recovering. I judged this to be a shakeout rather than a reversal, so I opened a long position at a key panic level. After the market confirmed the move, I did not rush to exit everything, but first took profits on 80% to lock in the existing unrealized gains, while using a protective level to trail the
post-image
ETH+1.06%
BTC+0.27%
ZEC+19.99%
Bitcoin swing longs and swing shorts both pocketed 800 points🥩
Going long on the way up and short on the way down—feels great!!!
BTC+0.27%
This profit has me feeling both thrilled and apprehensive, afraid the market will catch on tomorrow and blacklist me😂 I opened the chart this morning and saw $SAHARA still grinding around the highs, with a weak rebound and no volume on the way up. I immediately felt something was off with the trend—it looked exactly like a bull trap😏

Right after I finished reading the bearish news, it happened to give me an entry for a short at 0.03226. I wasn't expecting to make much, but when I checked just now, the current price had already dropped to 0.00932, with +3424.49% firmly in my hands. Staying
post-image
SAHARA-0.32%
LAB-3.96%
SNDK+1.12%
Everyone’s eyeing BNB at 750—but the 4h chart is silently screaming “trap” while the daily range holds its breath.

$BNB /USDT - SHORT

Trade Plan:
Entry: 749.30 – 751.40
SL: 760.45
TP1: 742.77
TP2: 737.72
TP3: 730.14

Why this setup?
- Price is pinned at 750.35 with a 1D range, yet the SHORT bias (conf 55) targets a clean drop to 742.77 first.
- RSI on the 15m is only 56.1—no overheated bounce fuel, while ATR (4.2) shows volatility is compressed, priming a snap.
- Why now? The “waiting” status means the entry zone (749.30–751.40) is the exact battlefield; a rejection here flips momentu
BNB-2.59%
ripple:native holders may be closer to the top than they think. Just 2,151 XRP is now enough to rank among the top 10% of wallets, according to updated ledger data.
The thresholds rise quickly from there:
7,503 XRP gets into the top 5%, 44,896 XRP reaches the top 1%, while around 275,420 XRP is needed for the top 0.1%.
Key XRP Takeaways:
ETF Momentum: U.S. spot XRP ETFs have now recorded 11 straight sessions of positive inflows, bringing cumulative net inflows to roughly $1.68B, while XRP trades near $1.40.
Growing Network Activity: Average
quarterly value recorded on the XRP Ledger reportedly
post-image
XRP+0.34%
BTC+0.29%
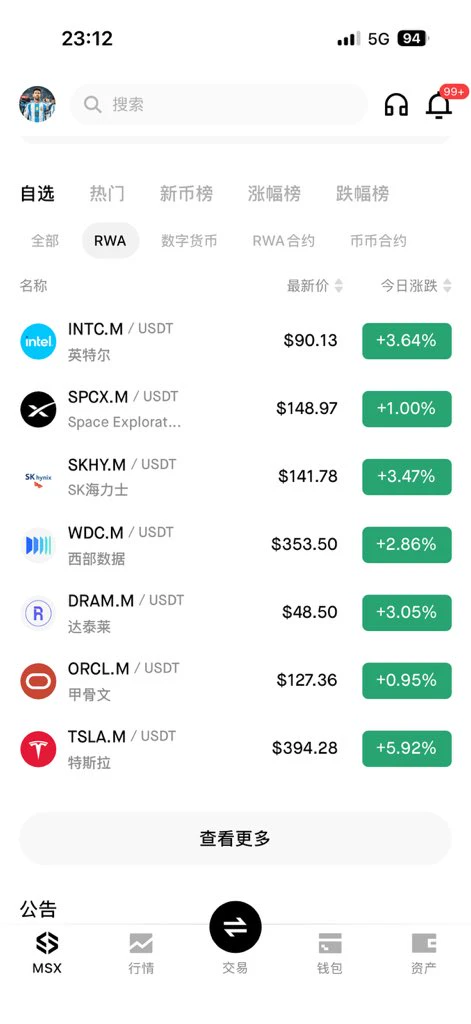
Everyone’s watching $SPCX /USDT pump—but the 4h chart just whispered a secret that most retail will ignore.

$SPCX /USDT - SHORT

Trade Plan:
Entry: 151.06 – 151.26
SL: 152.44
TP1: 150.20
TP2: 149.56
TP3: 148.60

Why this setup?
- Price is pinned at 151.16 with a **SHORT bias (77% confidence)** while the daily trend says “range”—that’s a compression zone.
- RSI on 15m is only 57.97—not overheated, not cold. It’s a **lull before a snap**, not a breakout signal.
- ATR on 1h (0.41) is tight—meaning the next 4h candle could stretch 3x that move.
- The “Waiting” status + invalidation at 14
SPCX+0.93%
$BTC Signal】1H pullback accumulation, 4H trend intact—go long
$BTC 1H MACD bearish crossover, volume contracted to 1025 BTC, but the 4H Bollinger Bands narrowed to a 2600-point gap between the upper and lower bands, with price tracking the EMA50 and clear signs of buying support.
🎯Direction: long
⚡Entry/limit order: 79585.641 - 79701.400
🛑Stop-loss: 78904.386
🚀Target 1: 80896.921
🚀Target 2: 81494.681
🛡️Trade management:
- Execution strategy: After reaching Target 1, reduce the position by 50% and move the stop-loss up to breakeven. If the price falls back to the entry level, exit automat
post-image
BTC+0.27%
With this trend, I don’t even need to think—the account is dancing on its own. When the market kept fluctuating intraday, everyone thought there was no chance. I watched the chart grind along a bottom without breaking down, and I knew what was up: if it holds steady, the gains will come. $ZEC is now at 1229.93 from 857.01, up +3090.33%. The beginning was truly sluggish, but the result is truly sweet. The market is waited out, and profits are held onto. Have a strategy before the market opens, discipline during trading, and reflection after the close. I’ll take 75% off the table for now, and p
post-image
ZEC+19.99%
BTC+0.27%
LAB-3.96%
This return has me feeling both thrilled and apprehensive, afraid the market will come to its senses tomorrow and blacklist me.

A few days ago before bed, $XAU made another push upward. When it approached 4474.29, my heart skipped a beat: I couldn't chase the long; the rebound was weak and volume hadn't followed through. No matter how I looked at it, it seemed like a bull trap. At that point, I placed another short order, set the stop-loss above, and shut down my computer to sleep. When I opened my eyes this morning, the price had already slid to 4428.93, and the return had jumped straight
post-image
XAU-0.10%
SNDK+1.12%
LAB-3.96%
Load More

Join 40 M users in our growing community

⚡️ Join 40 M users in the crypto craze discussion

💬 Engage with your favorite top creators

👍 See what interests you

View More