Square
Following
Hot
News
Notifications
Profile
Share your thoughts
placeholder
Article
$MET Up 19.44% in 24 hours to 0.3306, with 43.5M in trading volume—retail traders alone couldn't drive this kind of volume. The current price is just 1.5% below the 24-hour high of 0.3356. Go long on a breakout, with a stop-loss at 0.315 (above today's low) and a first take-profit at 0.36. Keep your position at or below 5% of your total capital, and do not exceed 3x leverage. If you're not in a position, wait for a pullback to the 0.318–0.322 range and scale in. If it falls below 0.31, admit you're wrong and exit immediately. The token selection logic is simple: a high 24-hour volume-to-turnov
MET-0.33%
In BTC trading, many people see the price break through an important resistance level and immediately chase the rally, worried they’ll miss an opportunity to profit. But experienced traders often pay attention to another important signal after a breakout: the pullback.
Why is a pullback after a breakout worth watching?
First, it helps confirm whether the breakout is valid. After the original resistance level is broken, it may turn into new support. If the price falls back to this area but doesn’t break significantly below it, that may indicate the market is reconfirming its role as support.
Se
BTC-0.67%
Trenches
ZIG
Z
bade
b
ZIG
0x8c...1145
Market Cap
$.
Change
.
24h Vol
$.
Holders
.
STONK
S
bade
b
STONK
6GmA...UNgx
Market Cap
$.
Change
.
24h Vol
$.
Holders
.
IDOL
I
bade
b
IDOL
0x3b...ab07
Market Cap
$.
Change
.
24h Vol
$.
Holders
.
BTC
B
bade
b
BTC
C5xp...pump
Market Cap
$.
Change
.
24h Vol
$.
Holders
FLOAT
F
bade
b
FLOAT
Bv1a...BMmr
Market Cap
$.
Change
.
24h Vol
$.
Holders
.
$SOXL I remain bullish on U.S. stocks. Even the hardest-falling stocks won’t keep going down without ever turning back; a rebound will come sooner or later. Those with no positions can go long at the current market price, with an initial target of 55 and a further target around 60. Those with heavier positions can also trade a short-term rebound to take some profits. $SOXL Keep the contract tag as usual. Risk warning: The above reflects only my personal market outlook and does not constitute investment advice. Contract trading carries extremely high leverage risks, so be sure to manage your po
post-image
SOXL-1.16%
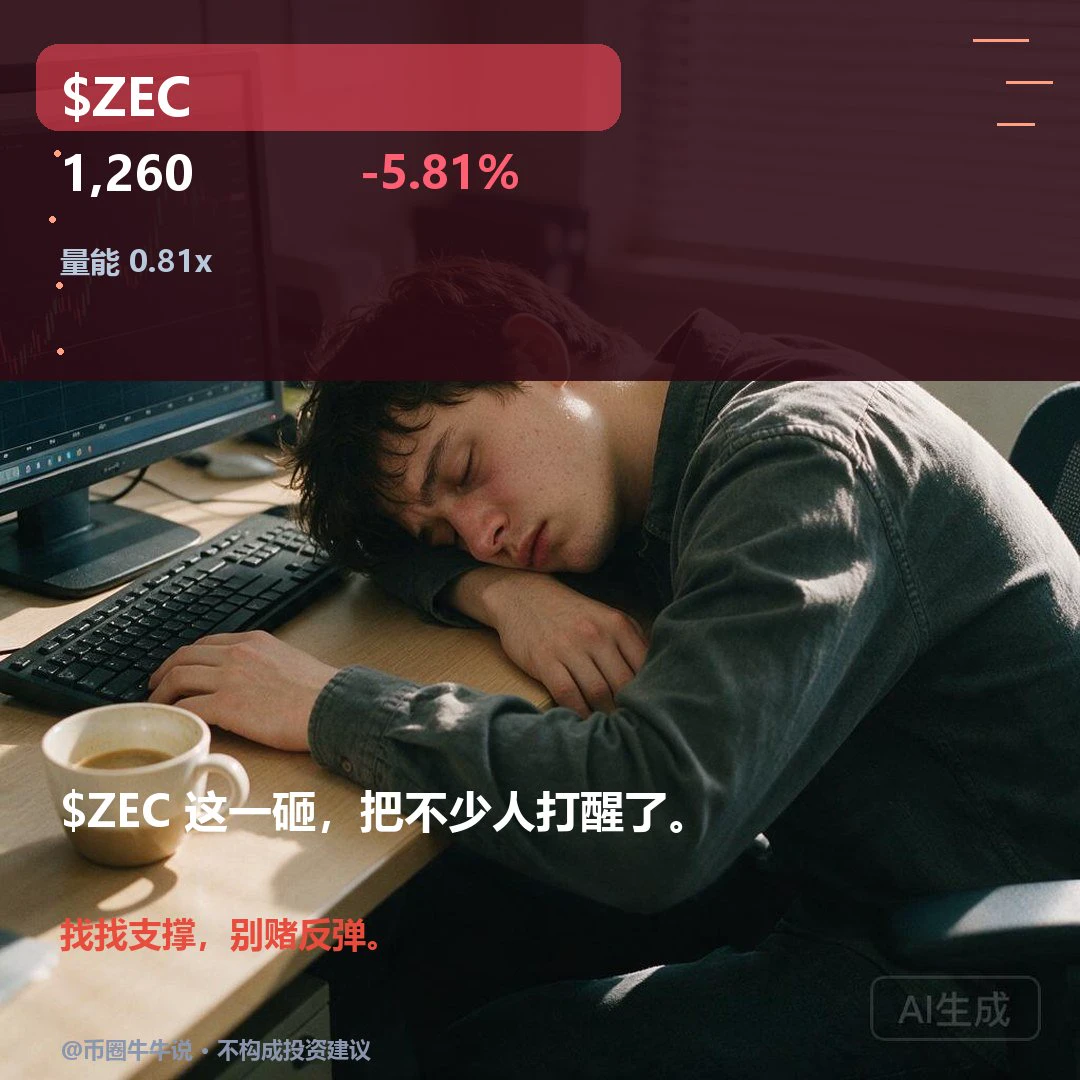
$ZEC 1260.25, 24H -5.81% (1235.00–1339.66). 1H is weak, RSI 41.22/EMA20 1270.69, support at 1235.00/resistance at 1334.33, volume ratio 0.81; 4H is weak, RSI 51.84/EMA20 1281.84, support at 1183.38/resistance at 1387.89. A sustained move above the 1334.33 resistance would be meaningful; a break below the 1235.00 support would signal weakness. Review and verify a sustained hold above 1334.33 and a break below 1235.00 followed by a reclaim; invalid if volume is lacking or the level is not reclaimed. The market is volatile; for observation only.
post-image
ZEC+1.16%
[New Streamer] 🔹 Former FBI Agent Admits Stealing $2.47 Million in Cryptocurrency, Faces Up to 20 Y
live-cover
LIVE1,024
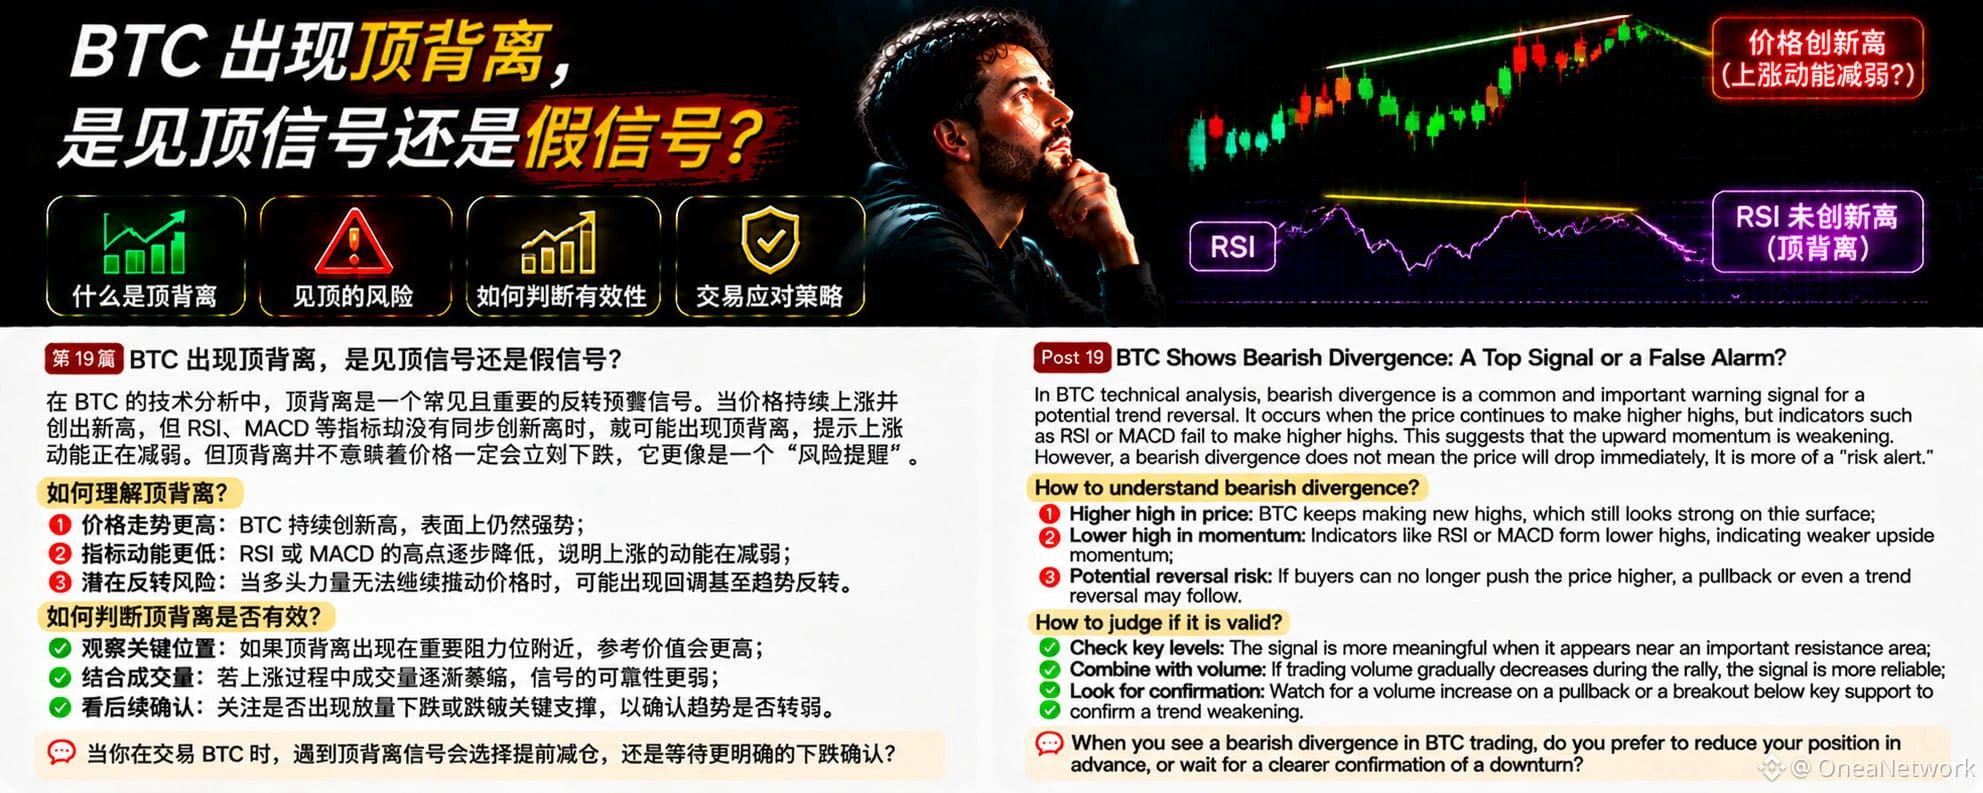
In BTC technical analysis, bearish divergence is a risk warning signal worth watching. Many traders see prices continually making new highs and assume the uptrend remains strong. But if prices continue to rise while indicators such as RSI or MACD fail to make new highs, bearish divergence may occur.
What is bearish divergence?
Simply put, it is when the price makes a higher high, but the technical indicator forms a lower high. This suggests that although the price is still rising, the momentum driving the rise may be weakening.
Why is bearish divergence worth watching?
First, upward momentum m
post-image
BTC-0.67%
No matter where you are, don’t eat anything strangers give you.
I did it @MetaMask where’s my $100k prize?
post-image
#Ahr999EntersBottomBuyingZone
𝗔𝗵𝗿𝟵𝟵𝟵 𝗙𝗮𝗹𝗹𝘀 𝗕𝗲𝗹𝗼𝘄 𝟬.𝟰𝟱 𝗮𝘁 $𝟳𝟱,𝟳𝟴𝟯: 𝗪𝗵𝗮𝘁 𝘁𝗵𝗲 𝗕𝗼𝘁𝘁𝗼𝗺-𝗕𝘂𝘆𝗶𝗻𝗴 𝗦𝗶𝗴𝗻𝗮𝗹 𝗠𝗲𝗮𝘀𝘂𝗿𝗲𝘀, 𝗪𝗵𝗲𝗿𝗲 𝗶𝘁 𝗦𝗶𝘁𝘀 𝗮𝗻𝗱 𝗪𝗵𝗮𝘁 𝗶𝘁 𝗖𝗮𝗻𝗻𝗼𝘁 𝗣𝗿𝗼𝗺𝗶𝘀𝗲
With Bitcoin at $75,783, the Ahr999 index is back in its bottom-buying zone. The index sat at 0.50 on October 25, touched 0.45 on October 31 and November 1, read 0.44 on November 3 and 0.45 on November 4, per CoinAnk. A price of $75,783 puts it at roughly 0.43 by my math. The signal is back after about 80 days outside the zone, since the previous stretch bel
post-image
BTC-0.67%
NVDA+2.80%
NDAQ+0.28%
  • 2
$BCH Fell to the weakest in the sector—is this a risk or an opportunity? The answer leans bullish—this is relative weakness amid panic-driven indiscriminate selling, not a fundamental collapse.

Comparing across the sector: NEAR is currently at 3.688, down just 2.12% over 24h; MA5 has crossed above MA20, RSI is neutral at 47.6, and the MACD histogram has turned positive, with a much smaller decline than BCH. MITO is even up 21.26% against the trend, with a relatively strong RSI of 60.6. Of the three, BCH is relatively the weakest: down 6.24% over 24h, with its price of 248 below MA5 at 248.62
BCH+0.95%
MITO+8.51%
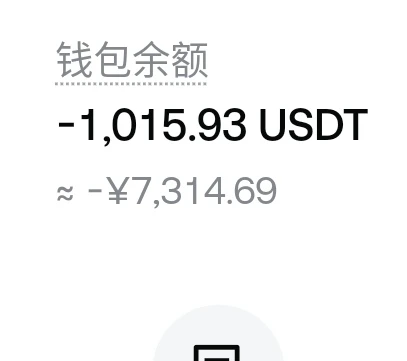
I’m leaving it alone now, making back 20u a day, and I’ll be in the green in 50 days, then I won’t touch it again
post-image
  • 1
$SOXL SHORT SETUP — ANOTHER BIG DROP COMING?

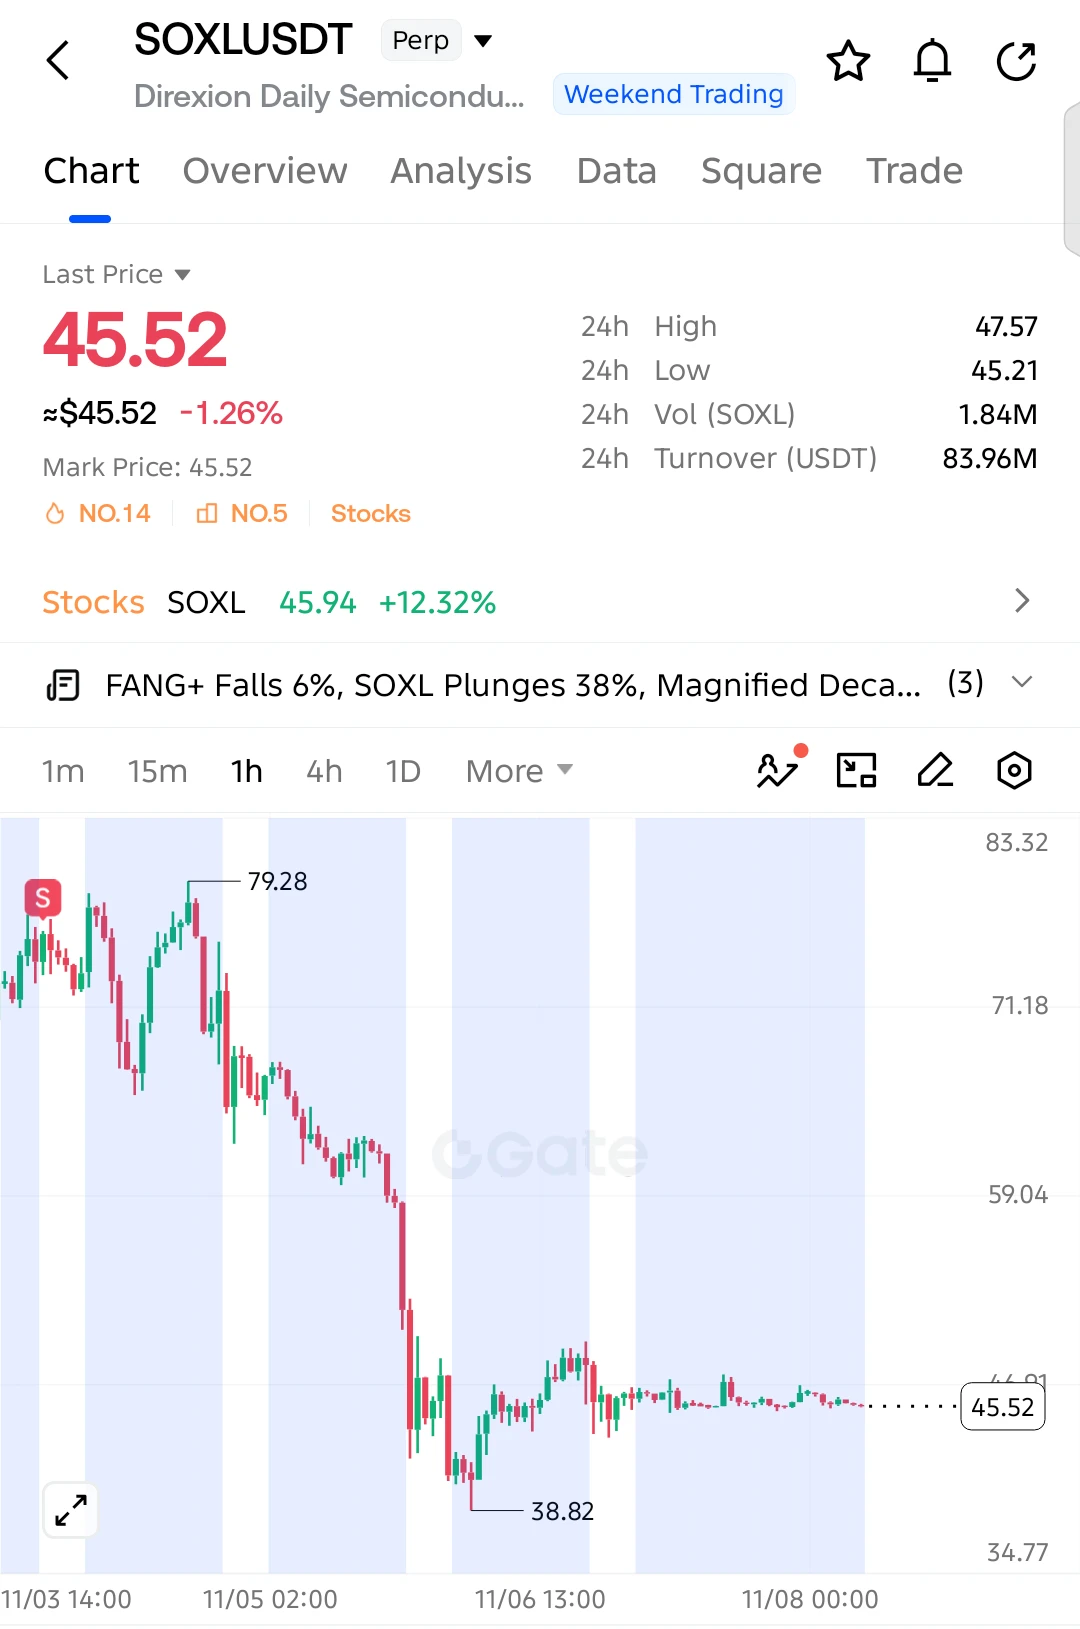
$SOXL remains under heavy bearish pressure after crashing from 79.28. Price is consolidating near 45.52, with sellers still holding the broader advantage!

Entry: 45.52
SL: 47.80

TP1: 44.00
TP2: 42.00
TP3: 40.00
Final Target: 38.82

The massive sell-off has weakened the market structure, while buyers are struggling to build a meaningful recovery. A breakdown below 45.21 could trigger fresh selling pressure toward 42.00 and potentially retest 38.82.

Invalidation: A sustained recovery above 47.80 weakens the bearish setup.

Keep your eyes on $SOXL!
post-image
SOXL-1.16%
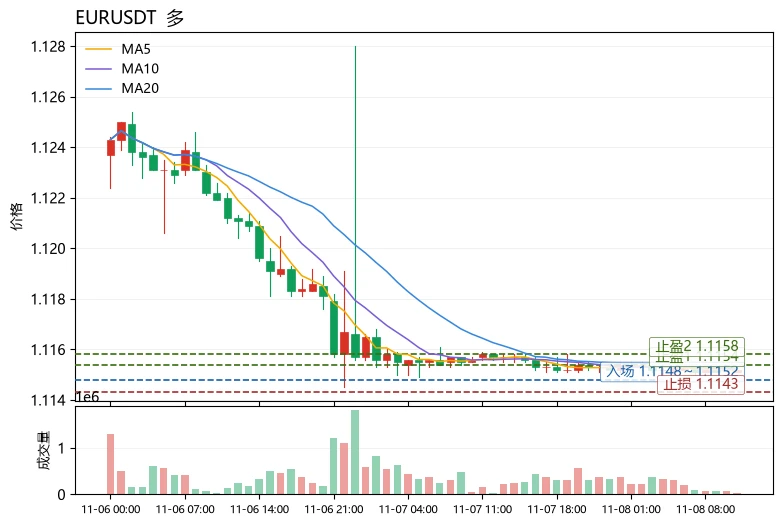
$EUR Current price 1.1152, 24h -0.04%. The range across 30 candlesticks is only about 0.1%, with volatility extremely compressed. On the moving-average front, MA5=1.11516 is slightly below MA20=1.11526; the short- and medium-term moving averages are converging and flat, with no clear direction. RSI=37.6 is in the weak zone but not oversold. The MACD histogram=+0.0001182 remains slightly bullish, but momentum is insufficient. The Bollinger Bands [1.11508,1.11544] are extremely narrow, and the price is trading near the lower band. The Fear & Greed Index is 28, indicating fearful market sentiment
post-image
eur
eureur
Gate.Fun
MC:$5.55KHolders:3
0.06%
LTC-0.07%
UNI+3.05%
OpenAI CFO: Data center investments will not change due to the midterm elections.
live-cover
LIVE1,990
Even now, the ones I feel I've let down the most are my family 03 A College Student Boldly Ventures into the Crypto World
My roommate recently did something pretty outrageous—pretended to be a foreigner to pressure a seller into shipping an order. He’s really mastered the art of “international order chasing.” $ETH $BTC By the way, the nonfarm payrolls data has once again added fuel to rate hike expectations, while the US plans to tighten data center regulations, potentially putting new shackles on AI expansion. BTC dipped 0.16%, and ETH fell 0.42%. Markets fluctuate, so don’t get carried away. Trade at your own risk. (The above is solely my personal opinion and does not constitute investment advice. Please asses
post-image
BTC-0.67%
$ETH

Are the US and Iran about to start fighting again?

Trouble flares up again in the Strait of Hormuz

Where will global capital flee this time?

Holy crap

Guys

The market had just caught its breath

And the Middle East is at it again

Tensions between the US and Iran have been rising again recently

November 6

The US carried out a new round of limited strikes on military targets near the Strait of Hormuz in Iran

Trump said

The US military had destroyed Iran’s newly built air defense system

Iran had also repeatedly warned

That if the US continued its attacks

It would retaliate aga
post-image
ETH-1.23%
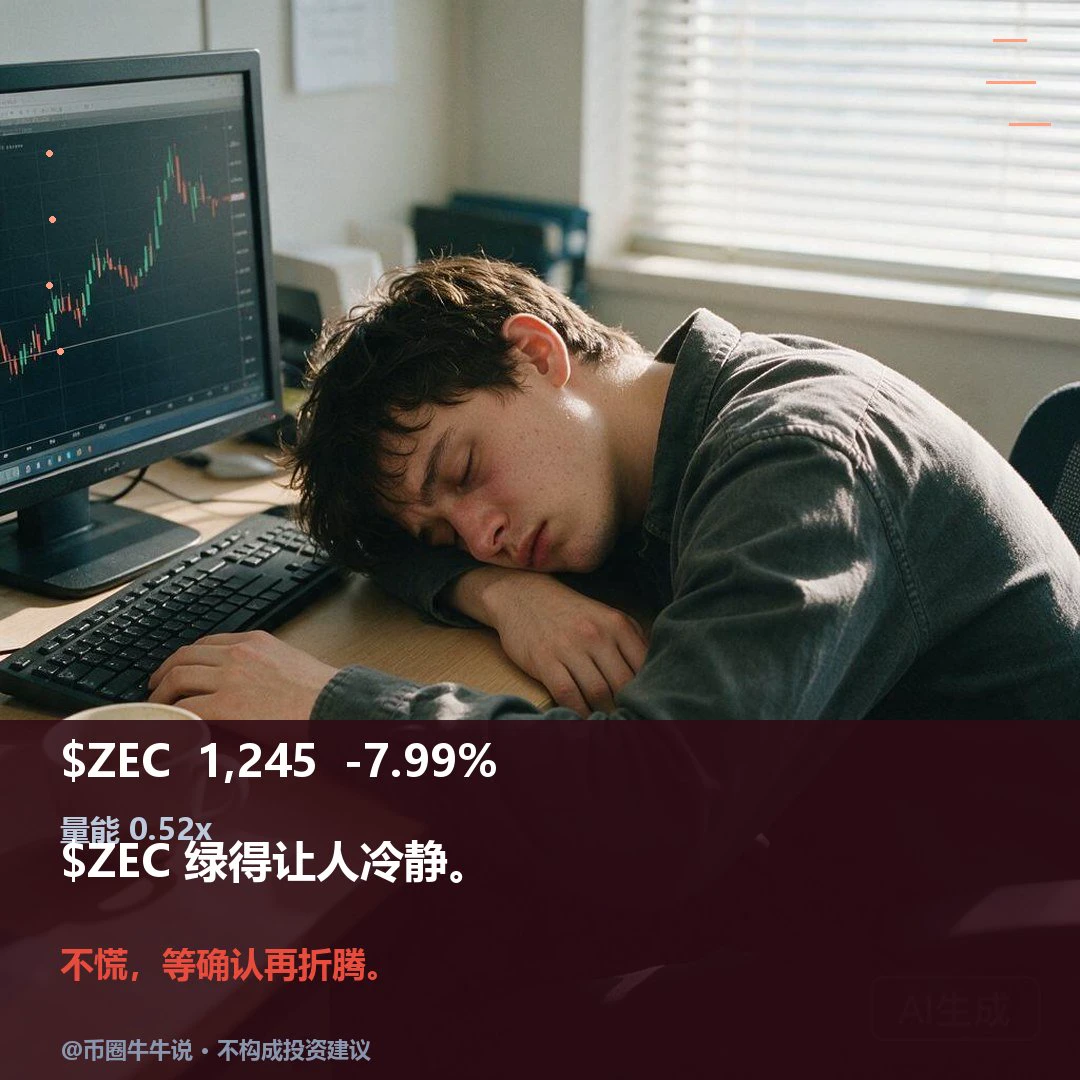
$ZEC Current price: 1244.52, 24H -7.99% (1236.65–1355.98). Weak on the 1H: RSI 28.06, EMA20 1271.33, volume ratio 0.52; weak on the 4H: RSI 49.23, EMA20 1280.54, support at 1183.38/resistance at 1387.89. A sustained move above the 1350.85 resistance level is meaningful; a break below the 1236.65 support level would signal further weakness. Review whether price holds above 1350.85 and recovers after losing 1236.65. Volume is only 0.52x; the setup is invalidated if volume is insufficient or price fails to recover. Market volatility is high; for observation only.
post-image
ZEC+1.16%
#DGAI

Worked for 8s
DGAI Gains 1.3%: Is Growing AI Infrastructure Demand Supporting Its Market Momentum?

What Is Driving DGAI Today?

Is DGAI starting another upward move, or is this simply a short-term pause in a wider market battle? The latest figures show a modest positive move, but the trading activity deserves closer attention.

As of November 8, 2026, at 01:30 UTC, DGAI/USDT was trading at $0.76992, up 1.3% over 24 hours. Trading volume reached approximately 3,471,405 USDT.

The price increase shows that buyers have maintained a slightly positive position during this period. However,
DGAI+0.67%
  • 1
$AIN saw an $8.03K long liquidation near $0.1401, highlighting downside pressure as leveraged buyers were forced out. This could represent a liquidity sweep, but buyers need to defend demand and reclaim the previous breakdown area. Until then, the short-term structure remains cautious.
Support: $0.1370 – $0.1340
Resistance: $0.1430 – $0.1470
Next Target: $0.1520
Confirmation: A strong reclaim above $0.1430 could indicate buyers are returning. Losing $0.1340 would increase bearish continuation risk.
Let's go $AIN 🚀
post-image
AIN+3.85%
Load More

Join 40 M users in our growing community

⚡️ Join 40 M users in the crypto craze discussion

💬 Engage with your favorite top creators

👍 See what interests you

Trending Topics

USCPIDataIncoming

1.04k Views1.48k Discussing

The U.S. October CPI report will be released on November 10 at 8:30 a.m. ET. September CPI came in at 3.7% year over year, and markets will be watching closely for signs that inflation is cooling, especially in core CPI. A softer-than-expected reading could strengthen rate-cut expectations, while hotter inflation may pressure risk assets through higher Treasury yields and a stronger dollar. How do you think this CPI print will move $BTC, U.S. stocks and gold?

USAIStocksHitHard

23.56k Views3.69k Discussing

USNonfarmPayrolls

40.34k Views4.38k Discussing

View More