Share your thoughts
placeholder
Article
BNB sitting at $768.83 doesn't tell you much on its own. The chart underneath it does.
Zoom out and the structure is pretty legible: a parabolic run from roughly $250 up to a spike near $1,350-1,400 in late 2025, followed by a hard correction that dumped price back into the $550-600 zone by early this year. Since then, BNB's been building a range — chopping between roughly $500-560 on the low end and $900-950 on the high end, which is exactly where I've marked support and resistance on this chart.
What stands out to me is that this isn't a clean reclaim story yet. Price has tested that lower z
post-image
BNB-1.87%
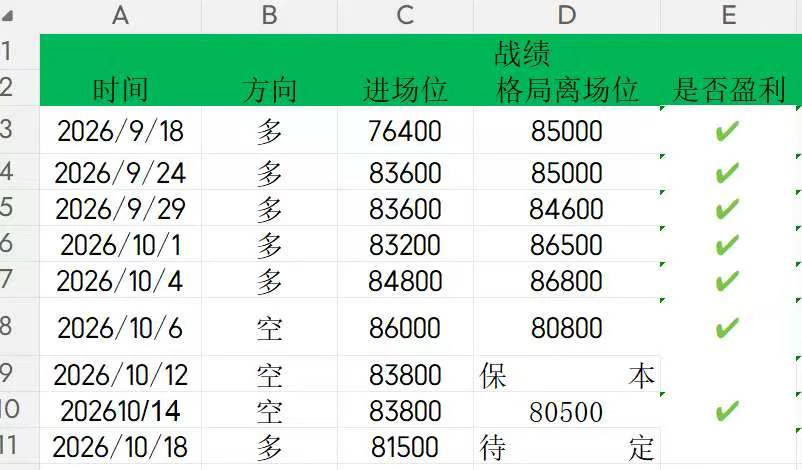
The Bitcoin strategy shared with everyone in the early hours successfully played out, with the market moving 1,200 points and smoothly reaching the preset target
The market saw intense long-short contention amid high-level consolidation in the early hours. We assessed the rebound momentum based on the cyclical structure, and the market rose as expected
#BTC跌破8万美元 $BTC $ETH $SOL
BTC-0.37%
ETH-0.11%
SOL-0.29%
  • 1
Whale shorts ZEC, losing $25.7 million in three months! 🔥 ZEC surged from $400 to nearly $1,200, overtaking Dogecoin in market cap! This “shorting operation” was brutal: coordinated accumulation by mining pools + the Grayscale ETF launch + $34.5 million in short positions liquidated in a chain reaction, leaving the bears completely crushed! But the daily RSI is approaching 80, indicating extreme overbought conditions. Do you think this rally has peaked, or can it surge even higher? Share your thoughts in the comments! 👇
1. Price action: ZEC’s recent performance has been nothing short of “cra
ZEC+3.24%
  • 4
$ETH Signal】Buy the dip: 1H EMA50 provides support, 4H trend remains intact
$ETH Order book depth imbalance -55.88%, with sell orders dominant; price is holding above 2490. The 1H MACD green bars are continuously shrinking, indicating weakening bearish momentum. The 4H MACD bars remain above the zero line, while EMA50 is forming support near 2488.7.
🎯Direction: Long
⚡Entry/limit order: Place long orders in the 2488.2504 - 2495.6100 range; the current price of 2495.61 can be targeted directly
🛑Stop-loss: 2470.6539
🚀Target 1: 2533.0441
🚀Target 2: 2551.7612
🛡️Trade management: - After reach
post-image
ETH-0.11%
$CL /USDT is being ignored while the 1h price quietly stacks supply near 91.84 and the daily trend stays range-bound, so where does the next move hide?

$CL /USDT - SHORT

Trade Plan:
Entry: 91.77 – 91.95
SL: 92.71
TP1: 91.23
TP2: 90.80
TP3: 90.17

Why this setup?


Debate:
Are you watching TP2 at 90.80 or waiting for a daily trend break before entering?

⚠️ Personal market analysis only. NFA — manage risk and DYOR.
Educational content, not investment advice or a recommendation to buy, sell, deposit, or withdraw any asset. No paid promotion or referral/affiliate links.
CL-0.01%
ZEC is highly likely to surge again today, with at least around 1310 in sight. Many people in the group have liquidation prices around 1400—could it really take the extreme altcoin route and charge toward 1500? It feels brutal just imagining it.
How the market maker moves depends on maximizing its own profits.
Record✍️My thoughts: Consider entering around 1330; if it breaks to a new high, set a stop-loss and re-enter.
post-image
ZEC+3.24%
  • 5
  • 1
Morning Market Updates
live-cover
LIVE2,396
China is trying to make 3D DRAM possible without EUV
Naura Technology has demonstrated a key etching process for 64-layer 3D DRAM, potentially giving China a way to keep scaling DRAM density despite lacking access to EUV lithography
Instead of making transistors smaller in 2D, 3D DRAM stacks them vertically, similar to what NAND did years ago. Naura’s process selectively removes silicon-germanium layers from a 64-layer Si/SiGe stack while preserving the silicon structure
The reported performance is strong: SiGe-to-Si selectivity above 500:1, silicon loss below 1 nm per cycle, and more than 95%
post-image
I still expect the Fed to hold rates steady at its September meeting, although the case for that outcome is weakening.
post-image
Nanfang’s double-leveraged long SK Hynix fund jumps ~15.7%, with South Korea’s Samsung 2x long up ~10.5%—high-leverage bets signaling strong upside momentum in key memory names. $HYNIX $Samsung Electronics
post-image
🔥Monday daytime free strategy levels👇
🔥Long entry levels (second entry levels + short entry levels + take-profit levels are in the pinned subscription post; both long- and short-term spot setups are also in the pinned post)
===========
78950 long, 78650 long, stop loss 77250
2425 long, 2405 long, stop loss 2355
#Gate闲钱宝自动生息享3%年化
#ZECBreaks1200HitsNewAllTimeHigh 🚀🔥
ZEC IS AT $ZEC— AND THE REAL BATTLE HAS JUST BEGUN
Zcash has entered one of the most aggressive price-discovery phases of its recent market history.
$ZECis currently trading around $1,215,after pushing toward the $1,250area and decisively breaking above the psychological $1,200level.
The important part is not simply that ZEC touched $1,200.
The important part is that buyers have managed to push the market beyond a major psychological barrier and keep price around the $1,200+region.
That changes the entire short-term technical picture.
ZEC is no longer trad
post-image
CryptoChampion
#ZECBreaks1200HitsNewAllTimeHigh 🚀🔥
ZEC IS AT $1,215 — AND THE REAL BATTLE HAS JUST BEGUN
Zcash has entered one of the most aggressive price-discovery phases of its recent market history.
$ZEC is currently trading around $1,215, after pushing toward the $1,250 area and decisively breaking above the psychological $1,200 level.
The important part is not simply that ZEC touched $1,200.
The important part is that buyers have managed to push the market beyond a major psychological barrier and keep price around the $1,200+ region.
That changes the entire short-term technical picture.
ZEC is no longer trading like an ordinary recovery asset.
It is trading like a momentum asset searching for its next valuation zone.
And now comes the difficult part.
Breaking resistance is one thing. Holding the breakout is another.
At approximately $1,215, ZEC is sitting directly inside the most important decision zone of the entire move.
$1,200 HAS NOW BECOME THE KEY LEVEL
For me, the most important number on the ZEC chart right now is $1,200.
Before the breakout, $1,200 represented psychological resistance.
After the breakout, the market needs to prove that this level can become support.
The ideal transition is: Resistance → Breakout → Retest → Support → Continuation
If ZEC continues holding above $1,200, the bullish structure becomes considerably stronger.
If buyers repeatedly defend this level, it tells us that the market is accepting a new valuation above $1,200.
But if ZEC loses $1,200 quickly and cannot reclaim it, the breakout could begin turning into a short-term exhaustion move.
At $1,215, ZEC is only around $15 above this key breakout level, making the current area particularly important.
THE NEW PRICE-DISCOVERY MAP
Once an asset enters price discovery, historical resistance becomes much less useful.
There are fewer previous sellers above the market. Instead, traders start watching psychological numbers and momentum extensions.
For ZEC, my upside map is now:
$1,250 → $1,300 → $1,400 → $1,500 🚀
$1,250 — IMMEDIATE BATTLE
ZEC has already approached this area, making $1,250 the first major test after the $1,200 breakout.
A clean move above $1,250 accompanied by strong volume would strengthen the continuation thesis.
$1,300 — NEXT PSYCHOLOGICAL TARGET
Above $1,250, the market could begin focusing heavily on $1,300.
Round numbers become particularly important during price discovery because traders have fewer historical resistance levels to work with.
$1,400 — MOMENTUM EXTENSION
If ZEC establishes $1,300 as support, the next major psychological extension becomes $1,400.
$1,500 — MAJOR BULLISH OBJECTIVE
$1,500 is the larger upside target I would monitor if the current breakout develops into another sustained momentum leg.
But reaching $1,500 would require continued demand, liquidity, volume and broader market support.
EMA STRUCTURE: STILL STRONGLY BULLISH
The previously observed EMA structure remains extremely important:
EMA5: $1,023.48
EMA10: $941.94
EMA30: $770.31
Now compare those levels with the current ZEC price of approximately $1,215.
The distance is enormous.
ZEC remains dramatically above all three averages, confirming the strength of the current trend.
But it also gives us an important warning: the market has become VERY EXTENDED.
Price is approximately $190 above the previous EMA5 reference.
That does not automatically mean a reversal is coming. Strong assets can remain far above their moving averages while momentum continues.
However, if a correction occurs, the EMA5 area around $1,020–$1,025 becomes an important reference.
A pullback from $1,215 toward $1,050 or even around $1,020 would not automatically destroy the larger bullish structure.
It could simply mean the market is cooling after an explosive move.
For now: EMA structure = BULLISH.
BOLLINGER BANDS: EXTREME MOMENTUM, EXTREME EXTENSION
The previous Bollinger Band structure showed:
Upper Band: $1,121.48
Middle Band: $819.51
Lower Band: $517.54
ZEC was already trading above the upper Bollinger Band before breaking $1,200.
Now the market is around $1,215, after reaching approximately $1,249.
That means price remains extremely extended relative to the previous Bollinger structure.
This is one of the strongest momentum signals in the setup, but it is also one of the biggest risk signals.
When price moves significantly above the upper Bollinger Band, it tells us that buying pressure is extraordinary.
However, it also increases the possibility of mean reversion.
That is why the $1,120 region becomes important.
Above $1,200 = POWERFUL MOMENTUM
Near $1,120 = COOLING WARNING
Below $1,120 = CORRECTION RISK INCREASES
MACD: BULLISH, BUT WATCH FOR DIVERGENCE
The previous MACD readings were:
DIF: 122.78
DEA: 96.63
MACD: 26.14
DIF remained above DEA, confirming strong bullish momentum.
The MACD had also increased from approximately 17.06 to 26.14, indicating momentum acceleration.
The continued move toward $1,200+ supports the original bullish momentum signal.
But now I would monitor MACD differently.
The question is no longer simply “Is MACD positive?”
The better question is: “Is MACD confirming every new price high?”
If ZEC reaches $1,300 while MACD makes a lower high, that could create bearish divergence.
It would not automatically mean the bull market is finished. It would simply tell us that price is moving faster than underlying momentum.
For now: MACD structure remains BULLISH.
OBV AND VOLUME: THE CONFIRMATION WE NEED
The previous OBV readings were:
OBV: 3,039,482.58
MAOBV: 2,980,195.35
OBV remained above its moving average, supporting the bullish capital-flow picture.
But there was one concern: the price increase was extremely large relative to the volume expansion at the time.
That is why volume confirmation becomes even more important now.
A healthy continuation would ideally show: Higher Price + Higher Volume + Rising OBV.
That combination would tell us that buyers are participating aggressively.
But if ZEC continues printing higher highs while volume starts shrinking, the market becomes more vulnerable to profit-taking.
Reports around the recent move indicated roughly $34.5 million in bearish positions were liquidated, while ZEC futures open interest reached approximately $2.43 billion.
That means leverage is now a major component of price discovery.
Short liquidations can accelerate the upside, but leverage works in both directions.
If the market suddenly reverses, leveraged long positions can accelerate the downside just as quickly.
BULLISH SCENARIO FROM $1,215
At $1,215, the bullish scenario is straightforward.
First: ZEC holds $1,200.
Then: ZEC breaks $1,250.
After that: $1,300 becomes the next psychological target.
If $1,300 turns into support, the market can begin looking toward $1,400 and eventually $1,500.
The ideal structure would look like:
$1,200 SUPPORT → $1,250 BREAKOUT → $1,300 ACCEPTANCE → $1,400 MOMENTUM EXTENSION → $1,500 MAJOR TARGET
This would represent a continuation of the current price-discovery phase.
But there is one condition: VOLUME MUST SUPPORT THE MOVE.
BEARISH SCENARIO FROM $1,215
The bearish scenario begins with a failed breakout.
If ZEC repeatedly rejects the $1,240–$1,250 region and then falls below $1,200, momentum could begin weakening.
The first major downside reference would be $1,120.
This area corresponds closely with the previous upper Bollinger region.
If $1,120 fails, the next important area becomes $1,050–$1,020.
This is where the EMA5 reference around $1,023 becomes particularly important.
If that area holds, buyers could attempt to rebuild momentum.
If it fails, $940–$950 becomes the next major reference, corresponding approximately with the EMA10.
A much deeper breakdown could expose $855 as a structural support zone.
However, $855 should not be treated as an immediate target while multiple higher support levels remain intact.
THE MOST IMPORTANT QUESTION RIGHT NOW
Forget $1,500 for a moment.
Forget $1,400.
Forget even $1,300.
CAN ZEC HOLD $1,200?
That is the entire short-term battle.
At $1,215, ZEC is currently sitting just above the breakout.
If buyers successfully defend this region, the market structure remains extremely constructive.
If ZEC starts building candles above $1,200 and volume expands during that consolidation, the breakout gains credibility.
But if ZEC loses $1,200 and falls rapidly back toward $1,120, I would expect the market to enter a cooling phase.
That would not automatically mean the bull trend has ended.
It could simply mean the market needs to digest the massive gains.
MY CURRENT ZEC OUTLOOK
With ZEC around $1,215, my short-term bias remains:
BULLISH — BUT HIGHLY EXTENDED.
The bullish evidence is powerful.
Price is far above the major EMA structure.
MACD remains bullish.
OBV has been supportive.
The $1,200 psychological barrier has been broken.
ZEC has entered a new price-discovery environment.
But this is exactly where traders need discipline.
A strong trend does not mean every entry is a good entry.
After a vertical move, chasing price can create poor risk/reward.
I would rather see: $1,200 HOLD → CONSOLIDATION → VOLUME CONFIRMATION → $1,250 BREAKOUT.
MY UPDATED ZEC PRICE MAP
CURRENT PRICE: $1,215
KEY BREAKOUT: $1,200
IMMEDIATE HIGH ZONE: $1,250
NEXT TARGET: $1,300
MOMENTUM TARGET: $1,400
EXTENDED BULLISH TARGET: $1,500
FIRST MAJOR SUPPORT: $1,120
SECOND SUPPORT: $1,050–$1,020
EMA10 SUPPORT: $940–$950
DEEPER STRUCTURAL SUPPORT: $855
The setup remains bullish as long as ZEC continues defending the breakout area.
FINAL VIEW
ZEC has already delivered the breakout.
Now it needs to deliver CONFIRMATION.
At $1,215, the market is sitting above the critical $1,200 threshold.
The next confirmation would be a move above $1,250 with expanding volume.
$1,300 → $1,400 → $1,500 🚀
But if ZEC loses $1,200 and cannot reclaim it, attention shifts toward:
$1,120 → $1,050–$1,020 → $940–$950
The key is not to become emotionally attached to either direction.
The trend is bullish.
The momentum is extraordinary.
But the market is also stretched.
Therefore, I would watch confirmation rather than chase every green candle.
$1,200 IS NOW THE LINE IN THE SAND.
Above $1,200: BULLS REMAIN IN CONTROL.
Above $1,250: PRICE DISCOVERY CAN ACCELERATE.
Above $1,300: $1,400–$1,500 BECOMES INCREASINGLY RELEVANT.
Below $1,200: COOLING RISK INCREASES.
Below $1,120: CORRECTION RISK BECOMES MUCH MORE IMPORTANT.
ZEC has already proven that buyers can create an explosive move.
NOW THE MARKET NEEDS TO PROVE: CAN BUYERS DEFEND THE NEW TERRITORY THEY HAVE CONQUERED?
That is the signal I am watching.
Not just the next green candle.
Not just the next headline.
Not just the next price target.
THE REAL CONFIRMATION IS WHETHER $1,200 BECOMES SUPPORT.
If it does, this ZEC price-discovery story may have another powerful chapter left.
Trade with a plan, manage leverage carefully, and remember that extreme momentum can create extreme volatility in both directions.
#ZEC突破1200美元续刷新高 #ZEC @Gate_Square $ZEC ‌
repost-content-media
$1000 to $100,000 Crypto Trade Challenge Today
live-cover
LIVE1,643
GM CT ☀️
New week, new opportunities.
BTC looks interesting, ETH is moving, and somewhere out there an altcoin is probably preparing to make everyone question their life choices 😂
Stay early. Stay sharp. Don’t FOMO into every green candle.
Build, trade, learn and enjoy the chaos.
Let’s get it this week. 🫡
post-image
BTC-0.38%
ETH-0.12%
Plan for the rest of the month
post-image
Good morning friends.
Time to lock in.
Now or never.
post-image
#BTCDropsBelow80K
The August nonfarm payrolls number came in at 162,000, well above expectations. Fed rate-hike odds moved above 60 percent and Bitcoin slipped back under the 80,000 level. What had been support is now being tested as resistance. The open question is whether price can hold the 79,000 area or whether the next test sits in the 76,000–77,000 zone.
On the chart price is currently trading near 79,742 after failing to hold above 80,000. A break of structure is marked near the recent highs, with fair value gaps still visible in the upper range. The 50 percent and 80 percent discount
BTC-0.38%
BTC-0.37%
  • 2
gm my internet frens
post-image
🌈 Today's official promotion - Gate Golden Dog is officially live! A new Meme trading experience, with limited-time gas-free trading on Robinhood Chain!
Add [Golden Dog] to your livestream title and explain the relevant content to receive additional promotional exposure and livestream airdrops!
📌 Suggested topics:
🔹 Gate's brand-new all-in-one on-chain trading product, Golden Dog, is officially live! It focuses on a Meme social trading ecosystem, delivering a more efficient on-chain trading experience
🔹 What new features does Golden Dog offer? Introduce community interaction features such
post-image
MEME-0.46%
  • 2
  • 1
ETH slips back under $2.5k, still +0.79% on the day. If this level holds as support, near-term momentum could hinge on BTC risk-on flow. $ETH
ETH-0.12%
BTC-0.38%
Load More

Join 40 M users in our growing community

⚡️ Join 40 M users in the crypto craze discussion

💬 Engage with your favorite top creators

👍 See what interests you

View More