

Square
Following
Hot
News
Profile
Share your thoughts
placeholder
Article
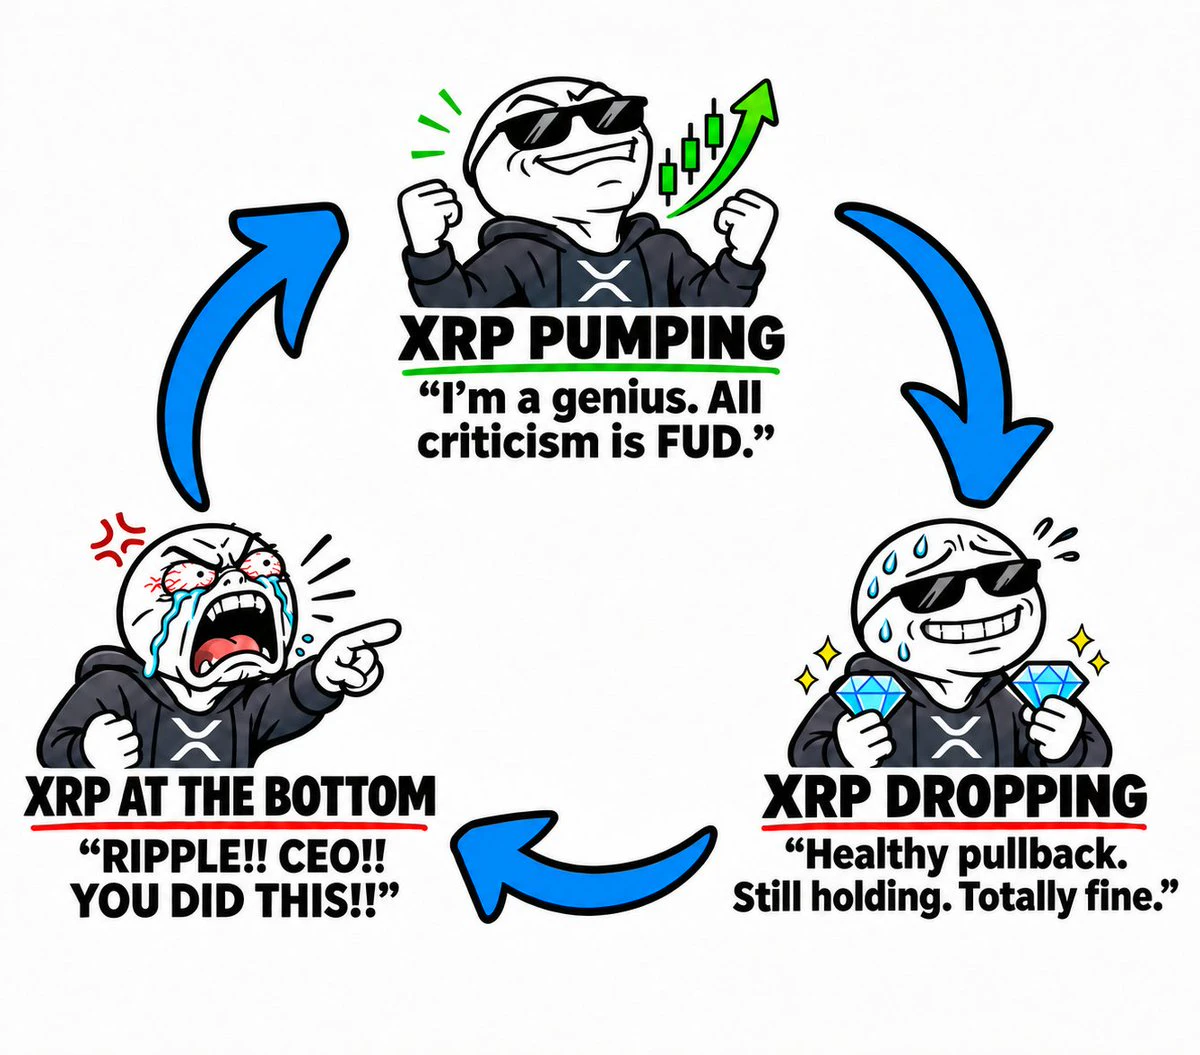
The $XRP Investor Emotional Cycle..
post-image
XRP-1.15%
I'm full; time to sleep. 💤
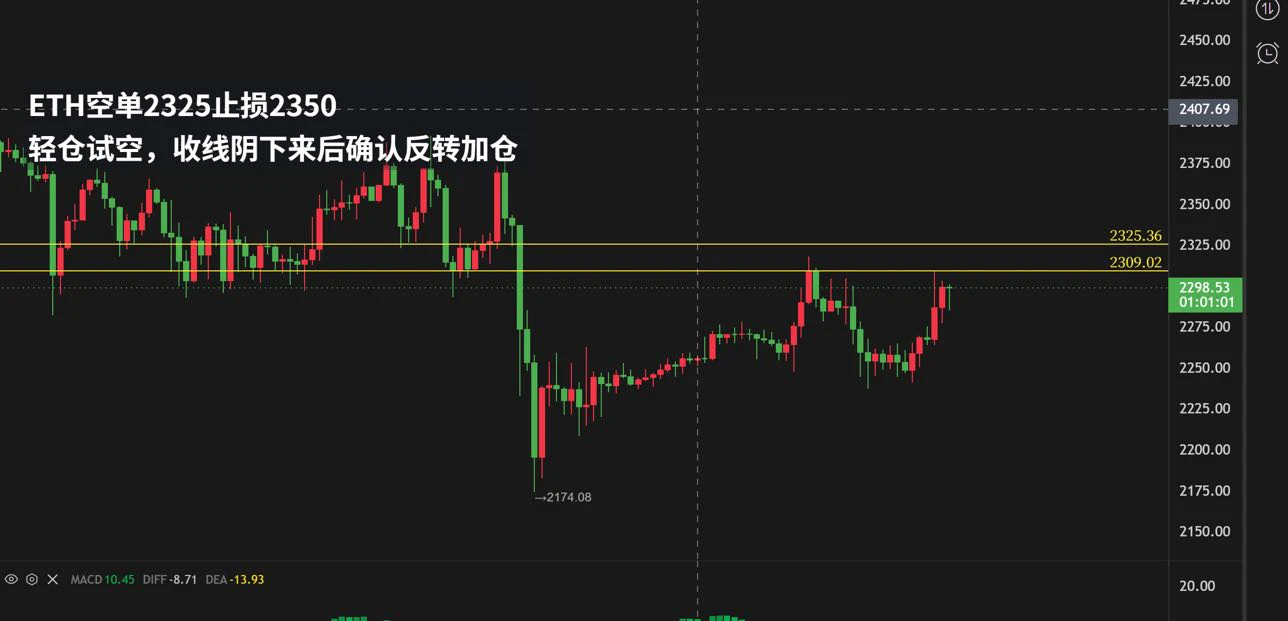
Yesterday at 4 a.m., I closed my short and flipped long $ETH
I've been waiting until now; when you spot the right market move, you have to hold on
$ZEC , not much to say: the low was 1120, it didn't even break 1100—go long
Put simply, the 11.3 Silk Road setup was an easy profit if you saw it 🥩.
#美国中期选举今日投票
#Gate多项排名全球Top2
#美股财报季
ETH-1.23%
ZEC+1.29%
Trenches
ZIG
Z
bade
b
ZIG
0x8c...1145
Market Cap
$.
Change
.
24h Vol
$.
Holders
.
STONK
S
bade
b
STONK
6GmA...UNgx
Market Cap
$.
Change
.
24h Vol
$.
Holders
.
AGT
A
bade
b
AGT
0x5d...e274
Market Cap
$.
Change
.
24h Vol
$.
Holders
.
MAMESUKE
M
bade
b
MAMESUKE
SCGB...STNK
Market Cap
$.
Change
.
24h Vol
$.
Holders
.
FLOAT
F
bade
b
FLOAT
Bv1a...BMmr
Market Cap
$.
Change
.
24h Vol
$.
Holders
.
11/4
ETH wealth code
Shorts lie in wait before 7 a.m.
post-image
ETH-1.23%
  • 1
LIT | Long 🟢 | Bullish | 15m24h: +10.65% | Volume: 91.1M USDT Long rationale: Price is above EMA200; EMA20/50/200 are in bullish alignment; RSI14 is 68.9; MACD histogram is positive; ADX14 is 50.2; volume is 0.40x the 20-candle average; trend pullback/continuation. Entry: 3.4372 Stop-loss: 3.3089 Take-profit 1: 3.59757 | Take-profit 2: 3.6938 | Take-profit 3: 3.8221 Entry price is for reference only; do not chase. This strategy is invalidated if the stop-loss price is hit. This is a technical strategy only and does not constitute financial advice. $LIT
post-image
LIT-4.56%
GN CT 🌃
Holding $RIVER and using satUSD to earn yield are two different things.
With @RiverdotInc, users can hold satUSD as a dollar-pegged stablecoin or put it to work through supported DeFi strategies.
The first is about holding value. The second comes with extra risks from liquidity, smart contracts and market movements.
Sleep well legends 💤
post-image
CT-12.34%
crypto market update btc
live-cover
LIVE2,341
GN if you GN💤
post-image
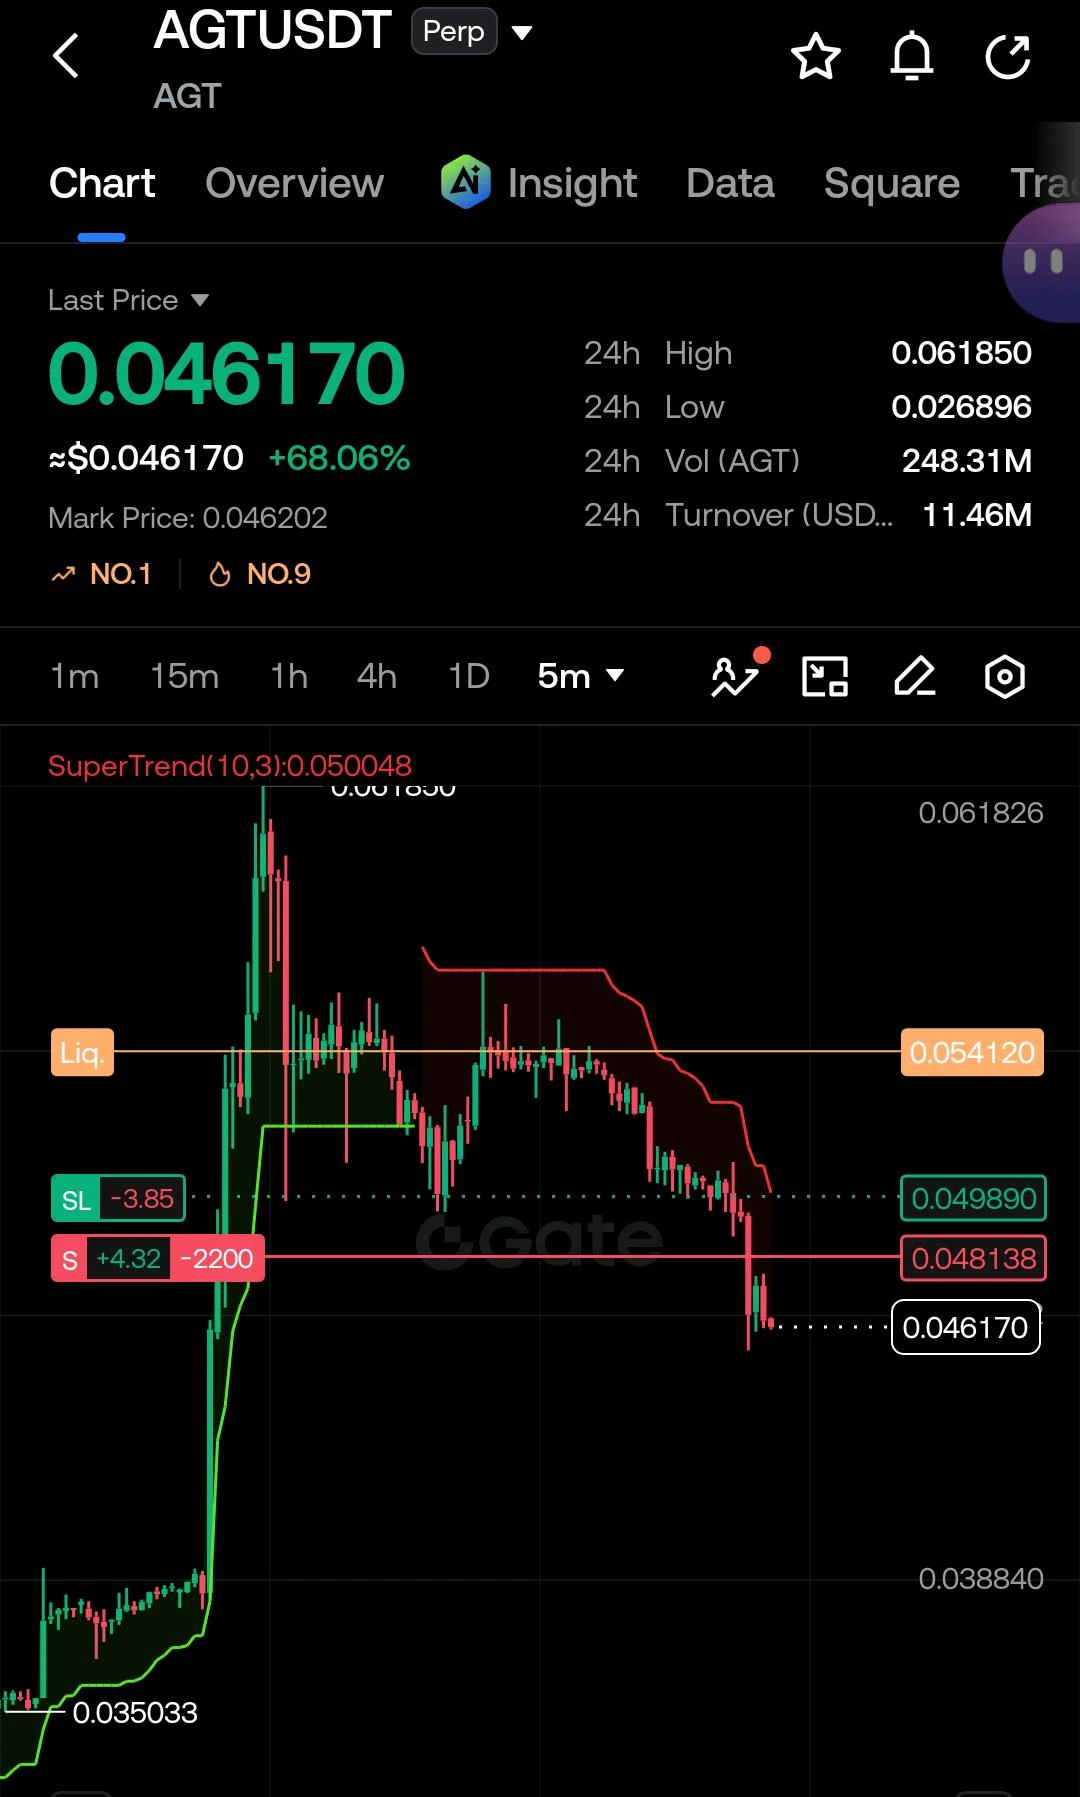
🚨 $AGT ‌USDT — SHORT 🔻
🔰 LEVERAGE: 1X–20X
📉 SHORT
✅ ENTRY: $0.0460–$0.0480
🎯 TP1: $0.0440
🎯 TP2: $0.0420
🎯 TP3: $0.0380
🔴 STOP LOSS: $0.0505
📊 OUTLOOK:
After a massive rally, AGT is showing bearish momentum. A further pullback toward lower support levels is possible. 📉
post-image
AGT-26.77%
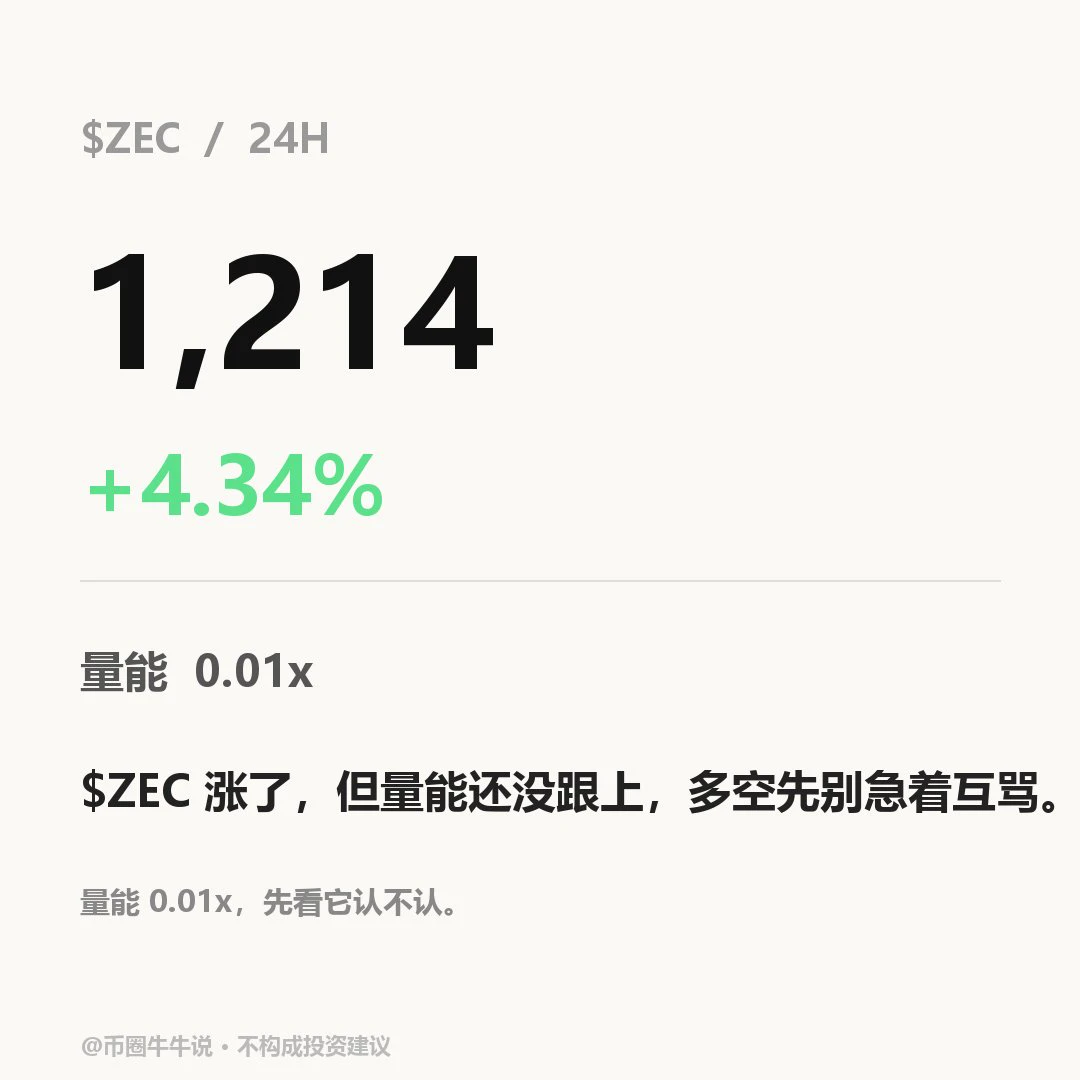
$ZEC Currently at 1213.96, up 4.34% over 24 hours (range: 1121.6–1229.54; trading volume: 83.5676 million). The 1H trend is strong, with RSI at 77.84 and EMA20 at 1188.50; the 4H trend is strong, with RSI at 45.39 and EMA20 at 1213.26. Volume is 0.0068x the average. If price holds above the 1229.54 resistance level, monitor what happens next; if it breaks below the 1121.6 support level, momentum may weaken. In the follow-up review, check whether price can hold above 1229.54 and whether it can reclaim 1121.6 after a breakdown. A breakout without volume or an inability to reclaim the level after
post-image
ZEC+1.16%
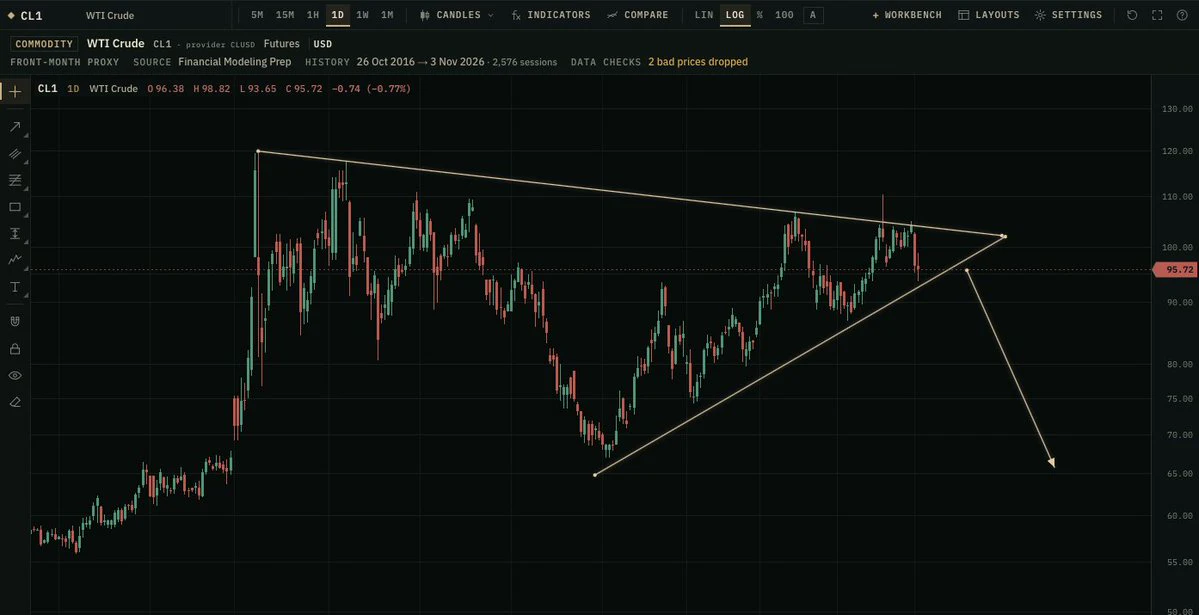
Looks like $OIL is trying to tell us something...
post-image
Arbitrum may allow Stylus contract launches again. But now with mandatory verification.
Voting on the proposal to resume activations of new Stylus contracts on Arbitrum One continues until November 5.
Stylus allows developers to create smart contracts not only in Solidity, but also in other programming languages, including Rust.
Following the suspension of new activations on October 2, the proposal is to resume launches, but with a condition: every new contract must undergo a limited security audit and receive approval for activation.
This change does not affect contracts already in operation.
post-image
ARB+1.17%
$BTC Bullish signals are igniting again, and Bitcoin may be gearing up for a fresh rally!
My personal view is that $BTC will rise decisively from this range.
Entry range: $7,600–$77,800
First target ,000 Second target: 79,000 Third target: 80,310 Defense level: 76,300
The logic is straightforward.
$BTC found strong support around 76,400 and bounced quickly, while bullish momentum is gradually building. As long as buyers continue to dominate the market and price successfully reclaims $78,000, a move up to 79,000 and then 80,310 would be the natural next step.
The key thing I’m watching now is
post-image
78
7878
Pump.Fun
MC:$2.58KHolders:1
0%
BTC-0.67%
Come on, man, let's get a real pair of earbuds. There are 7 people in the elevator, and 6 of us have iPhones. Good grief, you open your earbud case and all 5 of our phones get the pop-up🤣🤣🤣
post-image
Is this rebound finally about to gain real momentum, or is it another trap? $APR looks like it wants to hold steady here, but honestly, I’m tired of watching these fake breakouts all week. I just hope it finally picks a direction. Take profit: 0.04550Stop loss: 0.04014Other coins: $ZEC : Current price 1,212.66 - 24-hour gain: +4.94%$ICNT : Current price 0.2271 - 24-hour gain: +27.94%
post-image
APR-10.63%
ZEC+1.16%
ICNT-10.32%
$BR ‌ is showing fresh buying interest, but the real test is still ahead.
Price is back near $0.49 after defending the $0.2917 low. The recent recovery looks encouraging, and buyers are trying to build a base around current levels.
Levels worth watching:
Support: $0.46–$0.47, then $0.4127
Resistance: $0.50, followed by $0.68–$0.69
A clean break above $0.50 could give bulls room to push higher. However, the daily Supertrend remains bearish at $0.6861, so a proper trend reversal still needs confirmation.
BR has made a decent recovery. Now the focus is on whether buyers can sustain it rather tha
BR+6.00%
MU+1.90%
  • 4
#WCTCS9 #XAU #ShareWeekly
XAU/USD Gold Market Analysis: Price, Strategy, Long and Short Plans, and Key Levels
Gold (XAU/USD) is trading near $3,924 as of the latest snapshot on 3 November 2026 (UTC). The session range was roughly $3,895 to $3,971, and the metal is down about 0.56% on the day. Price is still well below its short-term moving averages, which keeps the near-term bias bearish. The market is also waiting for major US event risk this week: the midterm elections, ISM manufacturing data, and Friday's September Nonfarm Payrolls report. Those events could make this a volatile week, so t
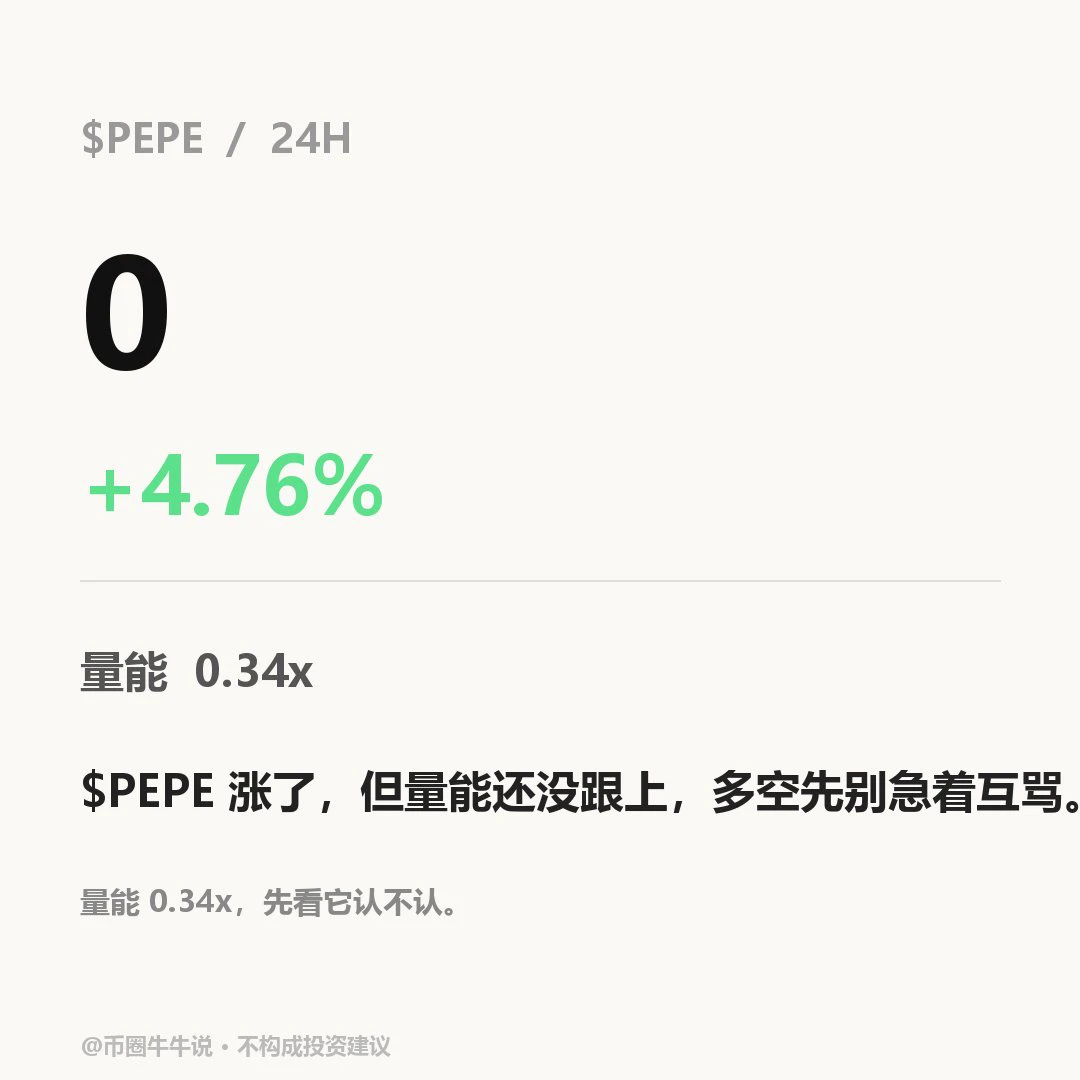
$PEPE Currently trading at 0.00000484, up 4.76% over 24 hours (range: 0.0000046–0.00000502). The 1-hour trend is strong, with an RSI of 70; the 4-hour trend is also strong, with an RSI of 46. If the price breaks above 0.00000502 decisively, watch for further upside. If it falls below the 0.00000464 support level, the short-term structure may weaken. The market is volatile; for observation purposes only.
post-image
PEPE+0.97%
The oil price reaction is what was most worth watching last night.
The U.S. struck an Iranian island near the Strait of Hormuz. In theory, news like this should send oil prices jumping at least initially, since around 20 million barrels of crude oil and refined products pass through the Strait every day—roughly one-third of global seaborne oil. Any “risk to the strait” can easily be amplified into expectations of supply disruptions. But what happened? Brent was at $106 a barrel this morning, after plunging 7.6% the day before—a drop of about $8 in a single day, based on prices above $100. The
post-image
  • 9
Gm #crypto
Remember this, only you can decide to get wealthy or Stay poor .
post-image
Load More

Join 40 M users in our growing community

⚡️ Join 40 M users in the crypto craze discussion

💬 Engage with your favorite top creators

👍 See what interests you

Trending Topics

USMidtermsVoteToday

27.99k Views844 Discussing

The U.S. midterm elections are being held today, with all 435 House seats and 35 Senate seats on the ballot. The results will shape control of Congress and could influence future fiscal, economic and crypto regulatory policy. What are you watching most closely — control of Congress, fiscal policy or crypto regulation? Which market will price in the outcome first: U.S. stocks, gold or crypto?

GateRanksTop2AcrossMultipleCategories

16.02k Views3.06k Discussing

USEarningsSeason

465.67k Views3.36k Discussing

View More