Share your thoughts
placeholder
Article
$ARB Signal】Long: 1H lower band reclaimed, 4H bullish volume bar remains
$ARB Current price 0.18481, 1H lower band 0.1802; bears previously pushed the price down to 0.18055 before it recovered. The 4H MACD histogram remains positive at 0.0042, RSI 1H is 55.5 and has not entered overbought territory, and short-term momentum has not completely turned bearish.
🎯Direction: Long
⚡Entry/pending order: 0.1842556 - 0.1848100
🛑Stop loss: 0.1829619
🚀Target 1: 0.1875822
🚀Target 2: 0.1889682
🛡️Trade management:
- Execution strategy: Reduce the position by 50% after reaching Target 1, and move the st
post-image
ARB+13.43%
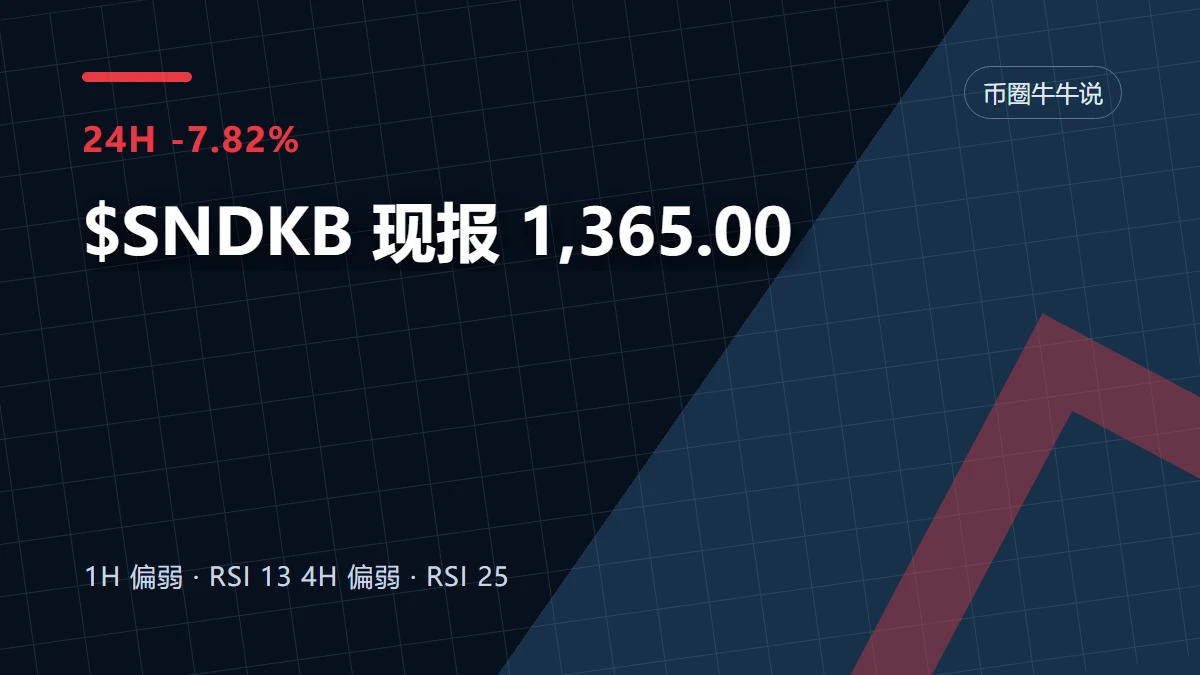
$SNDK /USDT Perp – "Bullish Recovery – Long"**
**Trading Plan Long $SNDK
Entry: 1782.00
SL: 1775.00
TP1: 1787.33
TP2: 1797.63
Explanation: Strong bullish bounce off the 1760 low with a rising MACD (1.92), targeting the yellow resistance and the
post-image
SNDK+1.09%
  • 6
  • 2
I was just about to go rant on the forum, but then I saw my balance and decided against it—the market is always right. When everyone else is running, what I most want to do is short into the weakness, without fighting the sentiment, just letting the price action speak.
$TSLAX was opened at 361.69, and the current price just now was 356.44, with a position return of +134.93%. This big chunk of profit is enough to cover several good meals.
Why did I dare to short it? The support was too weak, and volume couldn't keep up. Every rebound looked like bait—once it moved up, nobody was there to catch
post-image
TSLAX-0.27%
ADA+0.27%
ZEC+20.79%
No trades, no analysis, all thanks to sheer luck—this result is almost embarrassing to talk about 😂 After lunch, when I checked the chart, I was about to close the short, but the market handed me another move.

The short entry was nothing special, at 4486.7. The logic was simple: volume at the highs couldn't keep up, selling pressure stayed heavy, and the rebound looked more like an illusion for people trying to get on board. At that moment, I thought holding this structure was a win.

The price is now at 4417.9, and the short is up +142.12%. It's not that my prediction was amazing—the mark
post-image
SOL+2.25%
ETH+0.78%
YO WTF JUST HAPPENED???
post-image
Layout for Bitcoin, Ethereum, and Dogecoin
live-cover
LIVE3,603
  • 1
With this price action, I don’t even need to think—the account is dancing on its own. When the market was just dumped in the early session, I already warned not to rush into buying; a rebound without volume is just bait.
The rebound is weak, volume isn’t keeping up, and there’s still a pile of sell orders overhead. This setup isn’t beyond saving, but we need to wait for the bears to exhaust their strength first. I opened a short position around 0.46953 and held it with complete peace of mind.
Now it’s at 0.02818, with a return of +2305.06%. The market played out the script on its own—what a ru
post-image
LAB-5.07%
SNDK+1.09%
$ETH /USDT Perp – "Recovery Bounce – Long"**
**Trading Plan Long $ETH
Entry: 2489
SL: 2480
TP1: 2498
TP2: 2522
Explanation: Strong bounce off the 2462 low with MACD turning positive, targeting the 2498.70 yellow resistance and the 2522 high
#HYPEBreaks88HitsNewAllTimeHigh
post-image
ETH+0.78%
  • 2
This $FF long trade early this morning was a pullback confirmation after a breakout on the hourly chart. I entered at 0.10489, with the stop-loss placed below the lower boundary of the range. The price action was grinding and testing my patience; consecutive small bearish candles failed to break the key level, while volume contracted. I held the position without moving, and two small wicks failed to take me out.
When it pushed up on increased volume, I first took profit on 70%, then moved up the protective stop on the remaining position. I did not chase because the move was too fast, making th
post-image
FF-0.03%
ADA+0.27%
LAB-5.07%
This move is so obvious I don't even need to think—the account is dancing on its own.

I opened the chart this afternoon and immediately saw something was off. The short position I had originally opened was already in floating profit, with the price sliding directly from 0.015588 to 0.011417 and the return climbing to +526.98%. After grinding sideways for half a day, the breakout was truly sweet.

A quick explanation of why I dared to short: during the repeated intraday choppiness, every push higher fell just short, and the volume failed to follow—clearly giving off strong bull-trap vibes. W
post-image
SNDK+1.09%
DOGE-1.06%
Touching grass on Sunday 💯
Enjoy your Sunday 💙
post-image
Everyone’s watching the 4h—but what if NEAR just front-ran your breakout?

$NEAR /USDT - LONG

Trade Plan:
Entry: 2.3686 – 2.3998
SL: 2.2345
TP1: 2.4965
TP2: 2.5713
TP3: 2.6836

Why this setup?
Why now? The 1D trend is bullish, yet the 15m RSI sits at 48.6—neutral, not exhausted. With a 95% confidence LONG on $NEAR /USDT, the entry zone (2.3686–2.3998) is a coiled spring. ATR (0.0623) suggests room to run: TP1 at 2.4965 is +4.7%, TP2 at 2.5713 is +7.8%. The “waiting” status means the market hasn’t moved yet—this is the quiet before the liquidity grab.

Debate:
If price dips to 2.3686, do y
NEAR+11.63%
I still stand by my view: the bear market isn’t over. Test the waters with a small position and set a stop-loss. Short, short, short!!
post-image
BTC BOLD MOVES
live-cover
LIVE26
$HEMI chart looks promising for a trade on this region, keeping a close eye 👀
post-image
HEMI+5.14%
🤣🤣🤣, Trump, stop stalling and get a move on—everyone's waiting to make some money $ETH $GT $ZEC #美国8月非农超预期
post-image
ETH+0.78%
GT-2.20%
ZEC+20.79%
  • 5
Tom Lee: September Fed pause could trigger a massive market rally
Fundstrat's Tom Lee is flipping his short-term thesis: instead of a 10% September pullback, he believes a mounting market wall of worry could spark a major upside surprise. Key takeaways from his CNBC interview:
- If the Fed holds rates steady at the September 15 meeting (his base case), equity markets could rally mid-month sharply.
- Lee sees the S&P 500 pushing past 8,000 before a potential October correction down toward 7,374. His year-end target of 8,200 might even be too conservative given 2027 S&P earnings estimates revisi
post-image
SPX500+0.02%
SPX-4.89%
BTC+0.13%
$STRK - A pretty consistent pattern on this coin that whenever OBV breaks out before price a 100%+ move follows. Break the diagonal and probably looking at a 200% play. All speculation but so far volume is leading the way and price in theory should follow.
post-image
STRK+2.92%
Since early February 2026, Bitcoin has remained in a bear market after falling below both the True Market Mean and Short-Term Holder Cost Basis.
The Short-Term Holder Cost Basis has now dropped to $68.5k, below the True Market Mean at $75.8k. This means Bitcoin is trading below the cost basis of both recent buyers and the broader investor base.
Historically, this setup is linked to the capitulation phase, where market bottoms often form. As long as Bitcoin stays below the Short-Term Holder Cost Basis, the market remains in a capitulation phase—creating opportunities for new buyers, but leaving
post-image
BTC+0.13%
  • 3
  • 2
Load More

Join 40 M users in our growing community

⚡️ Join 40 M users in the crypto craze discussion

💬 Engage with your favorite top creators

👍 See what interests you

View More