Share your thoughts
placeholder
Article
Nobody is talking about the quiet setup forming in $WLD /USDT right now.

$WLD /USDT - SHORT

Trade Plan:
Entry: 0.4157 – 0.4201
SL: 0.4385
TP1: 0.4024
TP2: 0.3921
TP3: 0.3766

Why this setup?
Why now? The 1h price is sitting at 0.4178 inside a tight range, and the 15m RSI reading of 43.13 shows momentum is fading just enough to favor sellers. The daily trend is range-bound, which means this asset is coiling for a directional move and the 1h ATR of 0.008604 tells us the next impulse could be sharp. The entry zone between 0.4157 and 0.4201 lines up perfectly with the short bias, targeting TP
WLD-0.84%
I didn’t make any judgment call—I just held it a little longer and didn’t expect it to actually come through.
A few days ago, I looked at $HEMI before bed. Buying pressure was strengthening and the pullback held, so I only said one thing at the time: don’t rush to sell, give it some time.
From 0.005583 to 0.006209, +220.93%. The wait wasn’t in vain—I timed this move right.
Take 80% of the profits first, set 30% at the breakeven price for protection, and deal with it if it keeps pushing. The premise of compounding is staying alive; the shortcut to getting rich overnight is often going to zero.
post-image
HEMI-5.13%
BNB-1.68%
SOL-3.11%
$PIEVERSE Signal】Long + 1H wick recovery, 4H moving averages providing support
$PIEVERSE 1H flash-crashed from 1.9384 to 1.6433, with the current price at 1.6796 and wick volume of 5.35 million. The 4H price remains above EMA20 at 1.5372 and EMA50 at 1.3747, with the trend structure intact. 1H RSI is 50.94 and 4H RSI is 59.31, with momentum returning to the midpoint. The MACD 1H/4H histograms are contracting simultaneously, as chasing capital temporarily pauses. Order book depth imbalance is -17.95%, the buy/sell ratio is 0.70, and selling pressure is concentrated overhead. The funding rate i
post-image
PIEVERSE+3.09%
After a 56% surge in a single day, can $ONE still be chased? The answer depends on whether your position can withstand a pullback.
ONEUSDT is currently at 0.004006, up 56.18% over 24h, with an amplitude of approximately 72% across 30 candlesticks, placing volatility in an extreme range. Technical indicators are not aligned: MA5=0.0040212 has fallen below MA20=0.0040883, the MACD histogram is -7.37e-05 and remains bearish, while RSI is only 55.5, indicating that this surge was a pulse-like spike rather than a healthy trend with bullish moving-average alignment. More importantly, the funding ra
post-image
ONE+64.96%
COTI-15.04%
EPIC+15.91%
#GateTopsStockPerpetualCoverage
#GateSquareMidAutumnReunion
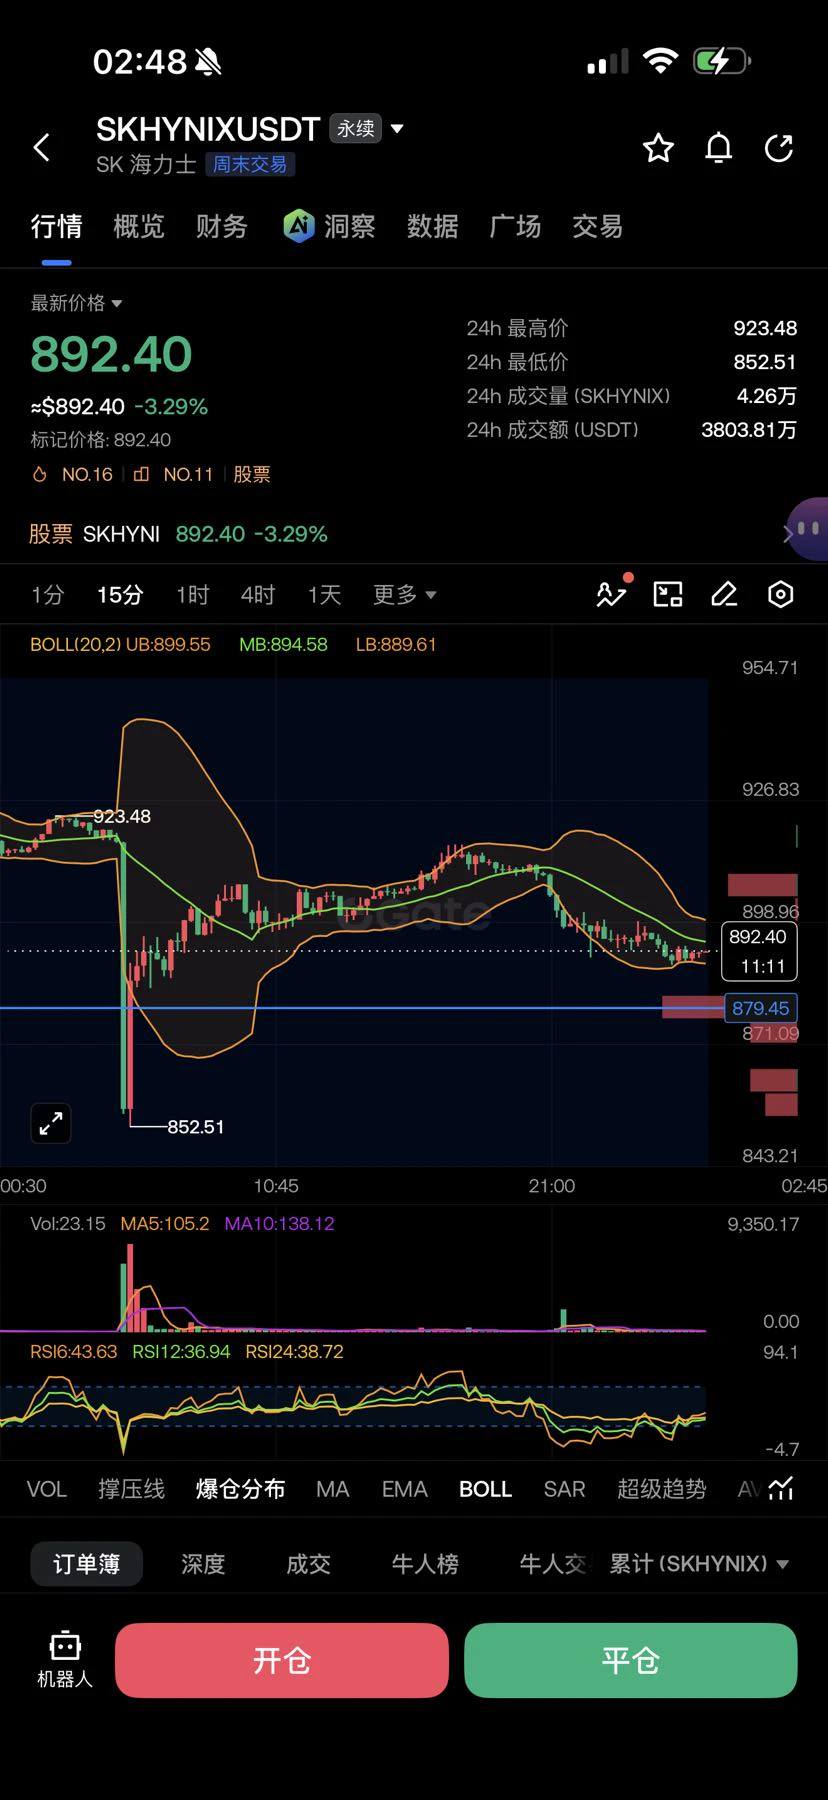
GateTopsStockPerpetualCoverage is showing me a bigger picture of where modern trading is heading. Gate is not simply building another crypto trading platform; it is continuously expanding the range of markets and trading instruments available to its users. The growing Stock Futures ecosystem is a strong example of this evolution, bringing hundreds of stock-linked perpetual contracts into a digital trading environment where traders can analyze opportunities across technology, AI, semiconductors, Nasdaq, crypto-related equities and ot
post-image
Why is everyone ignoring the obvious short setup forming on XLM?

$XLM /USDT - SHORT

Trade Plan:
Entry: 0.19387 – 0.19505
SL: 0.20012
TP1: 0.19022
TP2: 0.18739
TP3: 0.18314

Why this setup?
Why now? The daily trend is range-bound, which often precedes a sharp directional move, and the 1h RSI at 69.2 signals weakening momentum on the short side. The 1h ATR of 0.002358 confirms enough volatility to reach our targets. We enter at 0.19446 with TP1 at 0.19022 and TP2 at 0.18739, while the invalidation level sits at 0.18989, acting as the hard line in the sand. The entry zone between 0.19387 and
post-image
XLM-2.71%
$CELR Conclusion first: short-term bullish, but this is a “buy-the-dip confirmation after a sharp rally” setup, not a buy-the-highs setup; the key is whether MA5 can hold.
Here is a reusable way to assess it using moving averages: In a healthy uptrend, price should remain above MA5, while MA5 should be above MA20 and diverging upward. CELRUSDT is currently at 0.004032, with MA5=0.0041292 above MA20=0.00397. The moving-average structure remains bullish, indicating that the 24h +71.28% rally has not yet damaged the medium-term trend structure. However, the current price has fallen below MA5, a s
post-image
ONE+64.96%
Why is everyone suddenly quiet about SYMBOL right before a massive move?

$NEAR /USDT - LONG

Trade Plan:
Entry: 3.649 – 3.693
SL: 3.463
TP1: 3.827
TP2: 3.931
TP3: 4.086

Why this setup?
Why now? The daily trend is firmly bullish, setting the stage for continuation. The 1h price sits at 3.671, matching the entry reference and placing us at the heart of the entry zone between 3.649 and 3.693. The 15m RSI at 64.83 shows room to run before hitting overbought territory, while the 1h ATR of 0.086523 confirms enough volatility to push toward the first target at 3.827 and beyond to TP2 at 3.931. T
post-image
NEAR+4.68%
$8 trillion in U.S. debt needs to be rolled over within a year. If the average coupon rises from 3.3% to the current 5%, that alone would add $136 billion in interest costs. Warsh understands the situation: the U.S. truly cannot withstand higher interest rates. Rate cuts are not a matter of whether it wants to cut, but whether it can afford not to. What do you think? If you’re watching the dollar, follow me.
post-image
$PIEVERSE ‌PIEVERSE/USDT
Why did PIEVERSE pump? Because it finally got a slice of the pie.
📉 Short
Entry: 1.75 – 1.85
TP1: 1.65
TP2: 1.55
TP3: 1.45
SL: 1.95
📈 Long
Entry: 1.50 – 1.55
TP1: 1.65
TP2: 1.75
TP3: 1.85
SL: 1.45
🔑 Key Levels
Resistance: 1.9203 / 1.9358 / 1.95
Support: 1.6586 / 1.5081 / 1.3258
⚠️ Not financial advice. DYOR & manage risk.
post-image
PIEVERSE+3.09%
$AVAX It surged 14 points in one day, so those chasing in now will most likely be left holding the bag. Here’s my plan: accumulate in batches on a pullback to 10.10–10.25, set a stop-loss at 9.28, take first profit at 10.80, and second profit at 11.60. Keep the position below 20% of total capital—don’t go all in.
First, here’s why 10.10 is the level. The 24-hour low was 9.294, the high was 10.823, and the current price is 10.669. This rally started around 9.3, and 10.10–10.25 is the mid-rally pullback zone, as well as the level where short-term profit-takers are most likely to sell. If it brea
AVAX+18.06%
Everyone was ready for crypto to get hit this week.
Instead, the market did the opposite.
$BTC held $75K, bounced 7% from the low and pushed back above $80K.
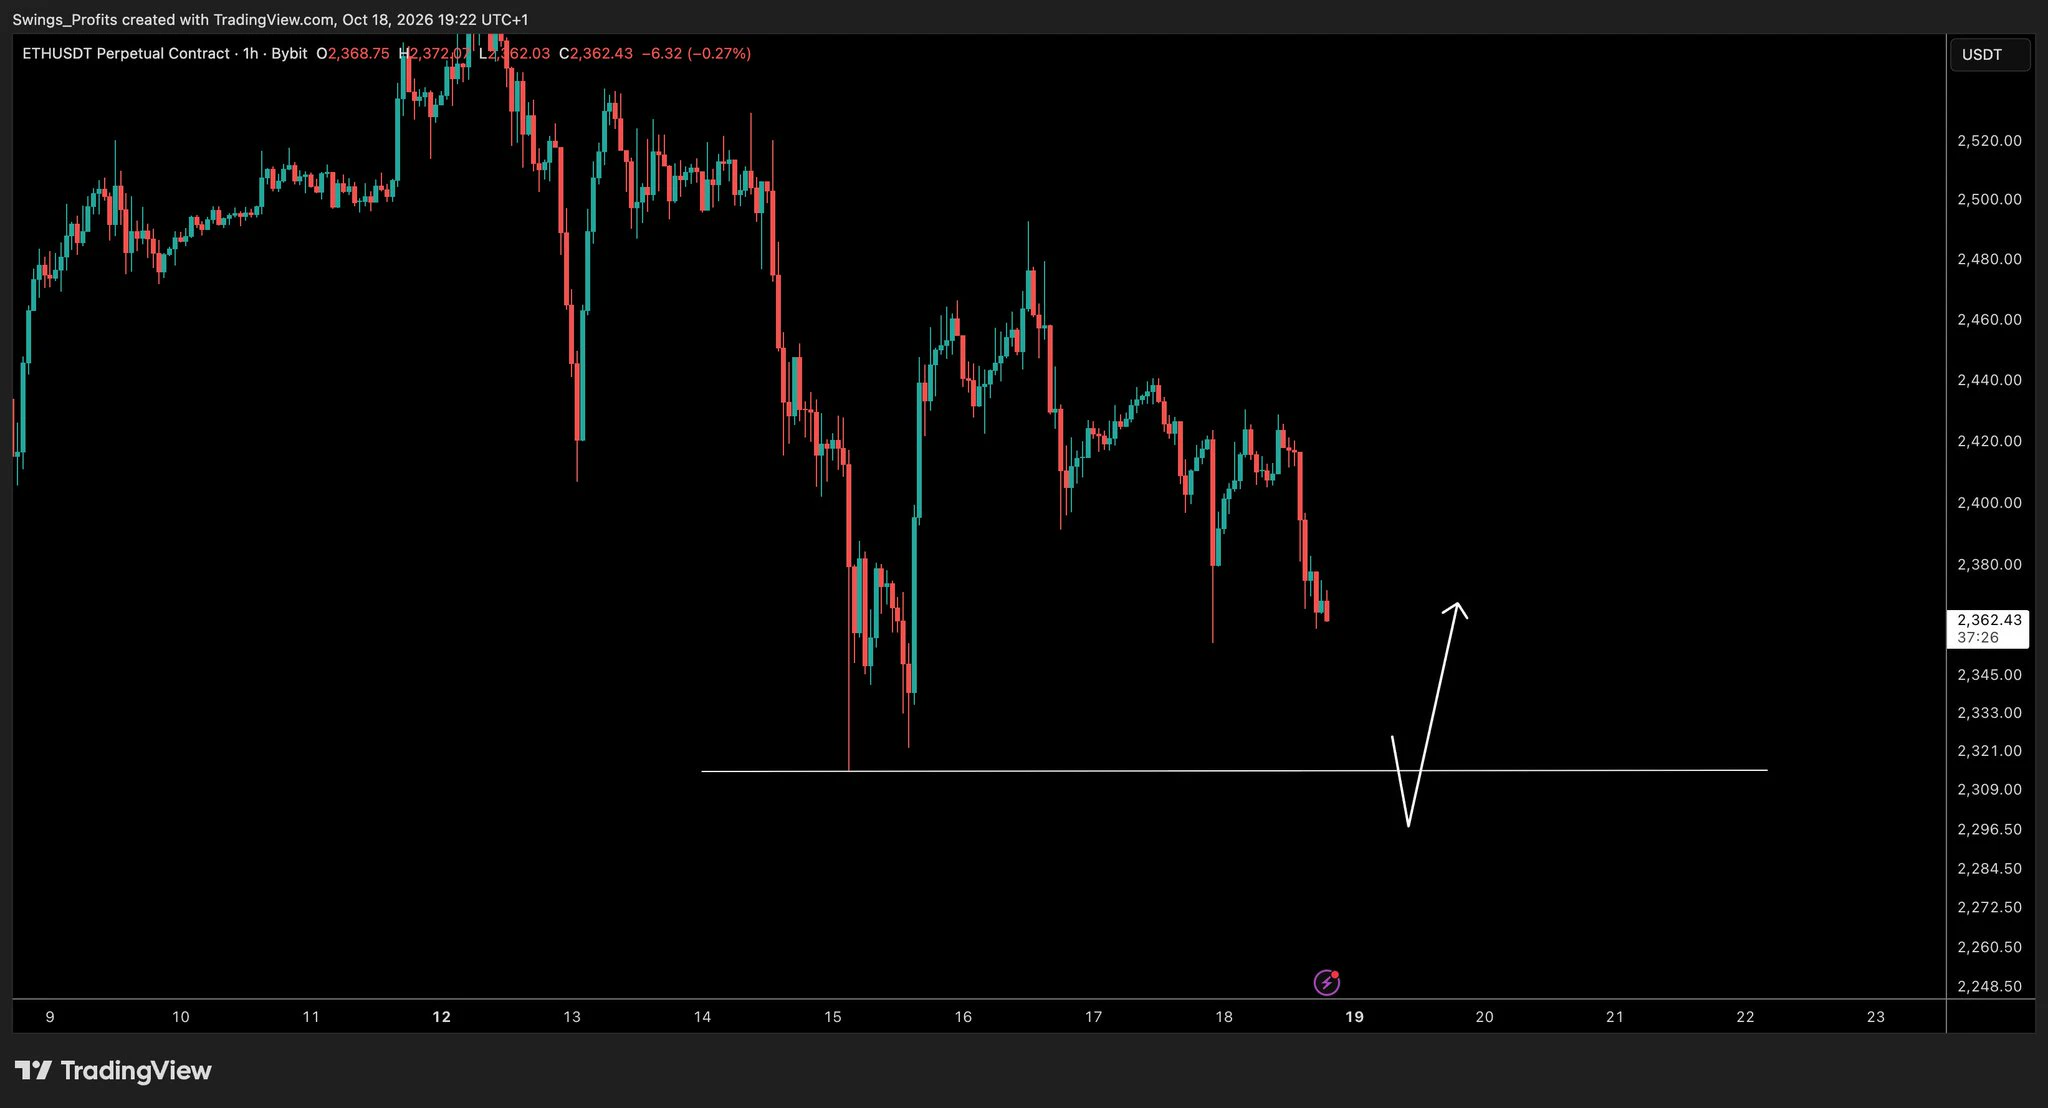
$ETH defended $2,350, gained 10% from the low and reclaimed $2,550.
Even ALTs came alive, up 17% from the recent low and back above $225B for the first time in 8 months.
Total crypto market cap also held $2.5T and recovered around $200B.
What makes this move interesting is the backdrop: CLARITY failed, the Fed hiked rates and oil stayed elevated.
Yet the major supports didn’t break.
That’s a good sign, but I’m not calling a new bull run
post-image
BTC-1.05%
ETH-1.60%
$G LONGENTRY: 0.006804TP1: 0.006940TP2: 0.007080TP3: 0.007260STOP: 0.006590Showing potential to rebound from the current area. If buyers can maintain dominance and trading volume increases, the price may move toward the next resistance level. Please watch for momentum confirmation before taking the next step.
$ENTR $TP1 TP2
post-image
#BTCRetakes80K In September 2026, the crypto market experienced a textbook case of inverse pricing.
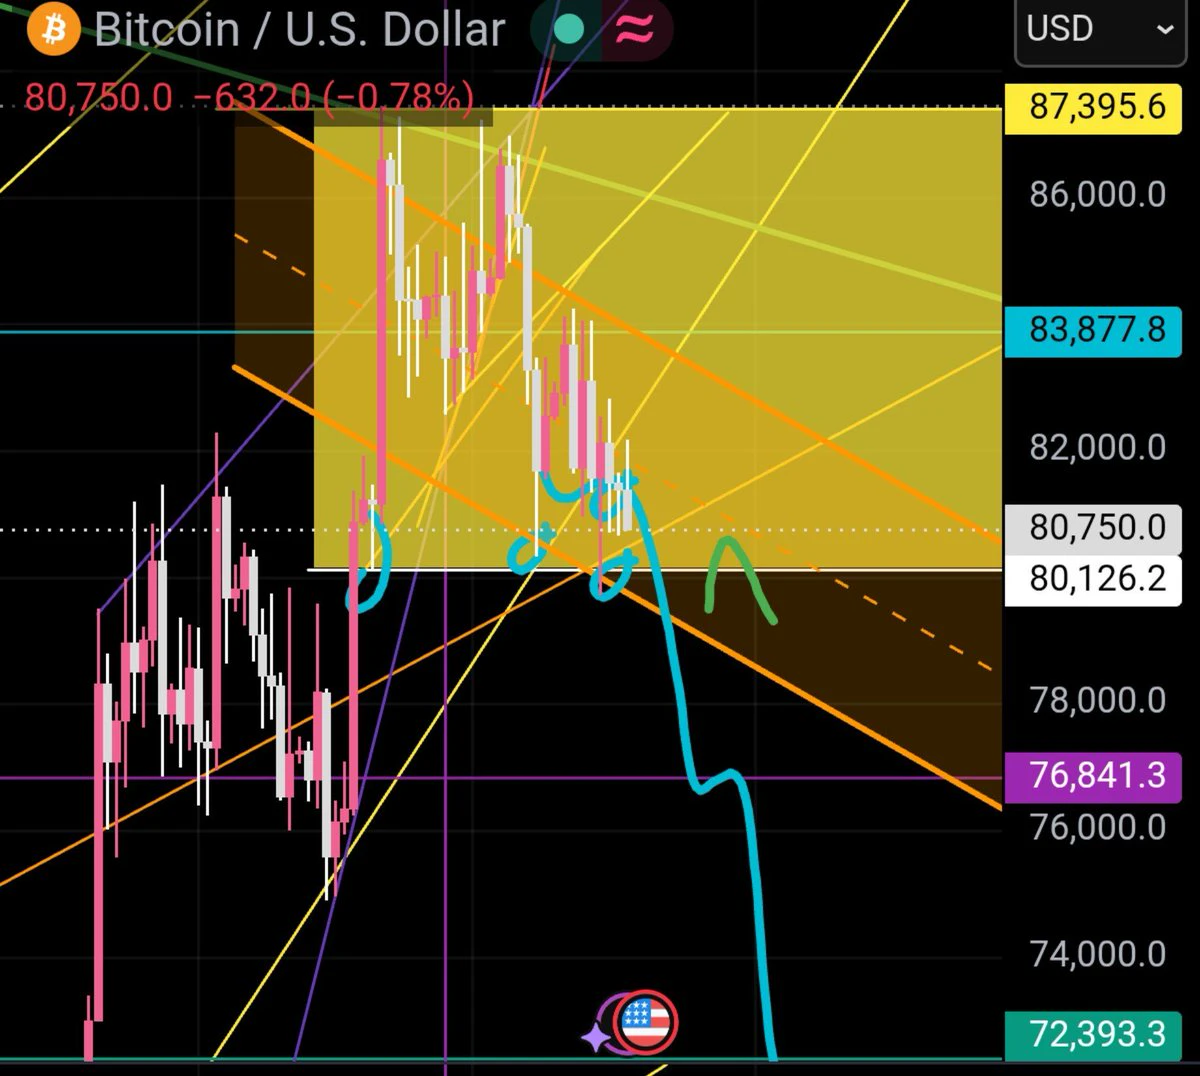
Amid the double shock of the Federal Reserve announcing its first 25-basis-point rate hike since July 2023 and the U.S. Senate rejecting the procedural motion for the CLARITY Act by 49 votes to 50, Bitcoin not only held above the key support level of 76,000 USD but instead launched a short squeeze rally on September 18, gaining approximately 6% and climbing back above 81,000 USD. As of September 20, 2026, based on Gate market data, BTC was fluctuating within a narrow range around 81,000 USD, wit
post-image
BTC-1.05%
Why is everyone suddenly fading LTC at 56.81?

$LTC /USDT - SHORT

Trade Plan:
Entry: 56.66 – 56.96
SL: 58.23
TP1: 55.75
TP2: 55.04
TP3: 53.98

Why this setup?
Why now? The daily trend is range-bound, but the 1h price at 56.81 sits on a razor-thin entry_ref, and the 1h ATR of 0.590091 shows enough volatility to push a short through the entry zone between 56.66 and 56.96. The 15m RSI at 46.16 confirms mild bearish momentum without oversold exhaustion, giving the trade room to run toward TP1 at 55.75 and TP2 at 55.04. The invalidation level at 55.39 is the hard line that protects the position
post-image
LTC-1.19%
$BTW These numbers don't look right. I stared at the chart for ten minutes: 0.91 to 0.56, with the upper and lower wicks stretching like an ECG, a 24-hour range of 63%, yet trading volume was only 68.6M. That volume can't support this kind of volatility, which suggests it wasn't big players pushing the price up—someone was getting out.
Yesterday I entered around 0.58. The logic was simple: it had fallen near the 24-hour low without trading volume increasing, so it felt like a panic-selling trap. After I entered, it rose to 0.72, giving me a 24% unrealized profit, but I didn't exit. Why didn't
BTW+27.14%
Market update
live-cover
LIVE1,062
Layout for Bitcoin, Ethereum, and Dogecoin
live-cover
LIVE1,519
🔥 Gate Futures Martingale Bot
✅ Smart scaling in, continuously optimizing position costs
✅ Automatically take profit when the market rebounds, never miss an opportunity
✅ Supports up to 200x leverage for more efficient capital utilization
✅ Designed specifically for swing and rebound markets, capturing every opportunity
🔥 Trade $OPENAI with the Gate Futures Bot and capitalize on volatility in popular assets
👉Direct access: https://www.gate.com/crypto-trading-bots
#GateSquareMidAutumnReunion
post-image
OPENAI+2.36%
JUST IN: Fed’s Kashkari says inflation remains too high and not just driven by oil, reaffirming the Fed’s 2% path. This keeps pressure on rate expectations and macro risk sentiment for crypto markets. $BTC $ETH
post-image
BTC-1.05%
ETH-1.60%
Load More

Join 40 M users in our growing community

⚡️ Join 40 M users in the crypto craze discussion

💬 Engage with your favorite top creators

👍 See what interests you

Trending Topics

MSTRTopsNasdaq100

74.08k Views2.98k Discussing

Strategy (MSTR) has gained about 48% over the past month, making it the best-performing stock in the Nasdaq 100, while Bitcoin rose roughly 12% over the same period. The company holds 845,050 BTC with a cumulative cost basis of about $63.73B. MSTR is not a pure Bitcoin proxy — its price swings can be more extreme. Can this rally last?

Gate Tops 24H Net Inflows Among Exchanges

26.43k Views3.69k Discussing

BTCRetakes80K

57.12k Views60.56k Discussing

View More