Share your thoughts
placeholder
Article
XAUT/USDT is about to expose a quiet flaw—here’s the part most traders miss.

$XAUT /USDT - SHORT

Trade Plan:
Entry: 4425.9 – 4430.7
SL: 4451.6
TP1: 4410.9
TP2: 4399.2
TP3: 4381.8

Why this setup?
- 4h bias is SHORT with 55% confidence—not a screaming signal, but enough to lean.
- RSI 15m at 49.25 = zero momentum edge; price is coiling inside a tight 4425.9–4430.7 entry box.
- ATR 1h at 9.69 means the next move could be swift—but range-bound 1D trend says don’t chase.
- Why now? Entry ref 4428.3 sits just below invalidation 4460.2. A break below 4410.9 (TP1) opens the slide to 4399.2
XAUT-0.94%
Dollar Weakness Supports Risk Assets! Can BTC & ETH Follow Stocks Higher?
live-cover
LIVE977
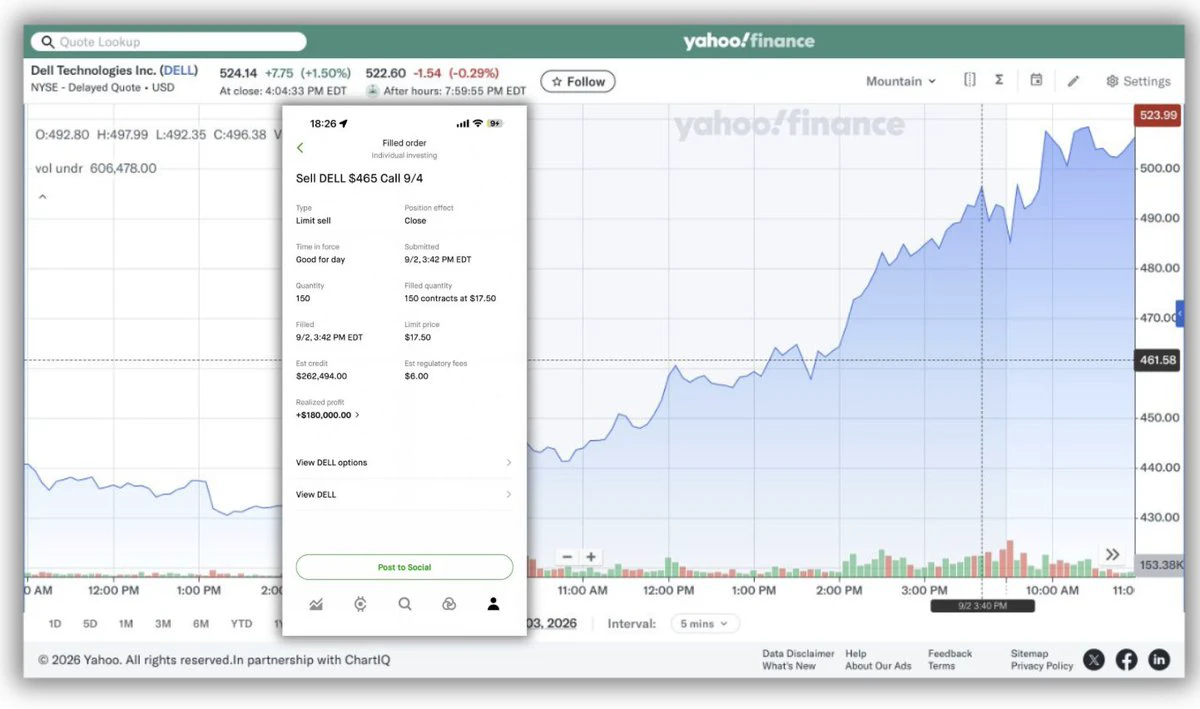
Made $180,000 in a few hours just by always using a Dell computer🤣
A trader in the U.S. Eastern Time Zone put up about $82,500 on the morning of September 2, buying 150 DELL call options with a strike price of $465, expiring on September 4.
He said the reason for taking such a large position was simple: he had always used a Dell computer and felt it was pretty decent.
Moreover, just one day before he bought the options, Dell reported earnings that beat market expectations, with strong AI server demand, and raised its full-year revenue and profit outlook. The next day, DELL gapped higher, risi
post-image
DELL+0.80%
It is better to spend time improving your imperfect self than to waste time expecting perfection from others.
$BTC Today's News | Nonfarm payrolls far exceed expectations, September rate hike expectations heat up again
U.S. nonfarm payrolls increased by 162k in August, significantly above market expectations, while the unemployment rate remained at 4.1%. Employment data for the previous two months was also revised upward, demonstrating strong resilience in the labor market. After the data was released, the market raised the probability of a September Federal Reserve rate hike to nearly 60%. Short-term U.S. Treasury yields surged, the dollar index strengthened, and global risk assets experienced a rap
post-image
BTC-1.75%
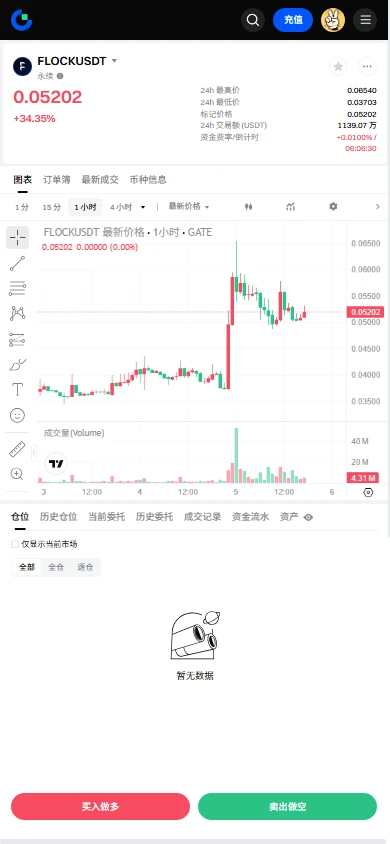
$FLOCK Signal】At the end of 1H triangle convergence, the bullish defense remains intact
$FLOCK RSI(1H) has fallen from above 70 to 52.66, while the MACD(1H) death cross is expanding, but 4H volume has shrunk to 23.33 million. After a 30.60% gain, volatility has narrowed, with the price moving just below the 1H Bollinger middle band. Buyers hold a depth advantage: Bid/Ask=1.34. The short-term consolidation is building momentum around 0.0505, with bulls and bears temporarily balanced; the 1.5 risk-reward ratio still offers trading value.
🎯Direction: long
⚡Entry/limit order: 0.0505080 - 0.05066
post-image
FLOCK+36.11%
BTC-1.75%
ETH-2.68%
SOL-1.32%
#Gate用户突破6000万,来
Looking back at my crypto journey, one moment still stands out clearly — the day I made my first trade on Gate.
I wasn’t some experienced trader. I was just curious. I wanted to understand the charts, feel the market move, and experience what it was actually like to be in a position. I still remember that rush when the price started moving after I entered.
But let’s be honest… my early trades were a mess.
Sometimes I entered too early.
Sometimes I chased after the move had already happened.
And sometimes I was so confident that the market immediately humbled me. 😂
Those
post-image
BTC-1.75%
  • 5
#GateEventContractTradeSharingChallenge #HYPE
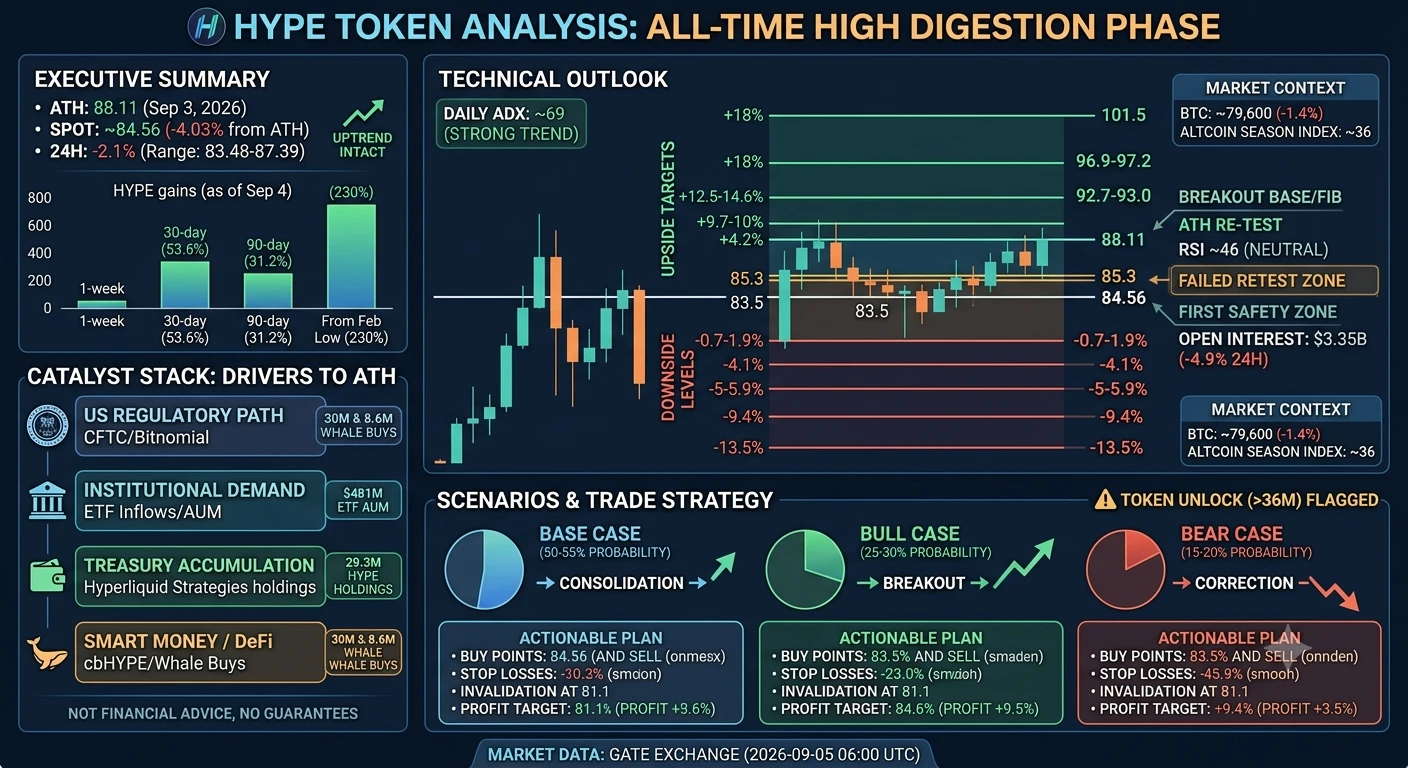
HYPE MARKET ANALYSIS — CURRENT PRICE $84.73 🚀
HYPE is once again standing at a critical point of its bullish journey. At $84.73, Hyperliquid remains very close to its recent all-time-high region around $88, meaning the market is currently testing a major breakout area rather than sitting in an ordinary trading range. The bigger picture remains bullish, but after such a strong rally, traders should prepare for two possibilities: a clean ATH breakout or a short-term cooling phase before the next leg higher.
The immediate battle is between $87.00 an
post-image
HYPE-2.55%
  • 1
  • 1
Everyone’s staring at the 1D chart, but the 4h just whispered a secret about HYPE that most will ignore.

$HYPE /USDT - LONG

Trade Plan:
Entry: 84.597 – 84.945
SL: 83.100
TP1: 86.024
TP2: 86.860
TP3: 88.113

Why this setup?


Debate:
If the 4h breaks 84.945, do you trust the 95% confidence to TP3 (88.113), or is the 15m RSI already too hot to chase?

⚠️ Personal market analysis only. NFA — manage risk and DYOR.
Educational content, not investment advice or a recommendation to buy, sell, deposit, or withdraw any asset. No paid promotion or referral/affiliate links.
HYPE-2.56%
At the end of the day, it all comes down to mindset...
post-image
Everyone's staring at BNB at 750—but the 15m RSI just screamed 84.58. That's not a breakout; that's a trap door.

$BNB /USDT - SHORT

Trade Plan:
Entry: 748.8 – 751.6
SL: 767.5
TP1: 737.2
TP2: 728.5
TP3: 715.5

Why this setup?
Why now? The 4h signal says SHORT with 77% confidence. Price is hugging 750.2, but the fuel is gone.
- RSI 15m at 84.58 = overbought blow-off, not accumulation.
- 1D trend is "range"—so this isn't a new leg up; it's a mean reversion setup.
- ATR 1h at 5.56 means volatility is tight—perfect for a fast 2% drop to TP1 at 737.2.
We're waiting for the entry to fill
BNB+3.85%
#WTI原油 Could Oil Prices Face a “Major Collapse”? Bessent: Crude Could Fall to $40-$50 After Iran Conflict Ends
U.S. Treasury Secretary Bessent said that once the Iran conflict ends, international oil prices could plunge sharply, potentially falling to $40-$50 per barrel. As energy prices retreat, global bond yields, which have recently been driven higher by rising oil prices and inflation concerns, may also decline.
He said in an interview Friday that once the current Iran conflict ends, the global oil market could shift back to a situation of clear oversupply. Bessent said: “We will ultimatel
XBRUSD+0.01%
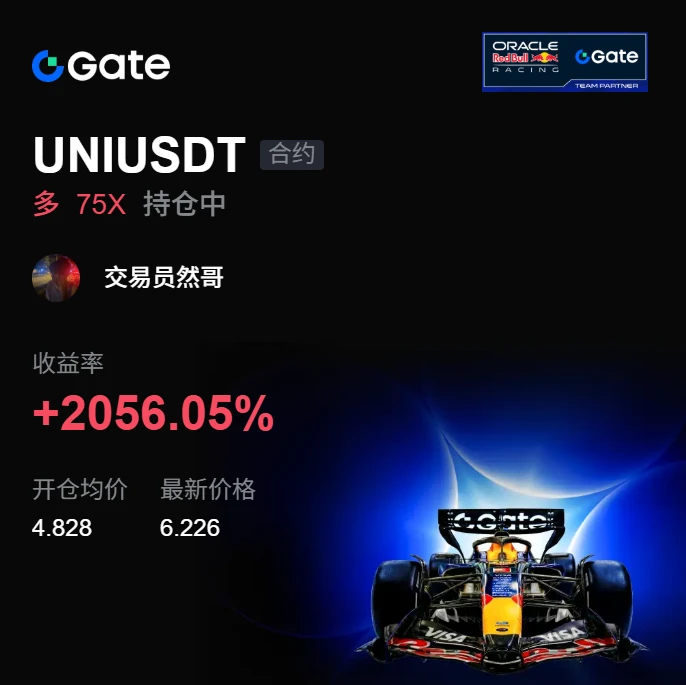
This move was purely a case of the market being in a good mood and casually tossing out some gold coins—one just happened to land on my head. With the screen glowing green, I watched $UNI ’s order book and noticed that it had stopped falling. Trading volume was also shrinking, while the funds buying at the bottom were unusually determined. I was thinking at the time: isn’t this a sign that the bottoming process is over?

After entering at 4.828, the market surged straight to 6.225, throwing a +2054.58% return right in my face. I timed the rhythm so well that I wanted to applaud myself. Many p
post-image
UNI-0.41%
SOL-1.32%
XRP-2.81%
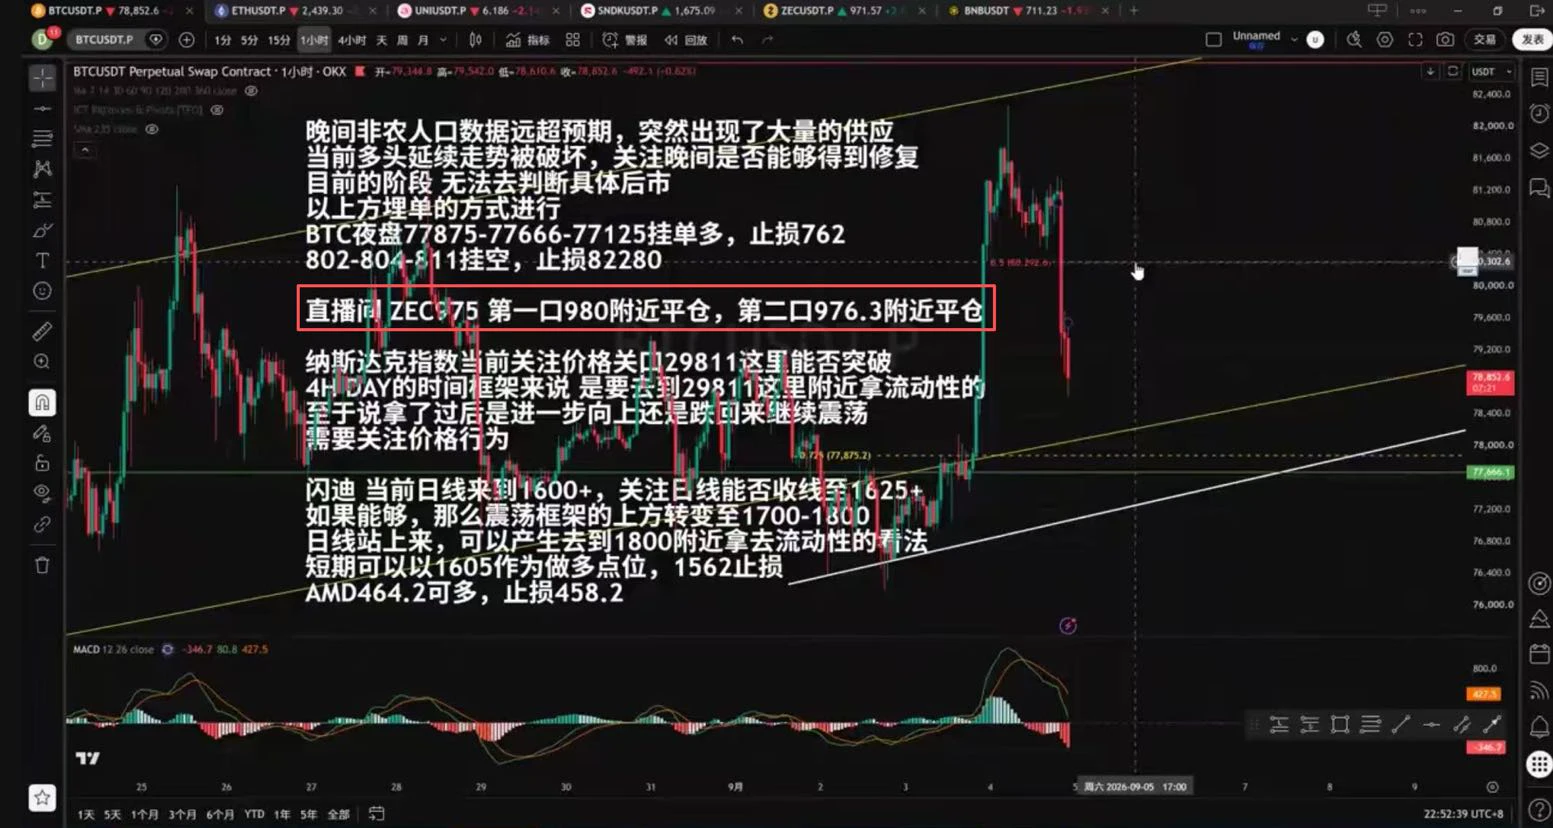
$BTC was provided in last night's livestream
Entered a long position near ZEC 975 and took profit and closed near 980
Entered a long position near ZEC 975 and took profit and closed near 976.3
Both trades were short-term long positions
post-image
BTC-1.75%
$BTC is pretty tricky to read right now.
We’re inside a bullish imbalance, but the correction also created a bearish one.
So my weekend plan is simple:
If the imbalance breaks → I’ll look for longs.
If it holds → I’ll look for a short toward $77K.
$BTC
BTC-1.77%
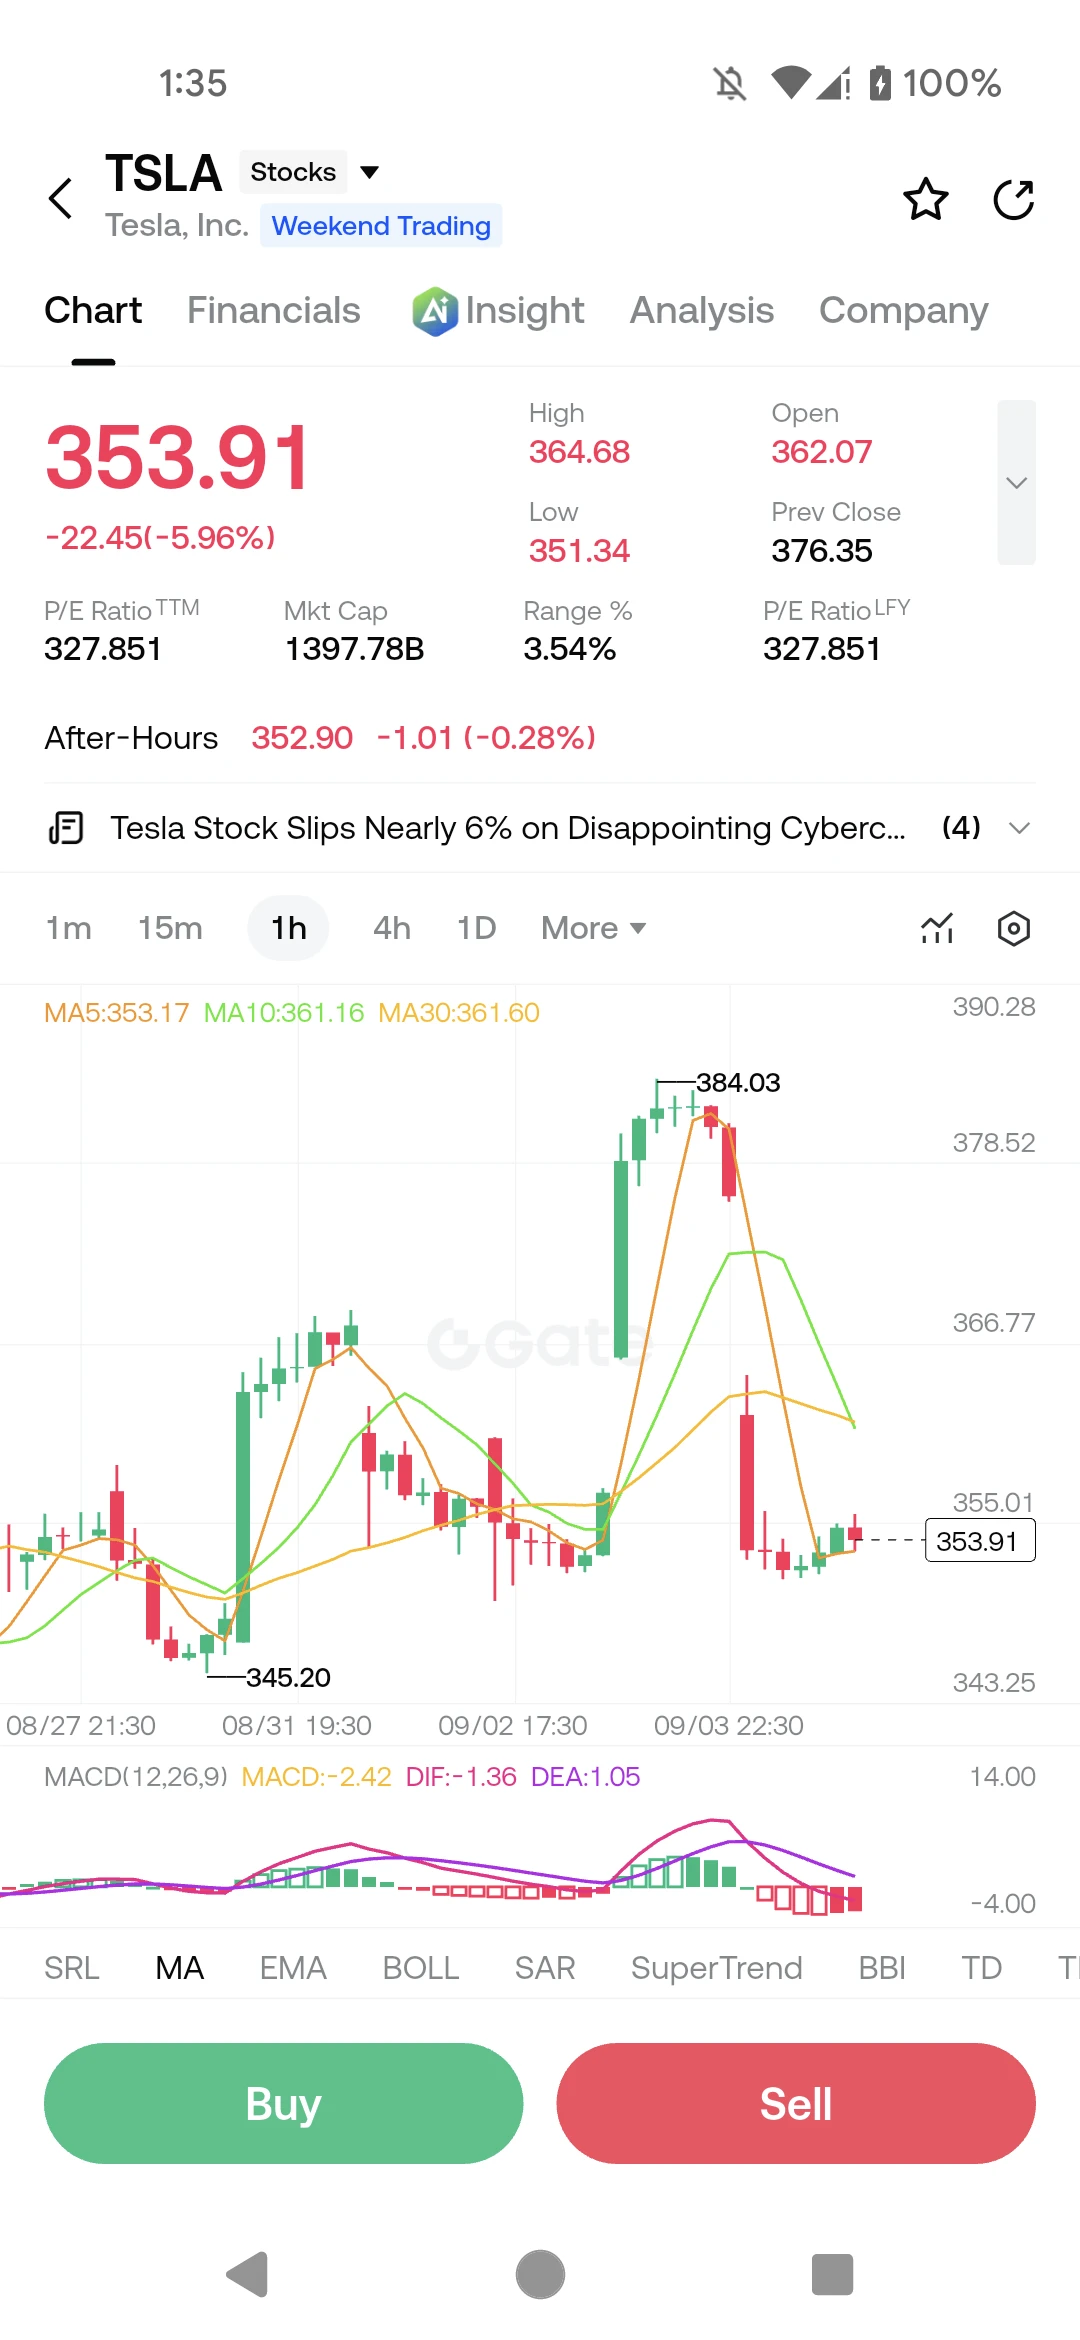
in on $TSLA ‌– it's getting hammered today!"
Tesla is down nearly 6% at $353.91, dropping -22.45 points. The 24h high is $364.68 and the low is $351.34 – that's a wide range. EMA5 is at $353.17, while EMA10 ($361.16) and EMA30 ($361.60) are well above – price is trading below both, a clear bearish signal. MACD is negative at -2.42, with DIF (-1.36) below DEA (1.05) – momentum is firmly to the downside. The after-hours price is $352.90, down another -0.28%, suggesting more weakness ahead. The P/E ratio is extremely high at 327.85, and the market cap is $1.397T. The news about disappointing Cyb
post-image
TSLA-3.59%
  • 2
  • 1
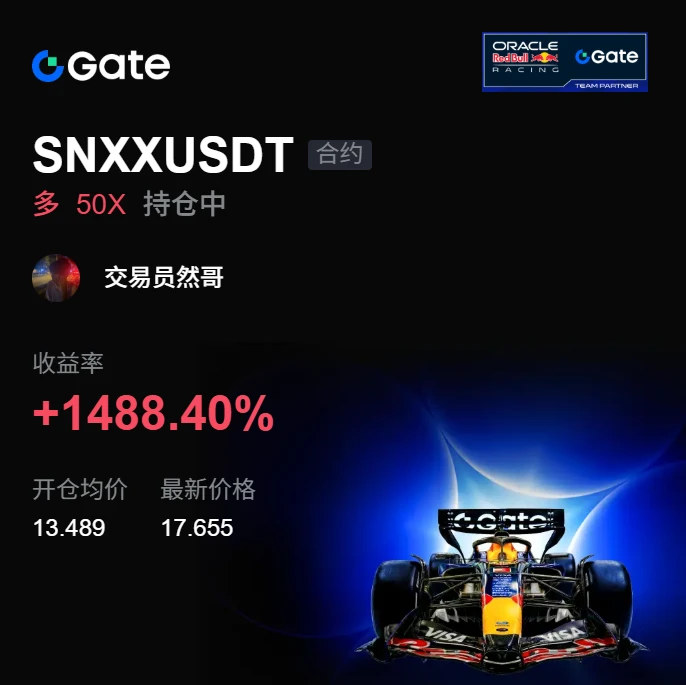
A few days ago, my hand trembled slightly as I set a stop-loss before bed. Looking at it this morning, I was simply scaring myself. When $SNXX plunged intraday, I saw that the pullback held without breaking support, so I knew someone was catching it below.

The pullback stabilized and buying pressure gradually strengthened—there was no excuse not to participate in this setup. I went long at 13.489, set my stop-loss, and stopped watching the chart.

Now the market has provided the answer: 17.655 came straight up, with +1488.4% unrealized profit sitting there. Feels great, brothers. This was
post-image
SNXX+19.39%
ADA-3.36%
ZEC+1.05%
Everyone’s chasing HOME’s bounce—but the 1D trend says you’re already late to the trap.

$HOME /USDT - SHORT

Trade Plan:
Entry: 0.00612 – 0.00614
SL: 0.00626
TP1: 0.00603
TP2: 0.00597
TP3: 0.00587

Why this setup?
- 95% confidence SHORT on the 4h, while the daily prints pure bearish structure.
- RSI 15m is overheated at 70.6—buyers are exhausted right at our 0.00613 entry zone.
- Why now? Price is stalling under a falling trendline, and the first target sits 1.6% lower at 0.00603.

Debate:
Are you fading this 15m strength into the daily downtrend, or do you think 0.00617 invalidation
HOME+2.50%
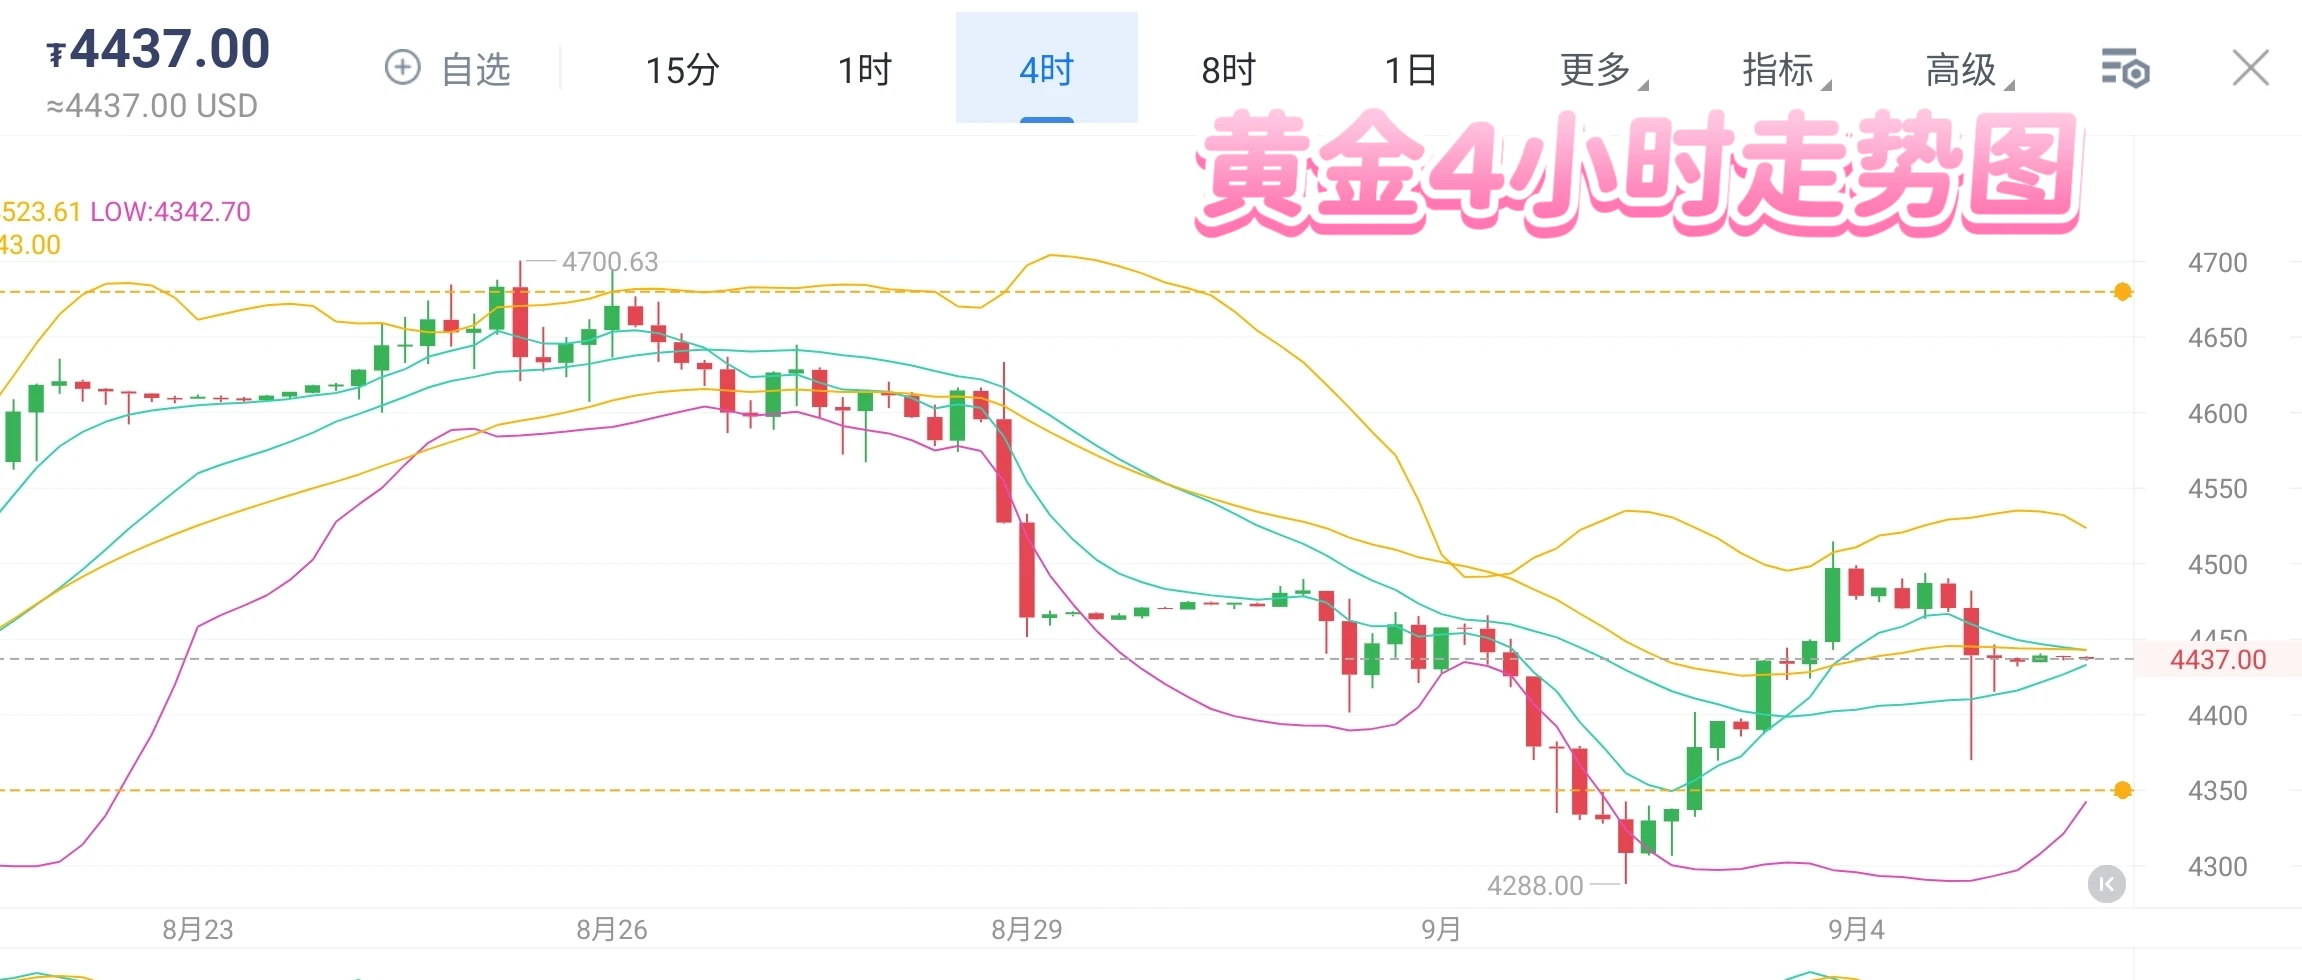
Friday’s nonfarm payrolls ended perfectly overall, so what should we expect next week?
Before Friday’s nonfarm payrolls, we went long around 4463 as planned and took profit before the release. However, the US-session nonfarm payrolls data was strongly bearish for gold, sending it sharply lower. After a short-term rebound to 4443, we followed the move lower and took profit as expected. I had also noted earlier that the nonfarm payrolls report was crucial: if bearish, gold would most likely test support around 4380. Gold rebounded by $30 after its first dip to around 4380, then fell again to tes
post-image
XAU-0.99%
Load More

Join 40 M users in our growing community

⚡️ Join 40 M users in the crypto craze discussion

💬 Engage with your favorite top creators

👍 See what interests you

View More