



Square
Following
Hot
News
Profile
Share your thoughts
placeholder
Article
What is your top #Altcoin pick right now ⁉️
And which #Memecoin are you betting on next 🚀
👇👇👇
post-image
MEME+0.83%
When Volcker took over the Federal Reserve in 1979, the year-over-year U.S. CPI surged to 14.8% in March 1980. He did not choose to “wait and see.” Instead, he pushed the federal funds rate to around 20% and used money-supply targets to force inflation down. Three years later, CPI had fallen to around 3%, but the cost was two recessions, in 1980 and 1981–1982. The unemployment rate exceeded 10.8% by the end of 1982. Midwestern farmers, squeezed by high interest rates and collapsing land prices, drove their tractors to Washington and blocked the entrance to the Federal Reserve. That was not pol
post-image
Market update
live-cover
LIVE29
The sun rises every day, but there is always one worth waiting for.
post-image
#布局本周交易 #每周来晒 The weekend market is usually in a consolidation phase with relatively weak liquidity, making it suitable to focus on “defense + testing the market with light positions” to prepare for next week’s potential trend shift. Combining the current market conditions, fund flows, and macro expectations, the following are the weekend positioning ideas and next week’s market forecast:
I. Weekend Positioning Ideas (Defense-Oriented, Testing the Market with Light Positions)
1. Bitcoin (BTC): Range trading, combining defense with testing long positions
Testing longs at support: BTC has recent
post-image
ThisIsTranslateContent:
#布局本周交易 #每周来晒 The weekend market is usually in a consolidation phase with relatively weak liquidity, making it suitable to focus on “defense + light-position probing” to prepare for a potential market shift next week. Based on current market conditions, capital flows, and macro expectations, the following are weekend positioning ideas and next week’s market forecast:
I. Weekend Positioning Ideas (Defense First, Light-Position Probing)
1. Bitcoin (BTC): Range trading, combining defense with cautious long positions
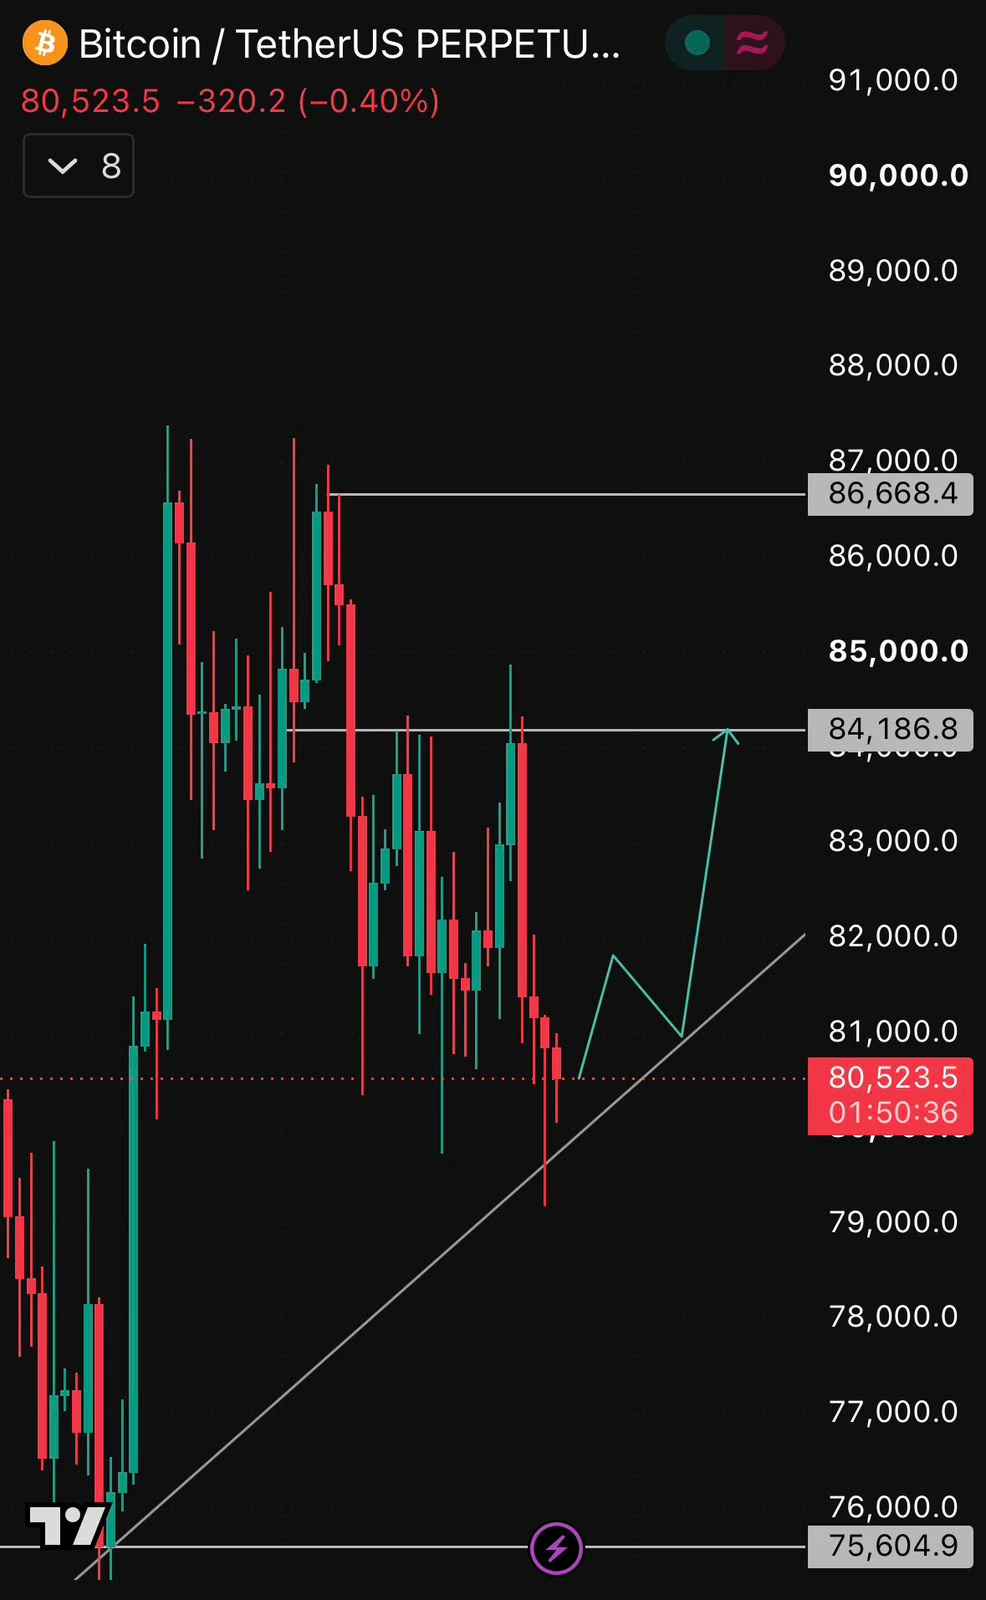
Long entry at support: BTC has recently been fluctuating narrowly in the $82,000-$83,000 range, while the 50-day moving average (approximately $80,400-$81,000) is an important medium-term support level. If BTC stabilizes after pulling back to $82,300-$82,500, consider cautiously opening a light long position, targeting $83,500, with a strict stop-loss set (such as below $82,000).
Sell into resistance: If BTC rebounds to the $83,000-$83,500 range and encounters resistance, consider partially reducing positions or selling into strength; do not chase the rally.
2. Ethereum (ETH): Weak in the short term; primarily stay on the sidelines
Cautious long entry: ETH has recently underperformed BTC (the ETH/BTC exchange rate hit a new low, while ETF outflows continue), so blindly increasing ETH positions is not recommended in the short term. If ETH stabilizes after pulling back to $2,470-$2,480, consider cautiously opening a light long position, targeting $2,530, with a stop-loss at $2,450.
Stay on the sidelines: If ETH encounters resistance after rebounding above $2,530, wait for a clearer stabilization signal.
3. Altcoins: Trade with light positions and exit quickly, whether for profit or loss. II. Next Week’s Market Forecast (Watch the Macro Market-Shift Window)
1. Market-shift window: Macro data and capital flows
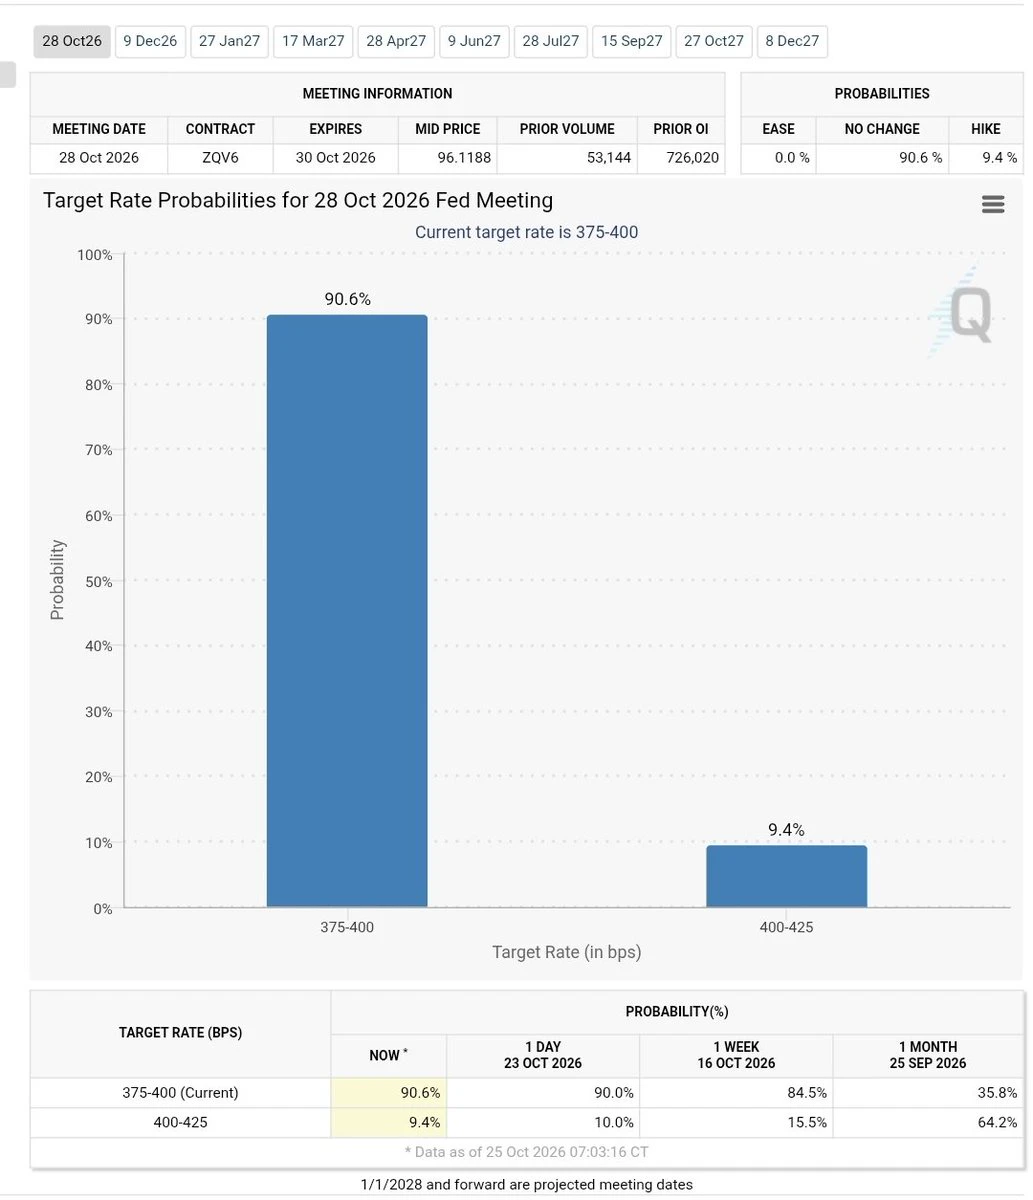
Macro data (key): The US September PPI data will be released next Tuesday (October 14), and the Federal Reserve FOMC meeting minutes will be released next Wednesday (October 15). These two data releases will directly affect market expectations for the Federal Reserve’s rate-hike path and are important windows for a market shift next week.
Capital flows: Continue monitoring the US government’s BTC transfers (if large amounts continue to flow into exchanges, short-term selling pressure may persist) and outflows from ETH ETFs.
2. Market Direction Forecast
Bullish scenario: If macro data (PPI) shows that inflation continues to cool and the FOMC minutes send a dovish signal, short-term market pressure will ease. BTC may hold the $80,400 support level and move upward to test $83,500 or even higher.
Bearish scenario: If macro data rebounds above expectations or government selling pressure continues to intensify, BTC may retest the $80,400 support level. If it breaks below that level decisively, the medium-term trend will need to be reassessed.
Over the weekend, focus on controlling position sizes, maintaining a defensive stance, and probing with light positions. Wait for next week’s macro data to be released before making directional decisions on adding positions.
repost-content-media
BTC+0.77%
ETH+1.18%
market updates on today $BTC & $XAU
live-cover
LIVE58
CRCL at $84.51 tells us: stablecoins are more than the crypto world's “change wallet”
In the past, when people talked about stablecoins, many first thought of digital dollars used to hedge risk during trading and settle transfers. But as use cases continue to expand, stablecoins are becoming an important link between traditional finance and blockchain. CRCL closed at $84.51, up 4.54% on the day, bringing this topic back into focus. One of the key highlights is USDC. Unlike crypto assets whose prices are driven purely by market sentiment, Circle's business value must also be analyzed from the p
NVDA-0.52%
  • 30
Tree-Hole Painting—The Drifting Rabbit🐰A clear stream flows out from the deep mountains,
Flowers bloom on both banks, more beautiful than Peach Blossom Spring.
The little rabbit leisurely frolics in the flowing water,
A paradise exists within this tiny space.
Technical analysis applied properly can change your life. 👀
$STRK PUMPED 456%
THE TEAM WANTS TO MAKE IT A L1 AND THE FIRST QUANTUM PROOF L1.
This is still a proposal under consideration, not a finalized decision or governance-approved plan
Interesting times already. Bears still think we are in a bear market...
post-image
STRK+15.86%
Starlink | ETH Yesterday’s Trade Idea Review
The levels given yesterday have been hit today!
Yesterday’s ETH outlook was very clear:
Go long at 2480–2490
First target: 2510–2530
Second target: 2540–2560
At the time, ETH was still consolidating around 2500, and market sentiment remained weak.
I didn’t ask everyone to chase the rally. Instead, I laid out the entry observation zone and target ranges in advance.
Early today, ETH reached around 2550 at its high. The first target range was fully hit, and the second target has also entered the observation range!
This is the difference between giving
BTC+0.79%
ETH+1.22%
$XAUUSD opened lower in this move
XAUUSD-0.04%
$NEAR ‌NEAR USDT - Technical Outlook | Oct 10
NEAR is trading at $5.014with over 5% gain in the last 24 hours.
Highlights on the Chart (4H):
After a sharp pullback to the $4.30level in recent days, a strong recovery has taken place. The price managed to bounce approximately 16% from the bottom.
We are at a technically important level:
Price has moved above MA5 ($4.852)and MA10 ($4.783).Now the MA30 resistance at $5.024is being tested. 4-hour closes above this level could strengthen the momentum.
Levels to Watch:
Resistance: $5.056(24h high) / $5.34/ $5.60Support: $4.85/ $4.63/ $4.30
The Order
post-image
NEAR+10.55%
10.12 Monday BTC Technical Analysis

BTC is currently priced at 837. On the 4-hour chart:
The Bollinger Bands show an upper band of 839, middle band of 828, and lower band of 817. Price has moved above the Bollinger middle band and is testing the resistance at the upper band, with the short-term consolidation range gradually moving higher.
The three KDJ lines are in the middle zone, with no clear overbought or oversold conditions, indicating a relatively balanced battle between bulls and bears. The MACD value is 199.38; the green bars have disappeared and red bars have appeared, indicating th
BTC+0.79%
Everyone is buying STRK into strength, but this setup begs to differ.

$STRK /USDT - SHORT

Trade Plan:
Entry: 0.11897 – 0.12201
SL: 0.13949
TP1: 0.10624
TP2: 0.09674
TP3: 0.08248

Why this setup?
Why now? The daily trend is bullish, yet the 1h price is stuck at 0.12049, creating a perfect short setup against the momentum. The 15m RSI sits at 59.85, showing just enough weakness to confirm the reversal is starting. The 1h ATR of 0.006091 defines the volatility, making the entry zone between 0.11897 and 0.12201 a precise trap for longs. We target TP1 at 0.10624 and TP2 at 0.09674, with the in
STRK+15.39%
Insiders are fading the bullish trend on $NEAR /USDT right now.

$NEAR /USDT - SHORT

Trade Plan:
Entry: 5.7767 – 5.8363
SL: 6.1785
TP1: 5.5275
TP2: 5.3415
TP3: 5.0625

Why this setup?
Why now? The daily trend remains bullish, yet the 1h price is pinned at 5.8065, creating a contradiction that favors a short. The 15m RSI reading of 64.08 shows the bounce lacks momentum, while the 1h ATR of 0.119238 confirms the move is volatile enough to target 5.5275 and 5.3415. The entry zone between 5.7767 and 5.8363 offers a precise setup, and the invalidation level at 5.1940 is the line in the sand tha
NEAR+10.67%
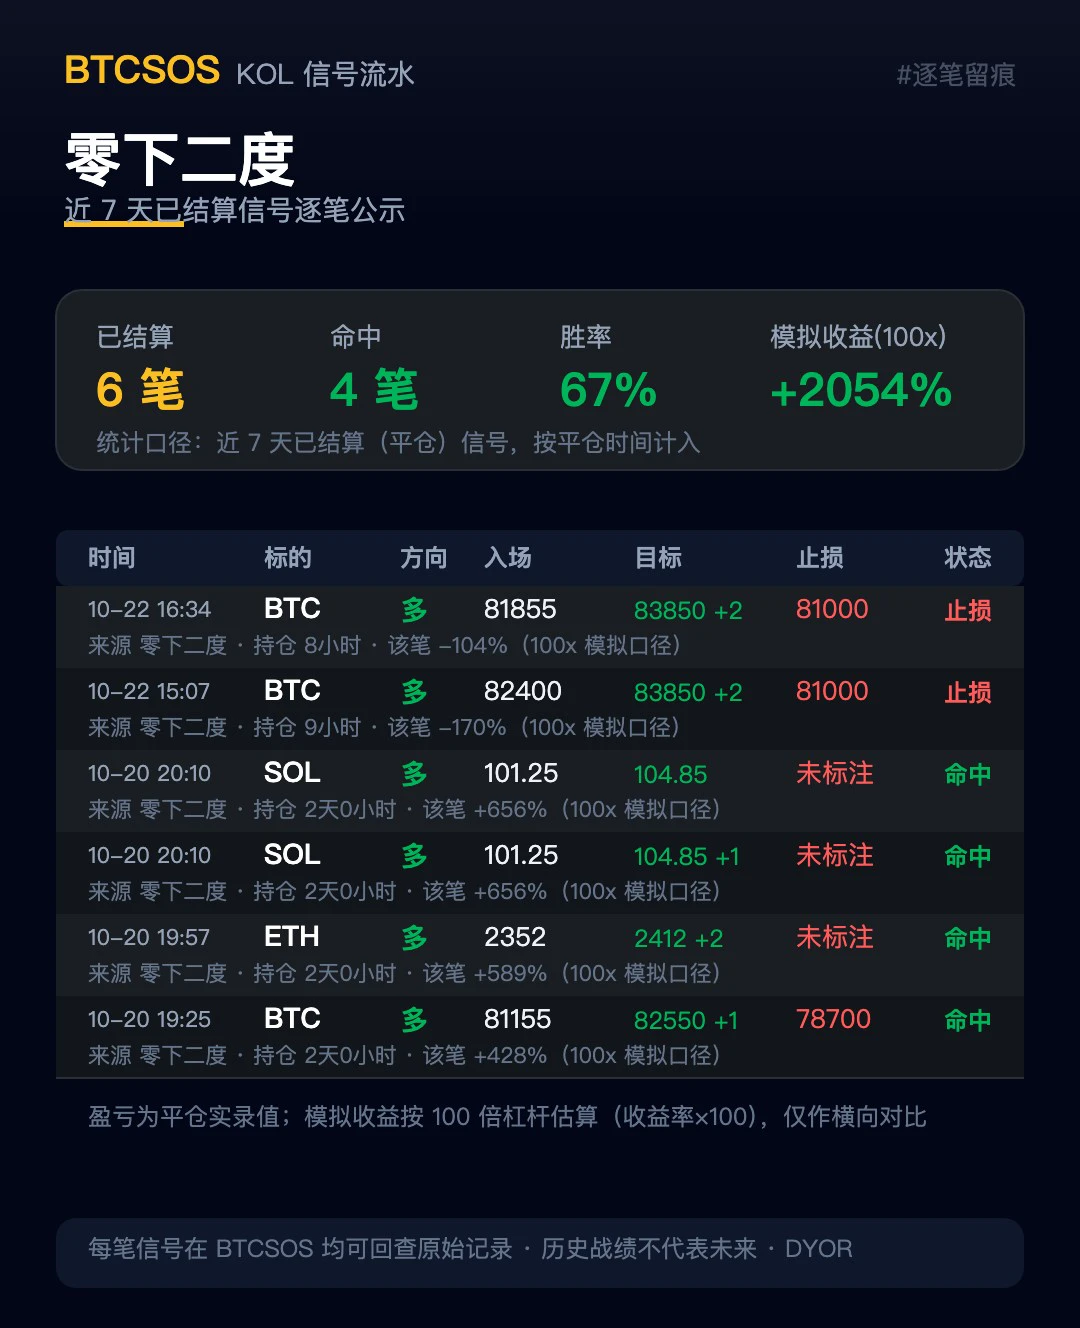
The strategy was given to everyone in advance. Yesterday, those without positions here stayed out, while those with positions added to them. Everyone should have been able to make some gains, big or small, right?#BTC #ETH #BTC走势分析
post-image
BTC+0.77%
ETH+1.18%
The old grain is nearly gone, and the good seedlings have yet to promise a harvest. In my old age I have come to love gruel, yet by year’s end I still lack clothes. Sparrows feed their young beside the mossy well, and roosters crow at the white-plank door. A firewood cart is drawn by a weak horse; in straw sandals I herd great boars. Evening rain splits the red pomegranates, and in early autumn the green taro grows plump. After bringing food to the fields, I rest beneath the mulberry trees, then return through the grass beside the neighboring house. My dwelling is called Fool’s Valley—why both
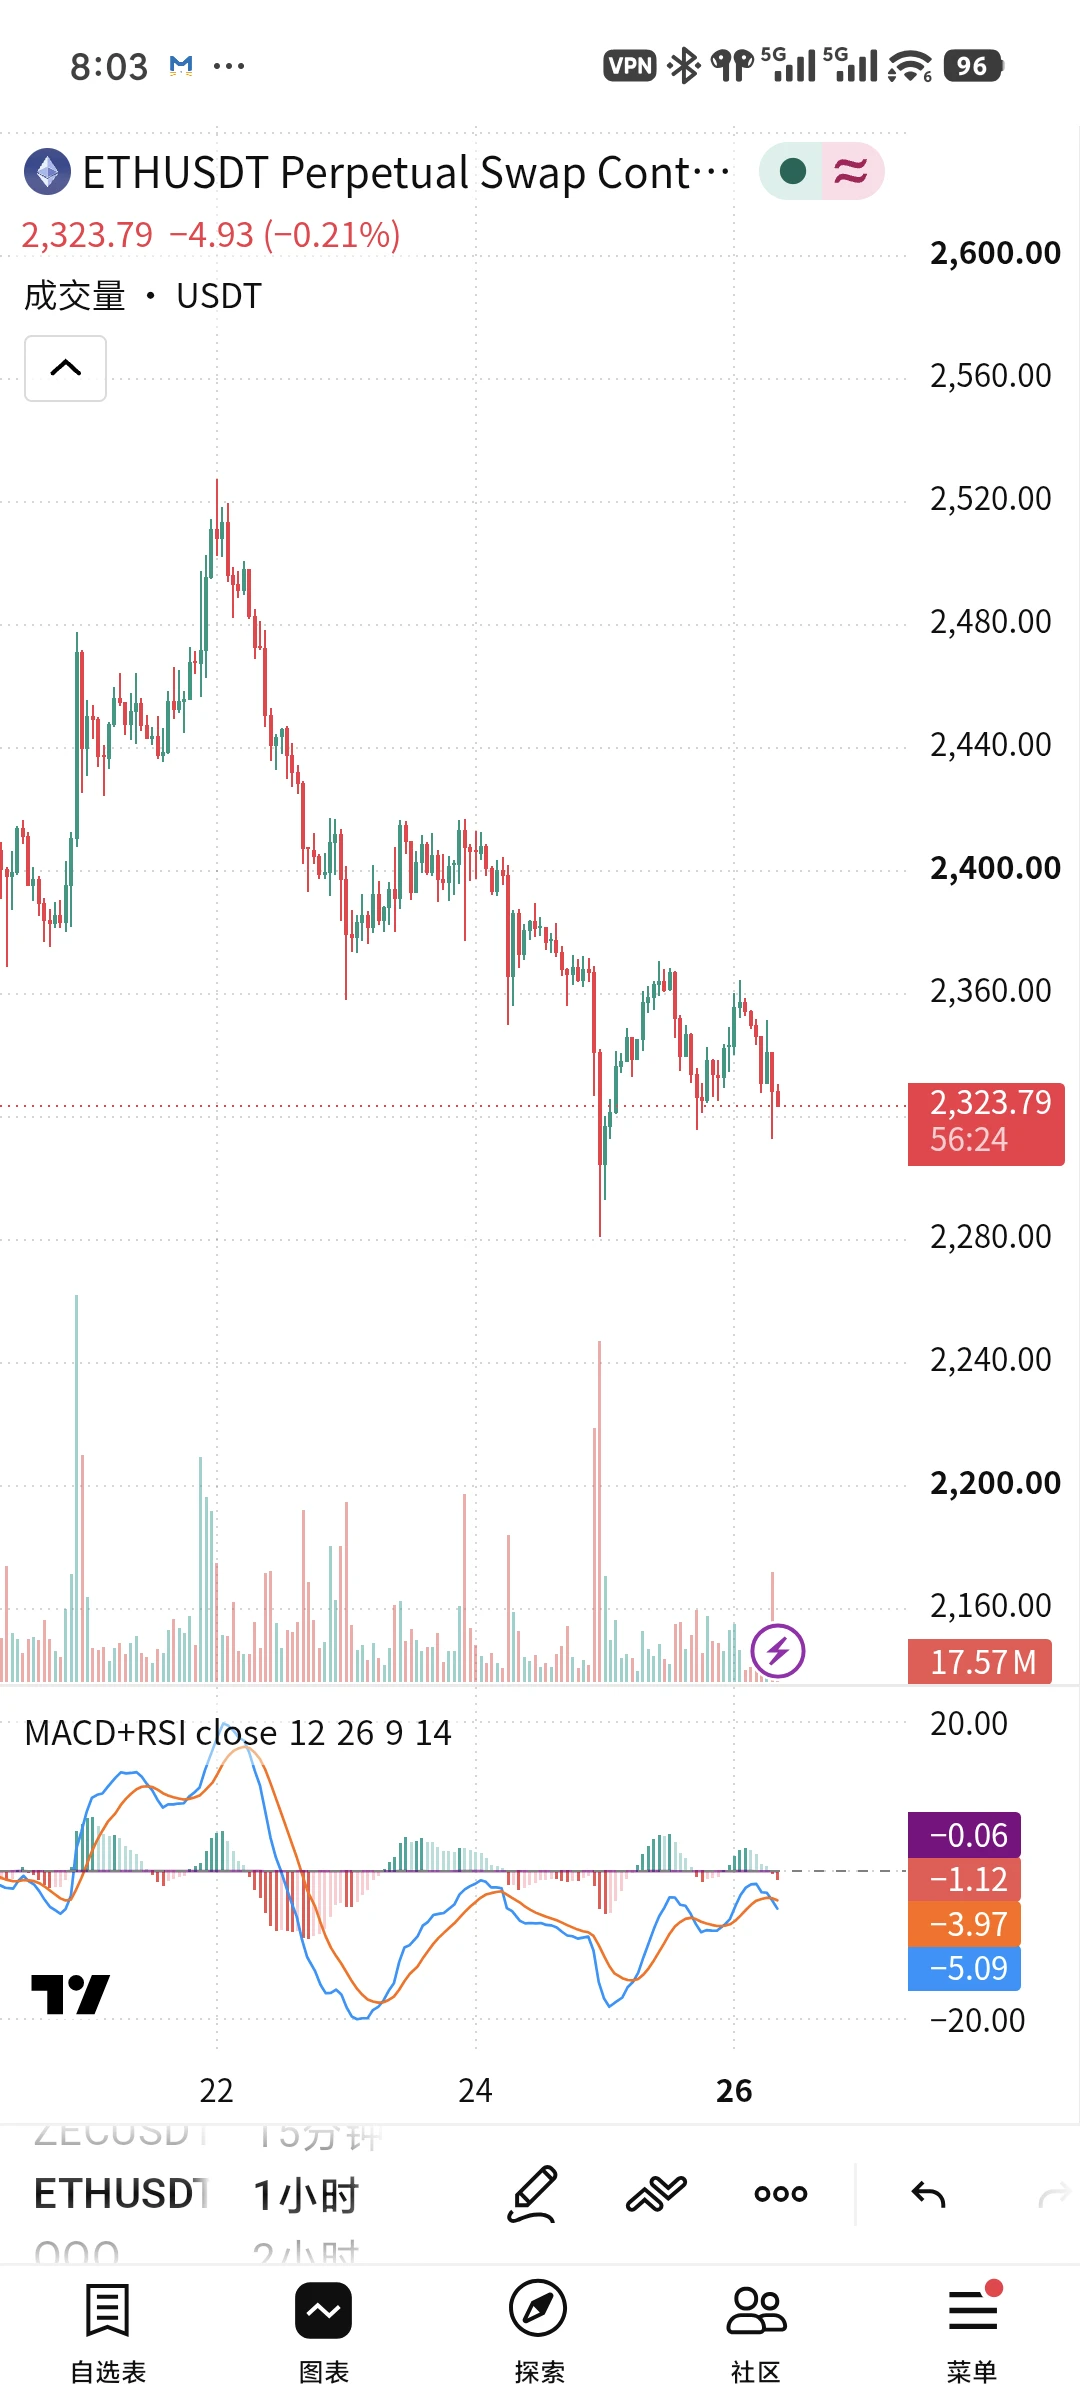
On Ethereum’s one-hour chart, the bullish momentum has clearly weakened after this rally, and the risk of a pullback is gradually accumulating. Technically, the price came under pressure and retreated after surging to touch the upper band, and has now fallen below it. Although the price is temporarily holding above the Bollinger middle band, trading volume during the rise has shrunk significantly compared with the earlier rally, showing insufficient willingness to chase higher. This rally was driven by short-term funds and lacks sustained buying support. The high-level consolidation is a typic
post-image
ETH+1.22%
Consolidation does not alter the upward trend; gold prices still have room to rise
From the four-hour chart, gold prices have staged a rebound and recovery after finding a bottom. Prices have stabilized above the middle Bollinger Band, with clear support at the lows below, while the bottom structure continues to strengthen. The RSI remains in the upper half of the middle range, with bulls still maintaining the initiative. A slight short-term pullback is merely a consolidation phase during the rise, not a trend reversal.
In terms of fundamentals, market expectations for the pace of future rate
post-image
XAU+0.17%
Load More

Join 40 M users in our growing community

⚡️ Join 40 M users in the crypto craze discussion

💬 Engage with your favorite top creators

👍 See what interests you

Trending Topics

GateAtTOKEN2049

41.56k Views21.87k Discussing

Gate brought a series of major events to TOKEN2049 Singapore! From the official launch of Gate Money to the F1 Red Bull driver meet-and-greet and the Gate Gala, we witnessed a new chapter of "One Gate, Borderless Finance." Which moment from TOKEN2049 stood out most to you?

LedgerLossesNear90Million

39.56k Views303 Discussing

GateWCTCS9GlobalTradingCompetition

34.69k Views5.17k Discussing

View More