

Square
Following
Hot
News
Profile
Share your thoughts
placeholder
Article
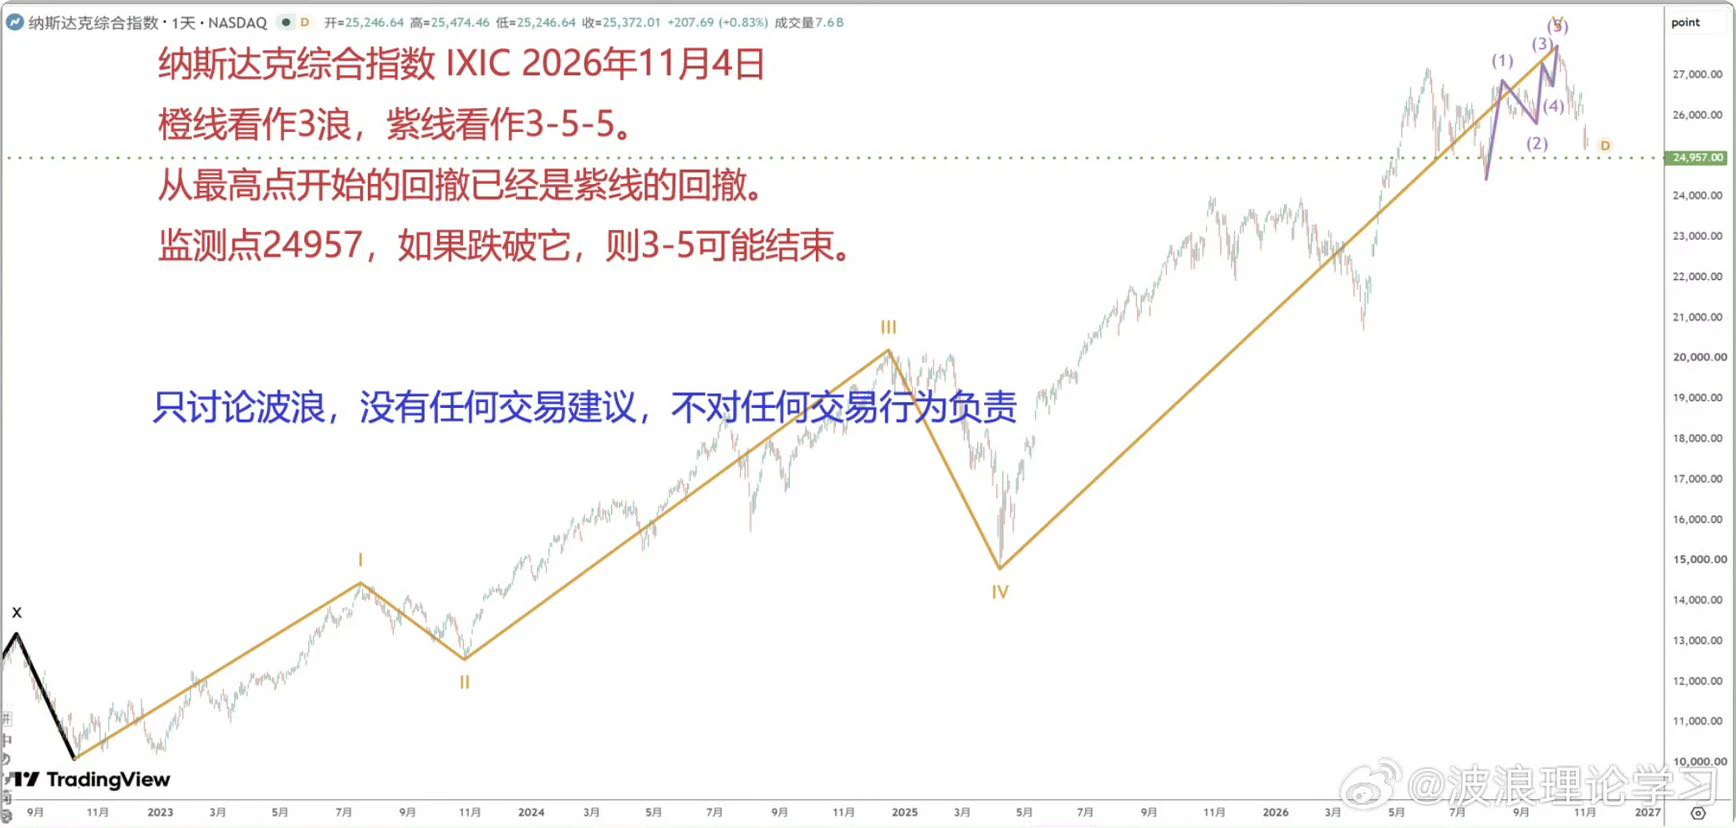
The Nasdaq Composite has confirmed a top on a very small scale; whether it can expand to a larger scale remains to be seen at monitoring point $BTC ‌
post-image
BTC-0.65%
11.4 ETH Silk Road
Market Analysis
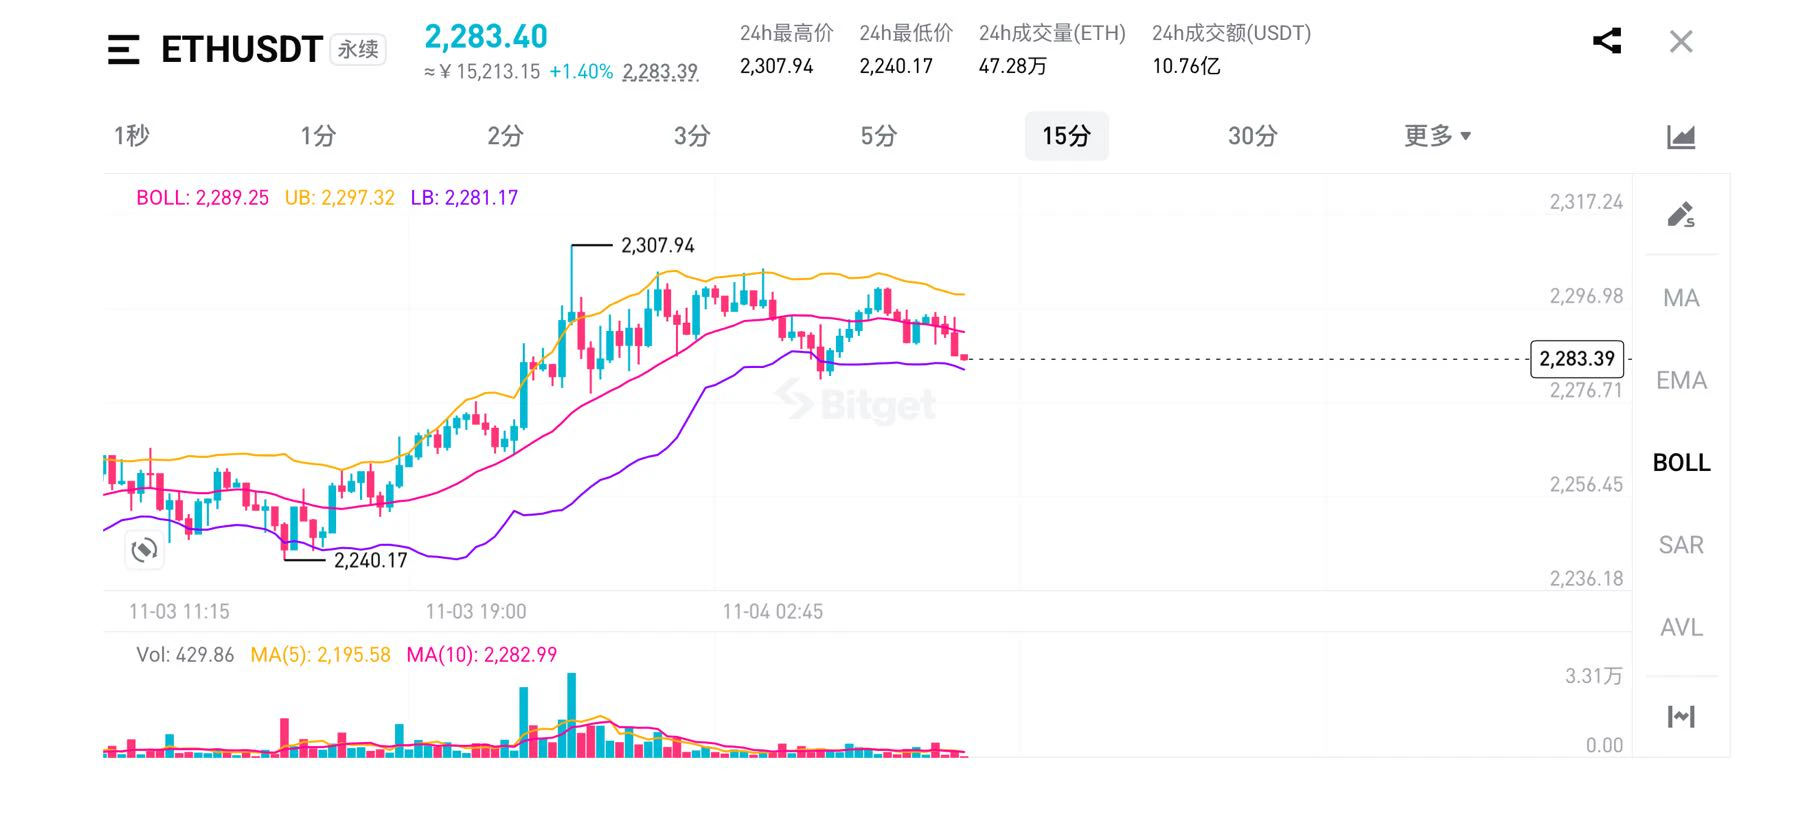
Boosted by expectations for the U.S. election, the market rallied in tandem to 2307.94. Profit-taking at the highs triggered a slight pullback, while continued uncertainty surrounding the election is amplifying market volatility. Beware of sudden wicks.
#美国中期选举今日投票
The 15-minute uptrend structure remains intact. The price found support on a retest of the lower Bollinger Band at 2281.17, and volume contracted during the pullback, indicating a shakeout of positions during the uptrend. The BOLL midline at 2289.25 is the short-term dividing line between strength
post-image
ETH-1.23%
Trenches
ZIG
Z
bade
b
ZIG
0x8c...1145
Market Cap
$.
Change
.
24h Vol
$.
Holders
.
AMD
A
bade
b
AMD
DDmG...pump
Market Cap
$.
Change
.
24h Vol
$.
Holders
.
STONK
S
bade
b
STONK
6GmA...UNgx
Market Cap
$.
Change
.
24h Vol
$.
Holders
.
AGT
A
bade
b
AGT
0x5d...e274
Market Cap
$.
Change
.
24h Vol
$.
Holders
.
CHOO
C
bade
b
CHOO
EJAx...pump
Market Cap
$.
Change
.
24h Vol
$.
Holders
.
btc market veiw
live-cover
LIVE2,062
Long entry level 76400, wick entry 78000 wick entry, bearish early on November 4
post-image
  • 1
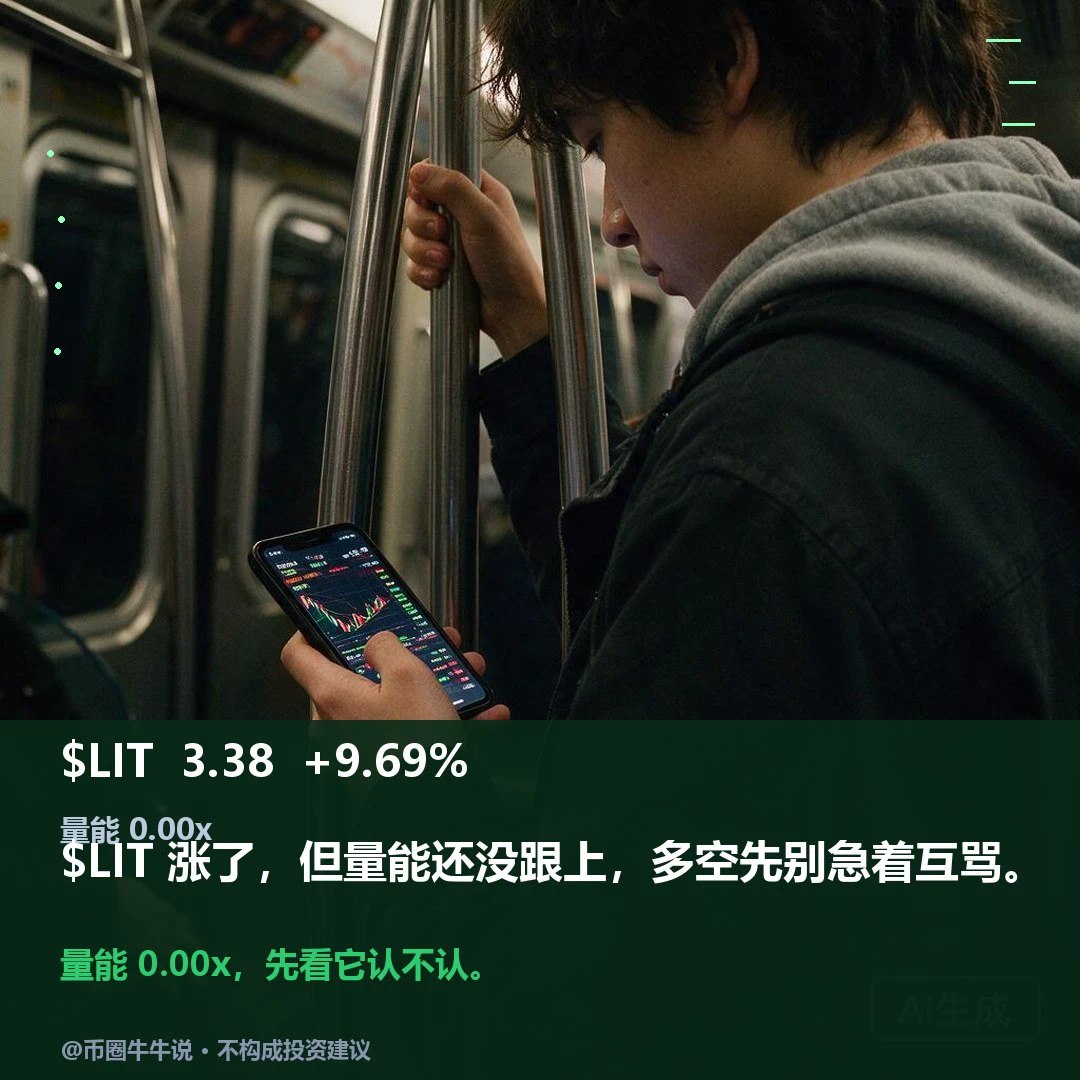
$LIT Currently at 3.3756, 24H +9.69% (3.0354–3.4571). 1H is bullish, RSI 67.33, EMA20 3.2877; 4H is bullish, RSI 58.08, EMA20 3.1591; volume 0.00x. If it holds above the 3.4571 resistance, watch for continuation. If it breaks below the 3.0354 support, it may weaken in the short term. In the follow-up review, check whether it can hold above 3.4571 and whether it can reclaim 3.0354 after losing that level; a lack of volume or failure to reclaim it after a breakdown invalidates the setup. Market volatility is high; for observation only.
post-image
LIT-4.56%
  • 1
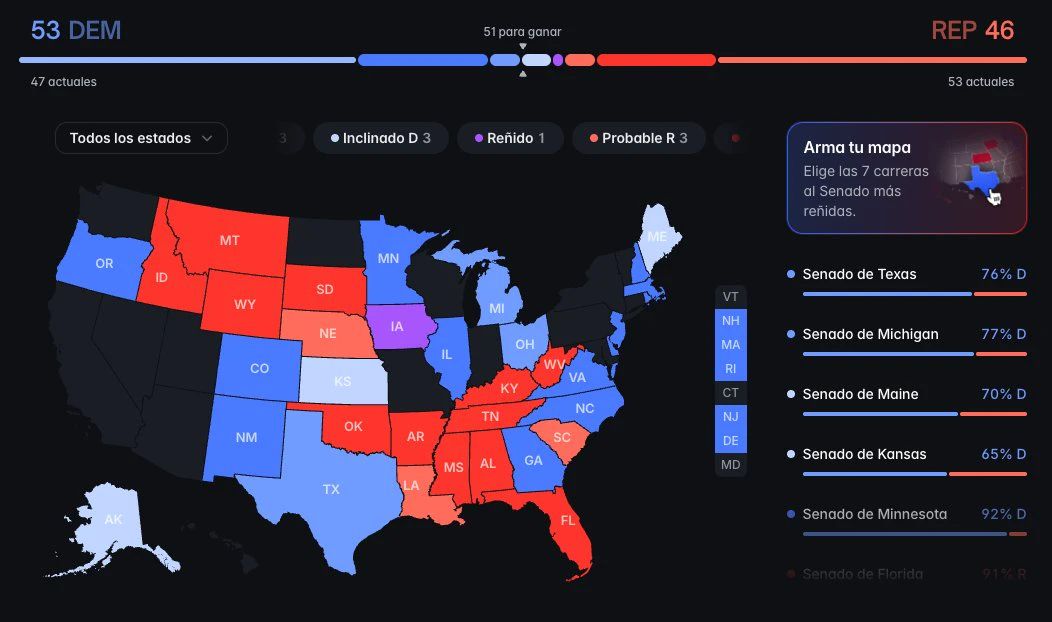
Texas is in trouble!
😅😅😅
post-image
Now that’s a true pro: shorted at 262.8 and still hasn’t taken profit! Held the position for months $SOXL
post-image
SOXL-1.16%
🚀 DROP YOUR TICKERS BELOW! 👇
Who's holding strong, staying bullish, and waiting for the next big move? 🌕
💎 What's the one coin you're refusing to give up on?
Drop your $TICKER, tag your community, and let's hear those conviction plays! 🔥
#Crypto #Memecoins #Altcoins #BullMarket #100xGains #HODL #DYOR
post-image
PIEVERSE | Long 🟢 | Bullish | 15m24h: +9.97% | Volume: 25.9M USDT Long rationale: Price above EMA200; EMA20/50/200 bullish alignment; RSI14 51.1; MACD histogram positive; ADX14 8.4; volume is 0.37x the 20-candle average; trend pullback/continuation. Entry: 1.1639 Stop loss: 1.14599 Take Profit 1: 1.18629 | Take Profit 2: 1.19973 | Take Profit 3: 1.21764 Entry price is for reference only; do not chase the price. This trade setup is invalidated if the stop-loss level is hit. Technical analysis only. Not investment advice. $PIEVERSE
post-image
PIEVERSE+0.58%
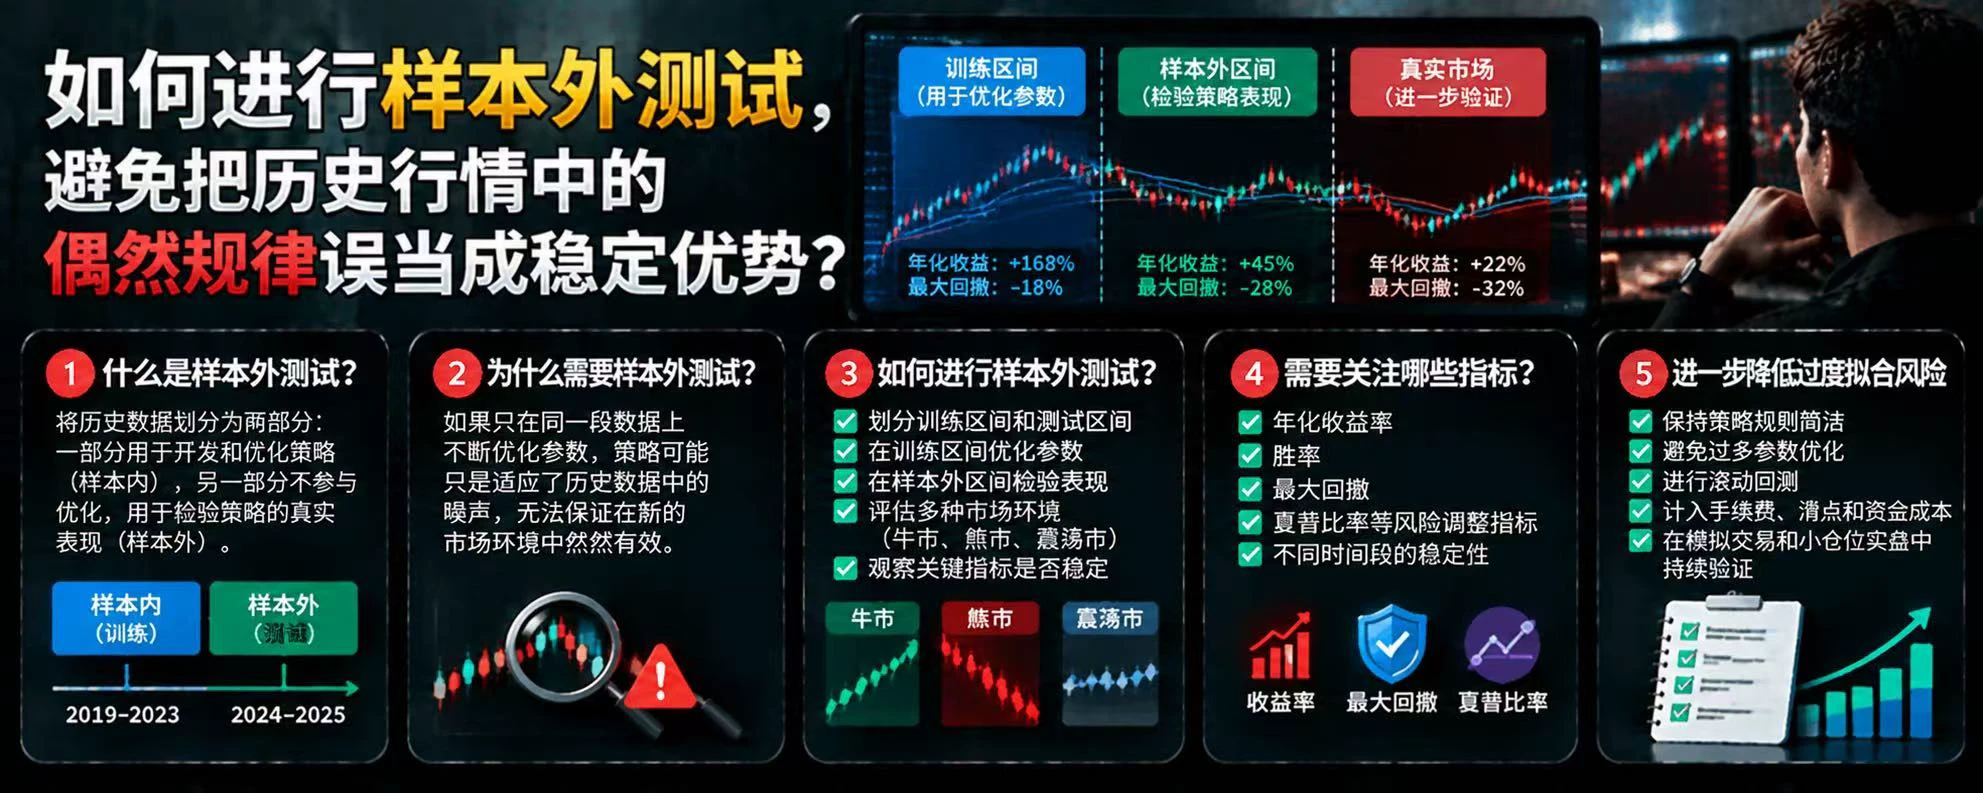
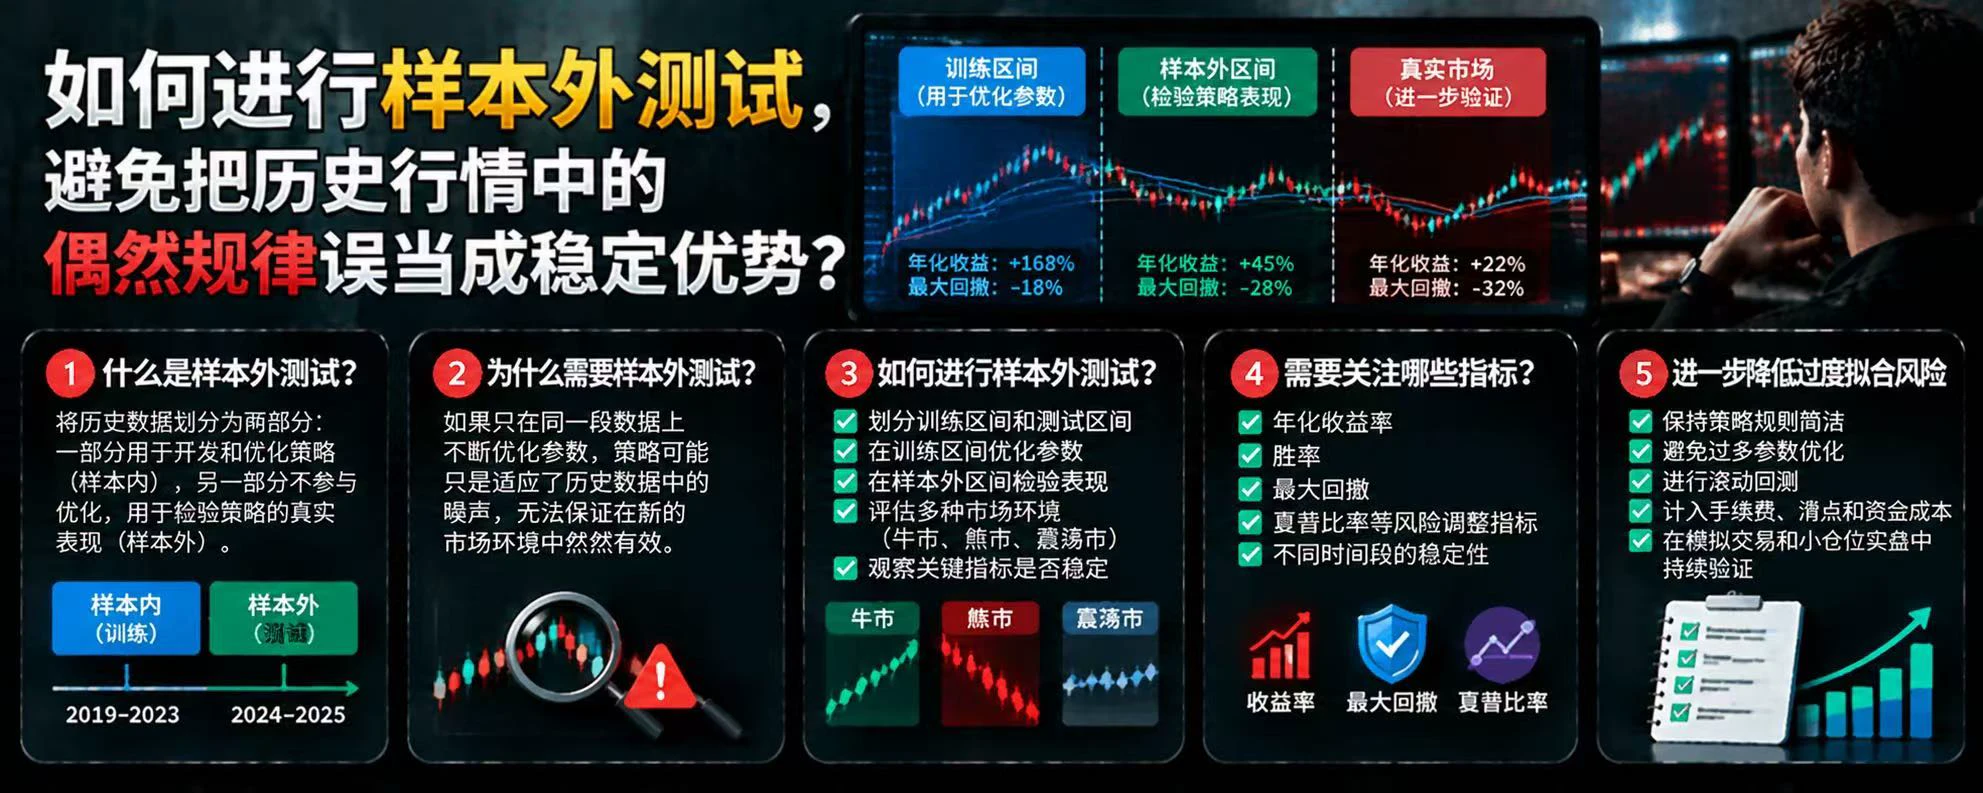
How can out-of-sample testing help prevent mistaking chance patterns in historical market data for a lasting edge?
A trading strategy performing well in historical backtests does not mean it can adapt to future markets. To reduce the risk of overfitting, out-of-sample testing is a crucial step in validating a strategy.
First, what is out-of-sample testing?
Simply put, it means dividing historical data into different periods: one portion is used to develop the strategy and adjust its parameters, while another is kept out of the optimization process and used specifically to test how the strategy
post-image
$BTC Took a quick look at the order book this morning, and Bitcoin and Ethereum are still stuck in the same old, tedious back-and-forth.
Bitcoin is currently around 77788, up slightly by 0.17%.
Although the number is in the green, bulls and bears are both testing the waters at this level. The 77k mark is a short-term psychological line in the sand: there doesn’t seem to be enough force to push lower, but even the slightest move upward gets slapped back by sell orders. We still haven’t seen a high-volume bullish candle, which suggests the big players are still watching from the sidelines and d
post-image
BTC-0.67%
ETH-1.26%
  • 1
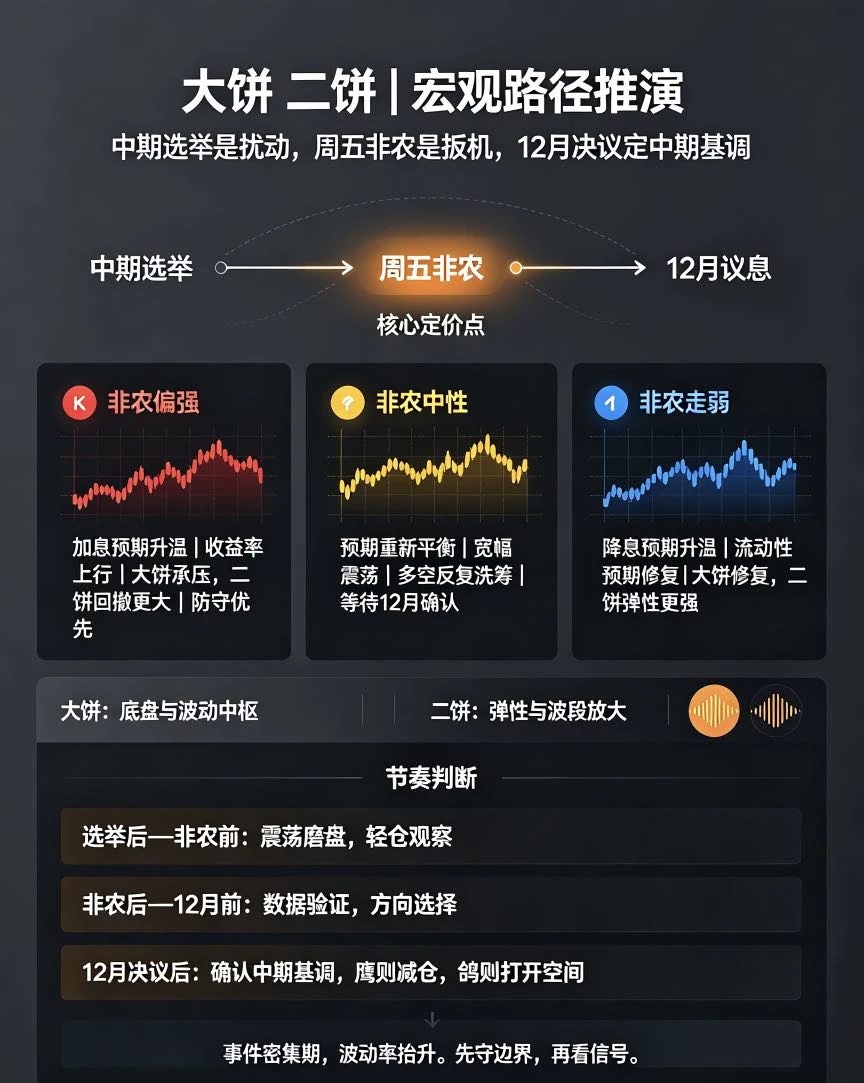
As the midterm elections near their conclusion, uncertainty is gradually being cleared, but this is only a source of volatility. Friday’s nonfarm payrolls report is the real trigger, directly determining expectations for a December rate hike or cut and driving the subsequent moves in BTC and ETH.
$BTC $ETH
👉If nonfarm payrolls come in stronger than expected: Resilient employment will fuel rate-hike expectations and push Treasury yields higher. BTC will come under pressure and pull back, while ETH will be more volatile and face a sharper retracement. Focus on defense and don’t rush to buy the
post-image
BTC-0.65%
ETH-1.23%
market update
live-cover
LIVE592
Fill up the tank, go collect the few hundred I’m owed last night, and today I don’t even know whether to bet on ETH going up or down?
post-image
ETH-1.26%
$ESPORTS It will keep falling; my accuracy reaches around 98%.
ESPORTS-5.30%
Bearish signals emerge: $XPL Watching for short opportunities
$XPL is currently testing the key 4-hour resistance zone of 0.06393–0.06414, with the price already close to this range. My current approach is to watch whether sellers can establish effective resistance here, without rushing in before a clear market reaction appears.
A few quick observations: - The bearish trend on the daily timeframe remains intact, with sellers continuing to control the pace - On the 4-hour chart, the price is below EMA50, currently quoted at 0.0640, with the structure favoring bears - The 1-hour RSI is 43, wit
post-image
XPL-0.60%
How can out-of-sample testing help prevent mistaking chance patterns in historical market data for a lasting edge?
A trading strategy performing well in historical backtests does not mean it can adapt to future markets. To reduce the risk of overfitting, out-of-sample testing is a crucial step in validating a strategy.
First, what is out-of-sample testing?
Simply put, it means dividing historical data into different periods: one portion is used to develop the strategy and adjust its parameters, while another is excluded from optimization and used specifically to assess how the strategy perform
post-image
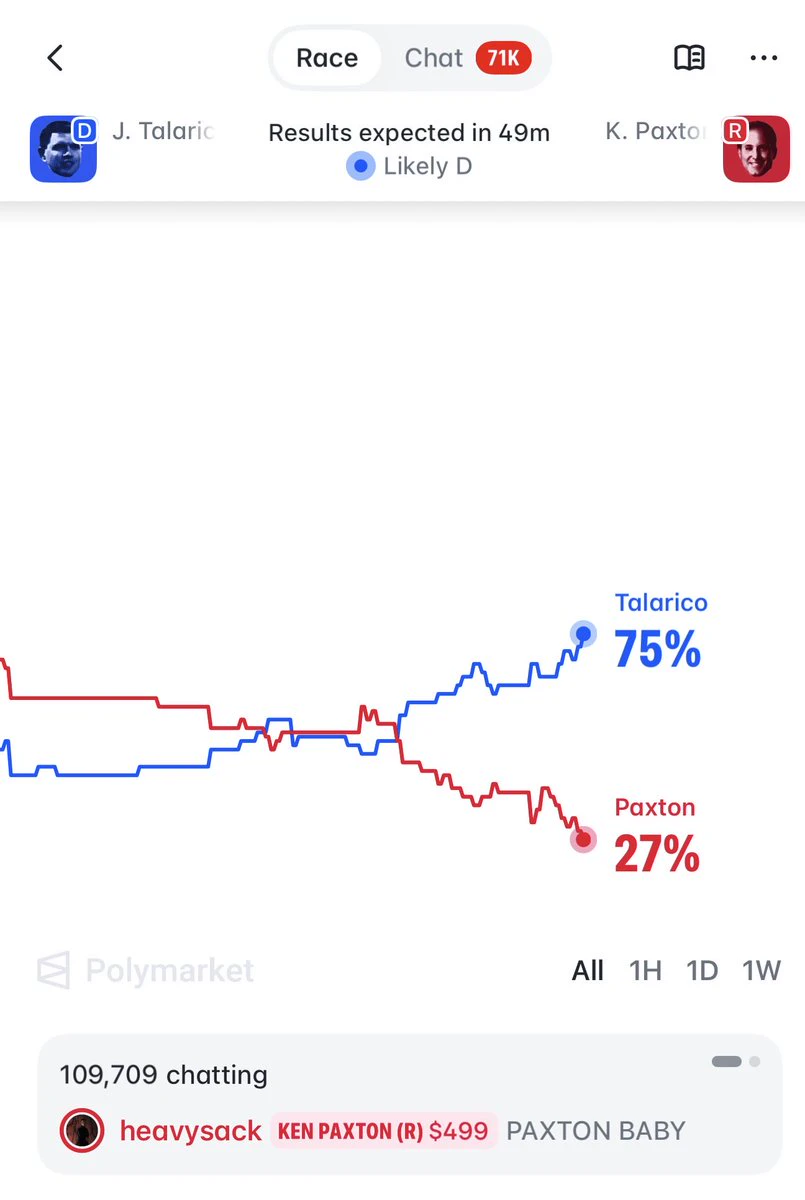
For now, the Democrats are leading in the elections, a major blow to the Trump administration.
post-image
Matt Murphy and Michael Hurlston Fireside Chat: Irrational Recap
post-image
Load More

Join 40 M users in our growing community

⚡️ Join 40 M users in the crypto craze discussion

💬 Engage with your favorite top creators

👍 See what interests you

Trending Topics

USMidtermsVoteToday

31.54k Views870 Discussing

The U.S. midterm elections are being held today, with all 435 House seats and 35 Senate seats on the ballot. The results will shape control of Congress and could influence future fiscal, economic and crypto regulatory policy. What are you watching most closely — control of Congress, fiscal policy or crypto regulation? Which market will price in the outcome first: U.S. stocks, gold or crypto?

GateRanksTop2AcrossMultipleCategories

21.09k Views3.08k Discussing

USEarningsSeason

471.57k Views3.37k Discussing

View More